


Gold Price Dome Cap, Fall Below $1000 Likely
Commodities / Gold and Silver 2015 Apr 13, 2015 - 11:28 AM GMTBy: Clive_Maund

 Although gold has rallied as expected in the last update, the advance has been modest and now it appears to be weakening again, and with its latest COTs showing a marked deterioration and the dollar maintaining its parabolic acceleration, it looks set to drop back along with silver. The long-term uptrend remains down.
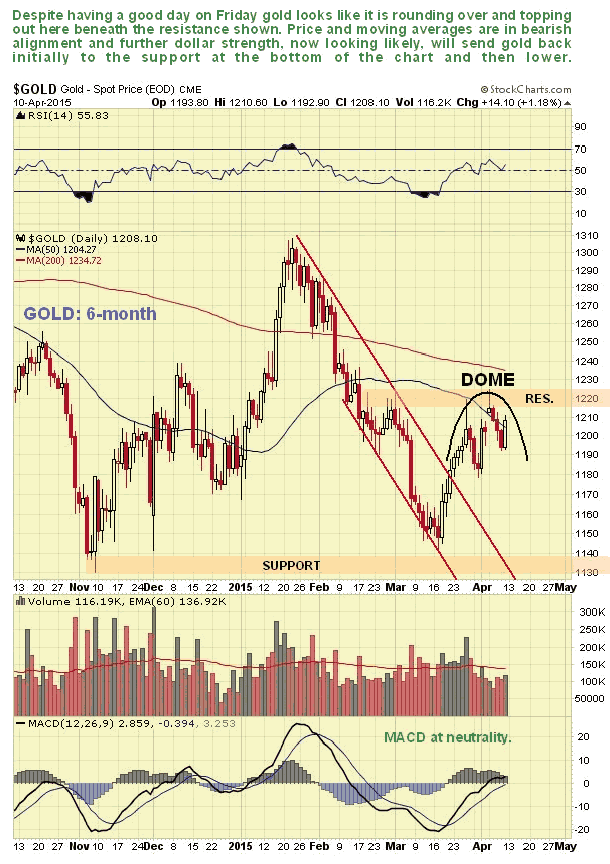
On the 6-month chart we can see how gold's advance following its breakout from a rather steep downtrend has already run into trouble at a resistance level, and it appears to be rounding over within a Dome pattern that looks set to force it into decline. If the dollar accelerates to the upside, looking likely at this point, then gold can be expected to drop back initially to the support shown in the $1130 - $1140 area, and then break lower. Moving averages are in bearish alignment.
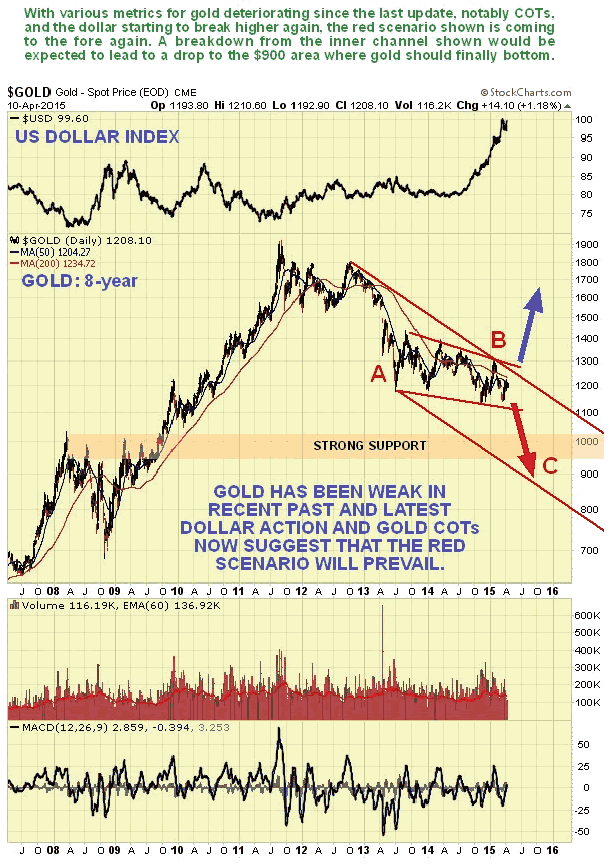
We can see how weak gold's latest rally has been on its 8-year chart - it didn't even make it to the upper boundary of its major downtrend channel. This weakness along with the latest COTs and dollar action suggest that that gold will break below the lower boundary of the inner downtrend channel shown soon and drop more steeply into the zone of strong support shown and towards the lower boundary of the major downtrend, the move probably terminating in the $900 area as the C-wave of a giant A-B-C correction completes.
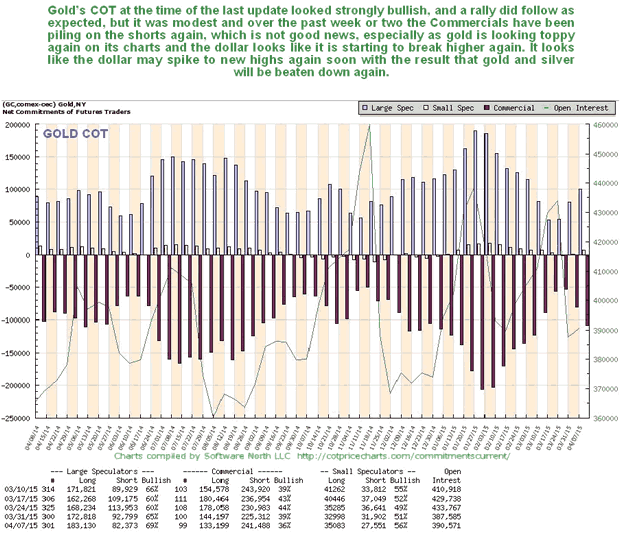
A few weeks back gold's COT was quite strongly bullish, which is why we were bullish, and while we did see a rally it was limited in scope, but as we can see on the latest COT chart below, the Commercials are piling on the shorts again, and even more so in silver, which means trouble, and although they are not yet at an extreme, they have swelled enough to permit a drop.
The latest Gold Hedgers chart is in middling ground, and thus doesn't provide us with much guidance one way or the other regarding the immediate outlook...
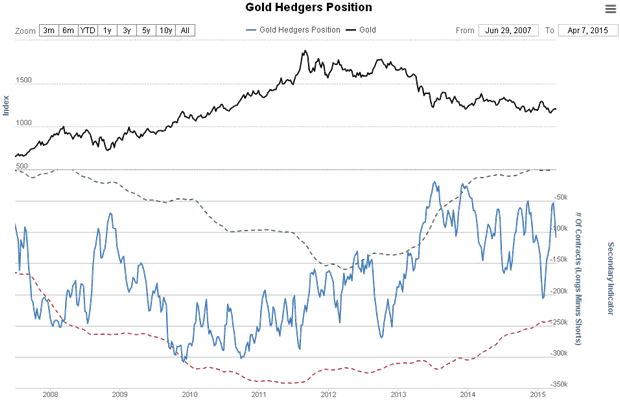
Chart courtesy of www.sentimentrader.com
The latest Gold Optix has rallied off extreme readings on gold's latest weak rally, and while it is still positive overall, it won't prevent a further sizeable drop, which would of course return readings to extremely low levels.
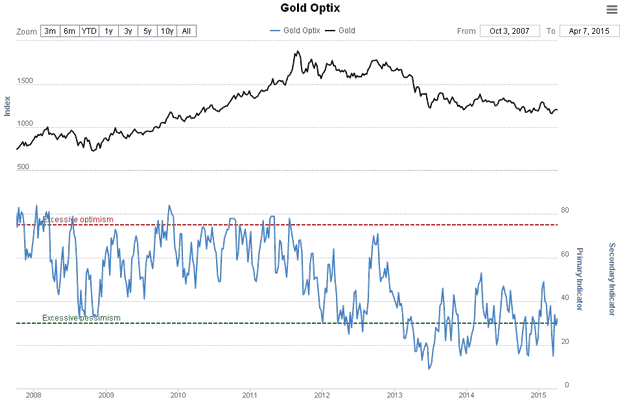
Chart courtesy of www.sentimentrader.com
Rydex Precious Metals holdings are at an extremely low level, and have been for some time, which puts us on notice to look out for a final low in gold before too much longer.
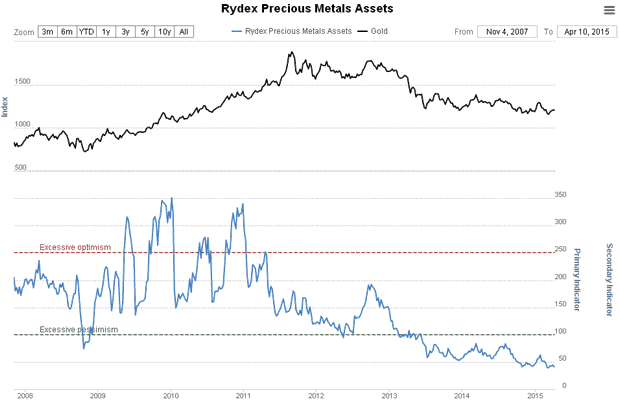
Chart courtesy of www.sentimentrader.com
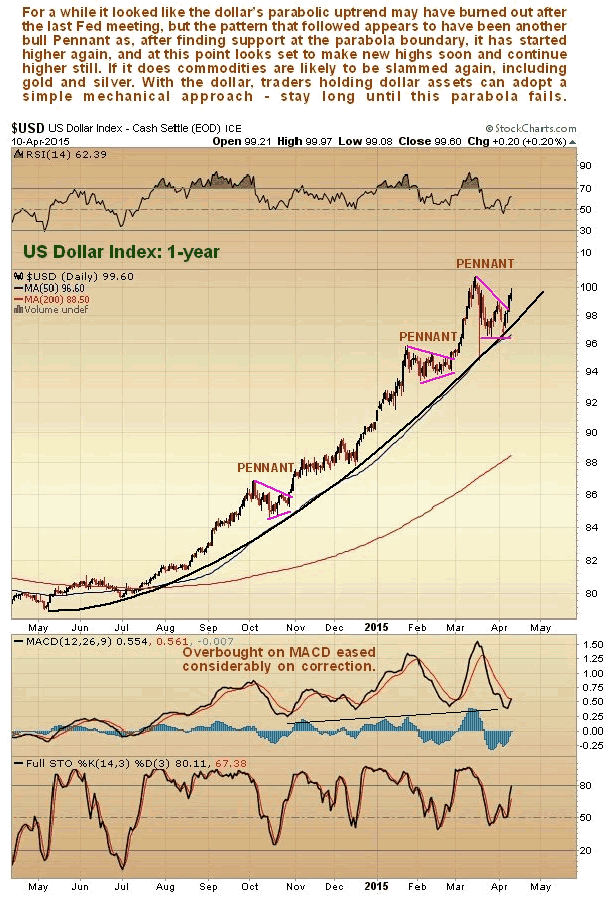
Turning to the dollar, upon which the outlook for most commodities depends, we can see on the 1-year chart for the dollar index that it continues to march higher, shepherded upwards by a clearly defined and steepening parabolic uptrend. On this chart you can readily see why trading on the basis of technicals can sometimes be a lot more worry free than trading on the basis of fundamentals. While a fundamental analyst may spend countless hours poring over information and inputs in an effort to determine the likelihood of the dollar's uptrend continuing, the technical trader can simply declare, "I'm long while the dollar remains above its parabolic uptrend" and then go fishing, leaving the fundamental analyst moldering in his office, poring over details, most of which are irrelevant. It got a bit tricky after the last Fed meeting, which lead to the dollar reacting rather violently, and for a time it looked as if the dollar might have burned out, especially as there was quite heavy downside volume in the dollar proxy ETF, UUP, but last week, after finding support at the parabolic uptrend again, the dollar broke out upside from what it is now evident is another bull Pennant, this time more downward sloping. While it is still possible that a top area is beginning to form, the pragmatic trader can simply stay long until the dollar breaks down from it. We all know what happens when it does break down the parabola - it will be GAME OVER.
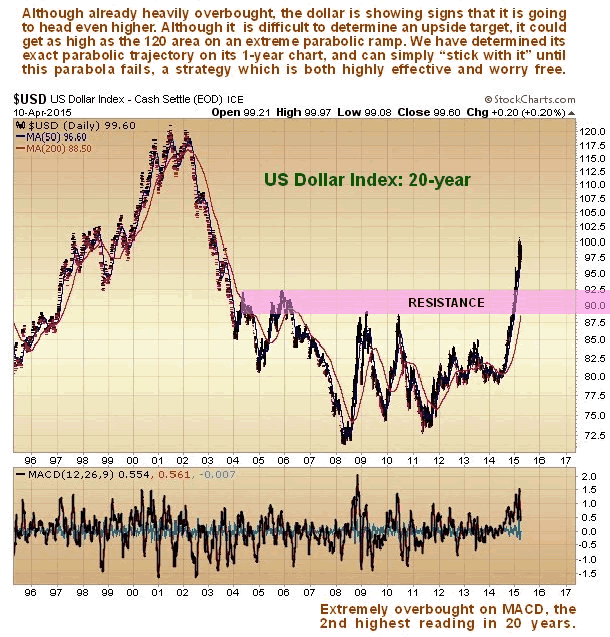
How high could the dollar get? While it could break down at any time, there is a chance that if it accelerates further it could get as high as 120 on the index. Such a move would really "put the cat amongst the chickens" and all hell will break loose, particularly in emerging markets. If you are an American citizen reading this, put a note in your diary to take an overseas vacation immediately if the dollar gets this high - you'll get huge "bang for your buck" and as a dollar spender you'll get treated like royalty, like in the good old days. However, we should stand ready for this parabolic uptrend to end at any time, and exit dollar positions if it does, or swap dollars for other currencies. If this happens at a high level, it will probably mark the final low for gold and silver.
The latest dollar hedgers chart is best described as "hair raising". It is already at wild extremes, and while this won't necessarily prevent further upside acceleration by the dollar over the short to medium-term, it puts us on notice to expect a savage decline once the parabolic uptrend fails...
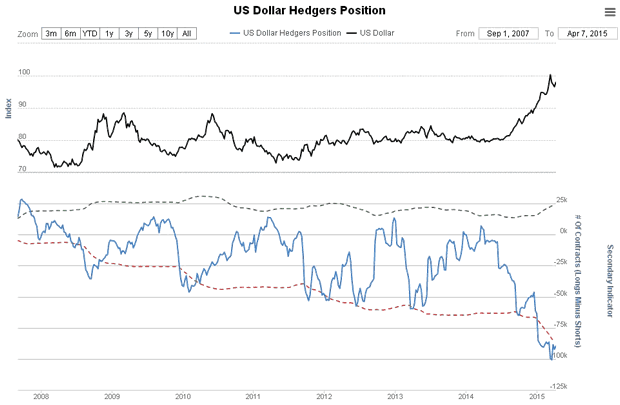
Chart courtesy of www.sentimentrader.com
The latest US dollar Optix, or optimism chart, has moderated somewhat from last time, renewing short-term upside potential, although overall it is still decidedly bearish for the dollar...
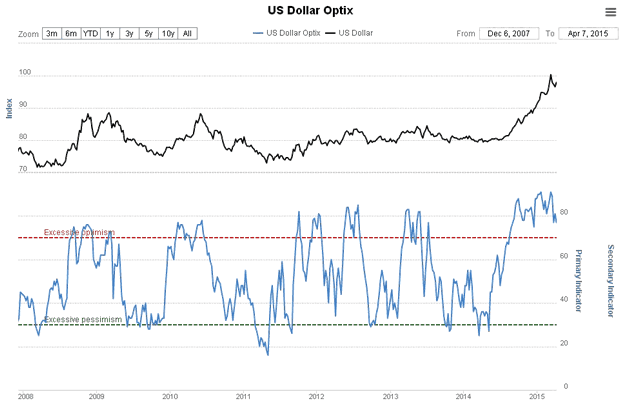
Chart courtesy of www.sentimentrader.com
What would abort the bearish scenario for gold set out here? That is very simple to say - it would be a clear breakout by both gold and silver from their major long-term downtrend channels shown in this update and in the parallel Silver Market update, which would surely be occasioned by the dollar breaking down from its parabolic uptrend.
By Clive Maund
CliveMaund.com
For billing & subscription questions: subscriptions@clivemaund.com
© 2015 Clive Maund - The above represents the opinion and analysis of Mr. Maund, based on data available to him, at the time of writing. Mr. Maunds opinions are his own, and are not a recommendation or an offer to buy or sell securities. No responsibility can be accepted for losses that may result as a consequence of trading on the basis of this analysis.
Mr. Maund is an independent analyst who receives no compensation of any kind from any groups, individuals or corporations mentioned in his reports. As trading and investing in any financial markets may involve serious risk of loss, Mr. Maund recommends that you consult with a qualified investment advisor, one licensed by appropriate regulatory agencies in your legal jurisdiction and do your own due diligence and research when making any kind of a transaction with financial ramifications.
Clive Maund Archive |
© 2005-2022 http://www.MarketOracle.co.uk - The Market Oracle is a FREE Daily Financial Markets Analysis & Forecasting online publication.