


Fed’s Full Normalization and the Stock Market
Stock-Markets / Stock Markets 2015 Jul 03, 2015 - 09:01 PM GMTBy: Zeal_LLC

 The US Federal Reserve has been universally lauded for the apparent success of its extreme monetary policy of recent years. With key world stock markets near record highs, traders universally love the Fed’s zero-interest-rate and quantitative-easing campaigns. But this celebration is terribly premature. The full impact of these wildly-unprecedented policies won’t become apparent until they are fully normalized.
Back in late 2008, the US stock markets suffered their first full-blown panic in 101 years. Technically a panic is a 20% stock-market selloff in a couple weeks, far faster than the normal bear-market pace. In just 10 trading days climaxing in early October 2008, the US’s flagship S&P 500 stock index plummeted a gut-wrenching 25.9%! It felt apocalyptic, the most extreme stock-market event we’ll witness in our lifetimes.
This once-in-a-century fear superstorm terrified the Fed’s elite policymakers on its Federal Open Market Committee. As economists, they are well aware of the stock markets’ powerful wealth effect. With equities cratering, Americans could dramatically slash their spending in response to that devastating loss of wealth and the crippling fear it spawned. And that could very well snowball into a full-blown depression.
Consumer spending drives over two-thirds of all US economic activity, it is far beyond critical. So the Fed felt compelled to do something. But like all central banks, it really only has two powers. It can either print money, or talk about printing money. The legendary newsletter guru Franklin Sanders humorously labels these “liquidity and blarney”. With stock markets burning down in late 2008, the Fed panicked too.
Led by uber-inflationist Ben Bernanke, the Fed embarked on the most extreme money printing of its entire 95-year history to that point. The FOMC cut its benchmark Federal Funds Rate by 50 basis points at an emergency unscheduled meeting on October 8th. It lopped off another 50bp a few weeks later on October 29th. And then on December 16th, it slashed away the remaining 100bp to take the FFR to zero.
The federal-funds market is where banks trade their own capital held at the Fed overnight. It’s that supply and demand that determines the actual FFR, so the Fed can’t set it directly by decree. Instead the Fed defines an FFR target, and then uses open-market operations to boost funds supplies enough to force the FFR down near its target. The Fed creates new money out of thin air to oversupply that market.
When central banks force their benchmark rates to zero through money printing, economists call it a zero-interest-rate policy. Once ZIRP is implemented, a central bank’s conventional monetary-policy tools are exhausted. Once zero-bound, central banks can’t really manipulate short-term interest rates any lower. So they continue printing money, but use it to purchase bonds to force long-term interest rates lower as well.
Historically this was called monetizing debt, and was only seen in small countries that were economic basket cases. Expanding the money supply so rapidly to buy government bonds naturally led to ruinous inflation. But today this exact-same practice is euphemistically known as quantitative easing. QE is truly the last resort of central banks once they succumb to ZIRP, the treacherous final frontier of money printing.
The Fed formally launched QE for the first time ever on November 25th, 2008. That was several weeks before ZIRP was born. Because of intense political opposition to direct monetization of US government debt, the Fed initially started with mortgage-backed bonds. But what later became known as QE1 was expanded to include US Treasuries in mid-March 2009. This marked a watershed event in Fed history.
By conjuring money out of thin air to buy up US Treasuries, the Fed was directly subsidizing the Obama Administration’s record deficit spending. As it purchased Treasuries and transferred brand-new dollars to Washington, the federal government spent this money almost immediately. That injected this vast new monetary inflation directly into the underlying US economy, creating tremendous market distortions.
Nowhere was this more pronounced than in the US stock markets. As the Fed expanded the money supply to buy bonds, its holdings rapidly accumulated which ballooned its balance sheet dramatically. Even though this new inflation was flowing into the bond markets, it had a dramatic impact on the stock markets. Since mid-2009, the S&P 500’s powerful bull market has perfectly mirrored the Fed’s balance sheet!
Whenever one of the Fed’s three QE campaigns was in full swing, the stock markets rose in lockstep with bond purchases. But whenever the Fed’s debt monetizations slowed or stopped, the stock markets consolidated or corrected. This tight relationship between stock-market levels and the Fed’s balance sheet is incredibly important for investors and speculators to understand, as it has serious implications.
In the coming years, the Fed is going to have to normalize both ZIRP and QE. If the Fed drags its feet too long, the global bond markets will force it to act. Normalizing ZIRP means dramatically hiking the Federal Funds Rate, and normalizing QE means selling trillions of dollars of bonds. And only after both interest rates and the Fed’s balance sheet return to normal levels will ZIRP’s and QE’s impact become apparent.
Today’s euphoric and complacent stock traders assume that the first measly quarter-point rate hike will end ZIRP, and that QE concluded in late October 2014 when the FOMC ended its QE3 campaign. But nothing could be farther from the truth! We are only at half-time for the most extreme experiment in US monetary policy in the Fed’s entire history. The fat lady won’t have sung until ZIRP and QE are fully unwound.
This full normalization is epic in scope, and will take the Fed years to accomplish. Stock traders don’t appreciate how extremely anomalous both interest rates and the Fed’s balance sheet are today. This chart reveals the scary truth. It looks at the Federal Funds Rate and yields on 1-year and 10-year US Treasuries over the past 35 years or so. And the Fed’s balance sheet since it was first published in 1991.
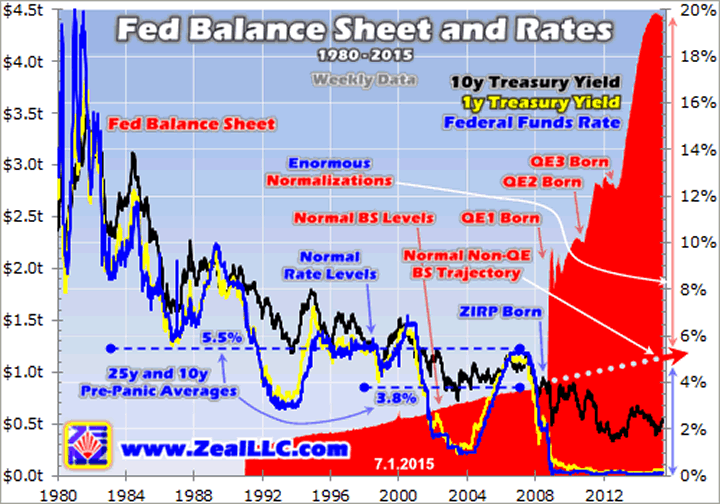
The inflection points in interest rates and money supplies driven by the advent of ZIRP and QE are just massive beyond belief. Short rates totally collapsed near zero, and the Fed’s balance sheet skyrocketed into the stratosphere. The most extreme monetary policies in US history aren’t going to normalize easily. And this process is going to cause great financial pain as stock and bond markets are forced to mean revert lower.
Through its overnight Federal Funds Rate, the Fed utterly dominates the short end of the yield curve. Note above how yields on 1-year US Treasuries track the FFR nearly flawlessly. So just like during past Fed rate-hike cycles, the rising FFR is going to push up the entire spectrum of short-term interest rates. And this normalization process will require a long series of rate hikes, not just today’s popular “one and done” fantasy.
The very word normalization denotes something manipulated away from norms returning back to those very norms. So defining “normal” FFR levels is important to get an idea of how high the Fed is going to have to hike. Since late 2008’s stock panic scared the Fed into going full-on ZIRP for the first time ever, everything since is definitely not normal. Nor were the super-high rates of the early 1980s, the opposite extreme.
But between those two FFR anomalies was a 25-year window running from 1983 to 2007. This quarter-century span is the best measure of normal we can get in modern history. It encompasses all kinds of economic and stock-market conditions, including multiple severe crises. Throughout all of it, the Federal Funds Rate averaged 5.5% on a weekly basis. That is normal, where the Fed will eventually have to return.
While today’s hyper-complacent stock traders are fixated on the Fed’s first rate hike in 9 years, that’s only 25 basis points. The Fed needs to do a full 550bp of hikes! At a mere quarter-point at a time, a full normalization would take 22 hikes! And that’s probably how it will play out, as the Fed is too scared of roiling stock traders to hike faster. The last Fed rate hike exceeding 25bp happened way back in May 2000.
The Fed’s policy-deciding Federal Open Market Committee meets 8 times a year, and only raises rates at those scheduled meetings to minimize the risk of shocking the markets. So the 22 quarter-point rate hikes required for full normalization would take nearly 3 years without any interruptions! That’s an awfully-long time for higher rates and the resulting bearish psychology to weigh heavily on lofty stock markets.
Despite the one-and-done hopes of stock traders today, it’s really risky for the Fed to start and stop rate hikes in an erratic fashion. The more unpredictable any tightening cycle is, the more damage it will do to stock-market sentiment. So this coming rate-hike cycle is likely to play out like the last one between June 2004 to June 2006. Over that 2-year span the Fed hiked 17 times more than quintupling the FFR to 5.25%!
While slashing the FFR to zero manipulated the short end of the yield curve, the Fed’s utterly-monstrous purchases of US Treasuries actively manipulated the long end. The FOMC was very open about this mission, including a sentence about QE in its meeting statements that read “these actions should maintain downward pressure on longer-term interest rates”. Excess bond demand forces long rates lower.
Since the dawn of the ZIRP and QE era in early 2009, the yield on benchmark US 10-year Treasuries has averaged just 2.6%. This rate is exceedingly important to US economic activity, as it determines the pricing of mortgages. Artificially-low long rates have led to artificially-low mortgage rates, which fueled a boom in housing-related activity just as the Fed intended. A full normalization will totally wipe this out.
In that quarter-century span between the early 1980s rate spikes and the 2008 stock panic’s introduction of ZIRP, yields on 10-year Treasuries averaged 6.9%. That is fully 2.6x higher than today’s manipulated levels! As the Fed normalizes its balance sheet by letting its QE-purchased bonds mature and roll off, long rates will absolutely return to normal levels. And the market and economic impacts will be adverse and vast.
In mid-June, 30-year fixed-rate mortgage pricing climbed back over 4.0% as 10-year Treasury yields regained 2.4%. That’s a 1.6% premium over what the US government can borrow for. So when 10-year Treasury yields are fully normalized in the coming years, 30-year mortgage rates will likely soar to at least 8.5%! That’s certainly not unprecedented, these rates averaged 8.1% throughout the entire 1990s.
That wealth effect the Fed fears slowing consumer spending applies to housing prices even more so than stock-market levels, since far more Americans have most of their wealth in houses than in stocks. Mortgage prices more than doubling would have a drastic impact on house prices, since people could only afford to borrow much less. So the debt-fueled real-estate boom is going to collapse as rates normalize.
Bond prices will crater too. Regardless of the yields bonds were originally issued at, they’re bought and sold in the marketplace until their coupon yields equal prevailing rate levels. So traders will dump bonds aggressively as rates mean revert higher, leading to steep losses in principal for the great majority of bonds that are not held to maturity. And the Fed’s selling as it normalizes its balance sheet will exacerbate this.
As the chart above shows, the Fed’s balance sheet naturally rises over time as this central bank inflates the supply of US dollars. But its pre-QE trajectory was well-defined and relatively mild. Once the Fed reached ZIRP and could cut no more, it launched QE which led to a balance-sheet explosion. This too will have to mean revert dramatically lower in the Fed’s full normalization, with terrifying bond-market implications.
In the first 8 months of 2008 before that once-in-a-century stock panic, the Fed’s balance sheet was averaging $849b. At its recent peak level in mid-February 2015, all those years of QE bond buying had mushroomed it to $4474b! That’s a 5.3x increase in just 6.5 years. The great majority of that has to be unwound, or that vast deluge of new dollars will eventually lead to massive and devastating inflation.
If the normal trajectory of the Fed’s balance sheet before the stock panic is extended to today, it suggests a normal balance-sheet level of around $1100b. To return to there from today’s incredibly-high QE-bloated levels would require a staggering $3329b of bond selling from the Fed! Even though it will take years for this to unfold, $3.3t of central-bank bond selling will force bond prices much lower. And thus rates higher!
Higher rates won’t just decimate the bond markets, but also wreak havoc in today’s super-overvalued and radically-overextended stock markets. Higher rates hit stocks on multiple fronts. They make shifting capital out of stocks into higher-yielding bonds more attractive, leading to capital outflows from the stock markets. The higher debt-servicing expenses also directly erode corporate profits, leaving stocks more overvalued.
But today’s main stock-market threat from rising rates is their impact on corporate buybacks. These are the primary reason why the S&P 500 level so perfectly mirrored the ballooning Fed balance sheet of recent years. American companies took advantage of the artificially-low interest rates to borrow vast sums of money not to invest in growing their businesses, but to use to buy back and manipulate their stock prices.
Last year for example, stock repurchases by the elite S&P 500 companies ran a staggering $553b! That was their highest level since the last cyclical bull market was peaking in 2007. Since these buybacks are largely financed by cheap money courtesy of ZIRP and QE, the Fed’s normalization is going to just garrote buybacks. And they are the overwhelmingly-dominant source of capital chasing these lofty stock markets.
So the massive coming normalization of interest rates and the Fed’s bond holdings are very bearish for stocks as well as bonds. That’s one reason why traders are so pathologically fixated on the next rate-hike cycle. The smart ones know full well that it will end this Fed-conjured market fiction and lead to enormous mean reversions lower in both stock and bond prices. Full normalization will spawn a bear market.
Ironically the asset class that will benefit most from rate hikes is the one traders least expect, gold. The conventional wisdom today believes gold is going to get wrecked by rising rates since it has no yield. But just the opposite has proven true historically! Gold is an alternative asset, and demand for these critical portfolio diversifiers soars when conventional stocks and bonds are struggling. Like during rate hikes.
During the Fed’s last rate-hike cycle between June 2004 and June 2006 where the Federal Funds Rate was more than quintupled to 5.25%, gold actually soared 50% higher! And in the 1970s when the Fed catapulted its FFR from 3.5% in early 1971 to a crazy 20.0% by early 1980, gold skyrocketed an astounding 24.3x higher! Higher rates really hurt stocks and bonds, rekindling investment demand for alternatives.
The Fed’s inevitable coming full normalization of ZIRP and QE is going to be vastly more impactful than traders today appreciate. When interest rates rise and the Fed’s bond holdings fall, there’s no way that stock and bond prices are going to remain anywhere near today’s lofty artificial central-bank-goosed levels. The full normalization is going to greatly alter the global investing landscape, creating a minefield.
So it’s never been more important to cultivate great sources of contrarian information, long our specialty at Zeal. We publish acclaimed weekly and monthly newsletters for speculators and investors. They draw on our exceptional market experience, knowledge, and wisdom forged over decades to explain what’s going on in the markets, why, and how to trade them with specific stocks. Since 2001, all 700 stock trades recommended in our newsletters have averaged annualized realized gains of +21.3%! Subscribe today, we’re running a limited-time 33%-off sale!
The bottom line is the Fed’s post-stock-panic policies have been extreme beyond belief. They have led to epic distortions in the global markets. These markets are going to force the Fed to fully normalize the wildly-anomalous conditions it created with ZIRP and QE. And with interest rates and the Fed’s balance sheet at such extreme levels today, the coming normalization will be very treacherous and take years to unfold.
Today’s euphoric stock traders believe ZIRP and QE have been huge successes, but the jury is still out until they’ve run their courses and been fully unwound. The most-extreme monetary experiment by far in US history is just at half-time now, the fat lady hasn’t even taken the stage. The full normalization of ZIRP and QE is likely to be as negative for stock and bond prices as its ramping up proved positive for them.
Adam Hamilton, CPA
So how can you profit from this information? We publish an acclaimed monthly newsletter, Zeal Intelligence , that details exactly what we are doing in terms of actual stock and options trading based on all the lessons we have learned in our market research. Please consider joining us each month for tactical trading details and more in our premium Zeal Intelligence service at … www.zealllc.com/subscribe.htm
Questions for Adam? I would be more than happy to address them through my private consulting business. Please visit www.zealllc.com/adam.htm for more information.
Thoughts, comments, or flames? Fire away at zelotes@zealllc.com . Due to my staggering and perpetually increasing e-mail load, I regret that I am not able to respond to comments personally. I will read all messages though and really appreciate your feedback!
Copyright 2000 - 2015 Zeal Research ( www.ZealLLC.com )
Zeal_LLC Archive |
© 2005-2022 http://www.MarketOracle.co.uk - The Market Oracle is a FREE Daily Financial Markets Analysis & Forecasting online publication.