


The Great Fall Of China Started At Least 4 Years Ago
Economics / China Economy Nov 19, 2015 - 10:30 AM GMTBy: Raul_I_Meijer

 Looking through a bunch of numbers and graphs dealing with China recently, it occurred to us that perhaps we, and most others with us, may need to recalibrate our focus on what to emphasize amongst everything we read and hear, if we’re looking to interpret what’s happening in and with the country’s economy.
It was only fair -perhaps even inevitable- that oil would be the first major commodity to dive off a cliff, because oil drives the entire global economy, both as a source of fuel -energy- and as raw material. Oil makes the world go round.
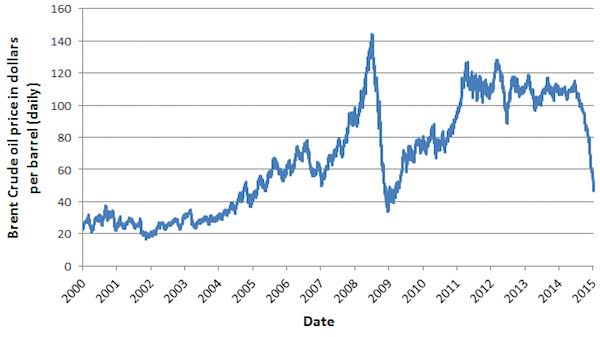
But still, the price of oil was merely a lagging indicator of underlying trends and events. Oil prices didn‘t start their plunge until sometime in 2014. On June 19, 2014, Brent was $115. Less than seven months later, on January 9, it was $50.
Severe as that was, China’s troubles started much earlier. Which lends credence to the idea that it was those troubles that brought down the price of oil in the first place, and people were slow to catch up. And it’s only now other commodities are plummeting that they, albeit very reluctantly, start to see a shimmer of ‘the light’.
Here are Brent oil prices (WTI follows the trend closely):
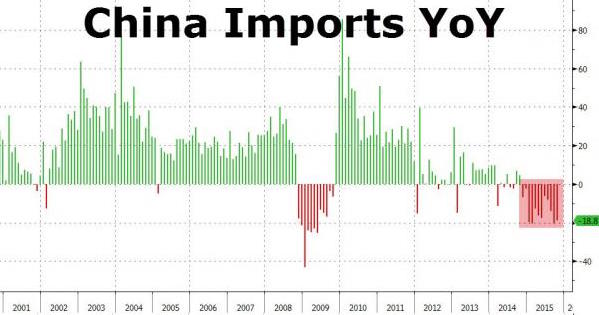
They happen to coincide quite strongly with the fall in Chinese imports, which perhaps makes it tempting to correlate the two one-on-one:
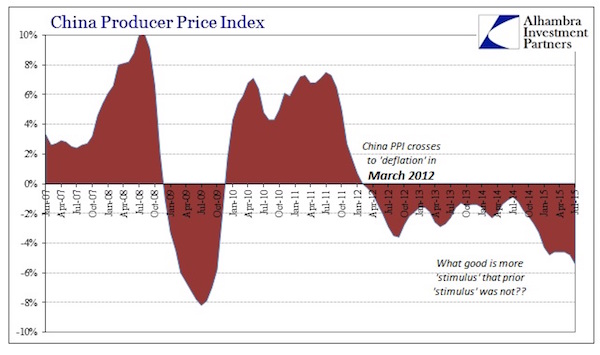
But this correlation doesn’t hold up. And that we can see when we look at a number everyone seems to largely overlook, at their own peril, producer prices:
About which Bloomberg had this to say:
China Deflation Pressures Persist As Producer Prices Fall 44th Month
China’s consumer inflation waned in October while factory-gate deflation extended a record streak of negative readings [..] The producer-price index fell 5.9%, its 44th straight monthly decline. [..] Overseas shipments dropped 6.9% in October in dollar terms while weaker demand for coal, iron and other commodities from declining heavy industries helped push imports down 18.8%, leaving a record trade surplus of $61.6 billion.
44 months is a long time. And March 2012 is a long time ago. Oil was about at its highest since right before the 2008 crisis took the bottom out. And if you look closer, you can see that producer prices started ‘losing it’ even earlier, around July 2011.
Something was happening there that should have warranted more scrutiny. That it didn’t might have a lot to do with this:
China’s debt-to-GDP ratio has risen by nearly 50% in the past four years.
The producer price index seems to indicate that trouble started over 4 years ago. China dug itself way deeper into debt since then. It already did that before as well (especially since 2008), but the additional debt apparently couldn’t be made productive anymore. And that’s an understatement.
Now, if you want to talk correlation, compare the producer price graph above with Bloomberg’s global commodities index:
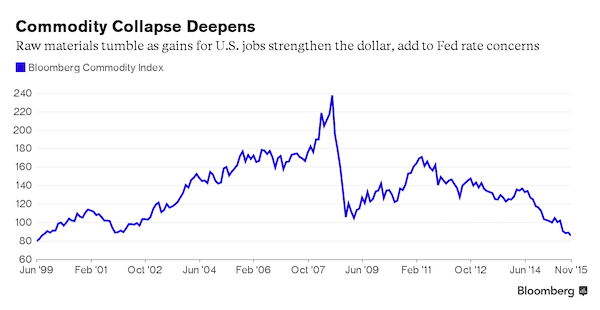
World commodities markets, like the entire global economy, were propped up by China overinvestment ever since 2008. Commodities have been falling since early 2011, after rising some 60% in the wake of the crisis. And after the 2011 peak, they’ve dropped all the way down to levels not seen since 1999. And they keep on falling: steel, zinc, copper, aluminum, you name it, they’re all setting new lows almost at a daily basis.
Moreover, if we look at how fast China imports are falling, and we realize how much of those imports involve (raw material) commodities, we can’t escape the conclusion that here we’re looking at not a lagging, but a predictive indicator. What China doesn’t purchase in raw materials today, it can’t churn out as finished products tomorrow.
Not as exports, and not as products to be used domestically. Neither spell good news for the Chinese economy; indeed, the rot seems to come from both sides, inside and out. And no matter how much Beijing points to the ‘service’ economy it claims to be switching towards, with all the debt that is now deflating, and the plummeting marginal productivity of new debt, most of it looks like wishful thinking.
And that is not the whole story either. Closely linked to the sinking marginal productivity, there is overleveraged overcapacity and oversupply. It’s like the proverbial huge ocean liner that’s hard to turn around.
There are for instance lots of new coal plants in the pipeline:
China Coal Bubble: 155 Coal-Fired Power Plants To Be Added To Overcapacity
China has given the green light to more than 150 coal power plants so far this year despite falling coal consumption, flatlining production and existing overcapacity. [..] in the first nine months of 2015 China’s central and provincial governments issued environmental approvals to 155 coal-fired power plants — that’s 4 per week. The numbers associated with this prospective new fleet of plants are suitably astronomical. Should they all go ahead they would have a capacity of 123GW, more than twice Germany’s entire coal fleet; their carbon emissions would be around 560 million tonnes a year, roughly equal to the annual energy emissions of Brazil; they would produce more particle pollution than all the cars in Beijing, Shanghai, Tianjin and Chongqing put together [..]
And new car plants too:
China’s Demand For Cars Has Slowed. Overcapacity Is The New Normal.
For much of the past decade, China’s auto industry seemed to be a perpetual growth machine. Annual vehicle sales on the mainland surged to 23 million units in 2014 from about 5 million in 2004. [..] No more. Automakers in China have gone from adding extra factory shifts six years ago to running some plants at half-pace today—even as they continue to spend billions of dollars to bring online even more plants that were started during the good times.
The construction spree has added about 17 million units of annual production capacity since 2009, compared with an increase of 10.6 million units in annual sales [..] New Chinese factories are forecast to add a further 10% in capacity in 2016—despite projections that sales will continue to be challenged. [..] “The players tend to build more capacity in hopes of maintaining, or hopefully, gain market share. Overcapacity is here to stay.”
These are mere examples. Similar developments are undoubtedly taking place in many other sectors of the Chinese economy (how about construction?!). China has for example started dumping its overproduction of steel and aluminum on world markets, which makes the rest of the world, let’s say, skittish. The US is levying a 236% import tax on -some- China steel. The UK sees its remaining steel industry vanish. All US aluminum smelters are at risk of closure in 2016.
The flipside, the inevitable hangover, that China will wake up to sooner rather than later, is the debt that its real growth, and then it’s fantasy growth, has been based on. We already dealt extensively with the difference between ‘official’ and real growth numbers, let’s leave that topic alone this time around.
Though we can throw this in. Goldman Sachs recently said that even if the official Beijing growth numbers were right -which nobody believes anymore- ”Chinese credit growth is still running at roughly double the rate of GDP growth”. And even if credit growth may appear to be slowing a little, though we’d have to know the shadow banking numbers to gauge that (and we don’t), that hangover is still looming large:
Looking at the producer price graph, we see that the downfall started at least 44 months ago, and that 52 months is just as good an assumption. And we know that debt rose 50% or more since the downfall started. That does put things in a different perspective, doesn’t it? (Probably) the majority of pundits and experts will still insist on a soft landing at worst.
But for those who don’t, please consider the overwhelming amount of deflationary forces that is being unleashed on the world as all that debt goes sour. As the part of that debt that was leveraged vanishes into thin air.
It’s ironic to see that it’s at this very point in time that the IMF (Christine Lagarde seems eager to take responsibility) seeks to include the yuan in its SDR basket. Xi Jinping’s power over the exchange rate can only be diminished by such a move, and we’re not at all sure he realizes to what extent that is true. Chinese politics are built on hubris, and that goes only so far when you free float but don’t deliver.
To summarize, do you remember what you were doing -and thinking- in mid-2011 and/or early 2012? Because that’s when this whole process started. Not this year, and not last year.
China’s producers couldn’t get the prices they wanted anymore, as early as 4 years ago, and that’s where deflationary forces came in. No matter how much extra credit/debt was injected into the money supply, the spending side started to stutter. It never recovered.
By Raul Ilargi Meijer
Website: http://theautomaticearth.com (provides unique analysis of economics, finance, politics and social dynamics in the context of Complexity Theory)© 2015 Copyright Raul I Meijer - All Rights Reserved Disclaimer: The above is a matter of opinion provided for general information purposes only and is not intended as investment advice. Information and analysis above are derived from sources and utilising methods believed to be reliable, but we cannot accept responsibility for any losses you may incur as a result of this analysis. Individuals should consult with their personal financial advisors.
Raul Ilargi Meijer Archive |
© 2005-2022 http://www.MarketOracle.co.uk - The Market Oracle is a FREE Daily Financial Markets Analysis & Forecasting online publication.