


Silver Is a Strong Buy
Commodities / Gold and Silver 2018 Dec 28, 2017 - 03:33 PM GMTBy: Clive_Maund

 For many weeks we have been waiting patiently, like vultures perched on the branches of trees, for the Large Specs to go belly up and croak, and the good news is that they just have, so it's time for us to swoop down and feast on the carcasses, the carcasses being silver and the better silver stocks, which are at good prices here, and although they have already started rallying over the past week or two, the COT structure is now much healthier, suggesting that they will continue to advance.
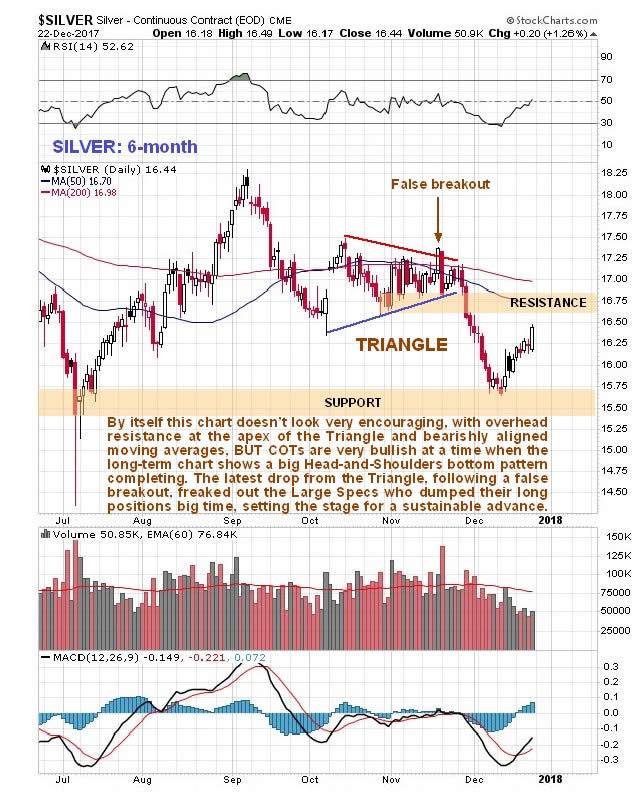
On the 6-month silver chart we can see the breakdown from a Symmetrical triangle that occurred late in November leading to a drop well into December, and also how silver has slowly recovered over the past two weeks. In itself this chart looks bearish, with a breakdown followed by a rally back up towards resistance, and moving averages in unfavorable alignment, and it is only when we consider the latest COTs and then look at long-term charts that we realize that the setup is a lot more bullish than it looks at first sight on this 6-month chart.
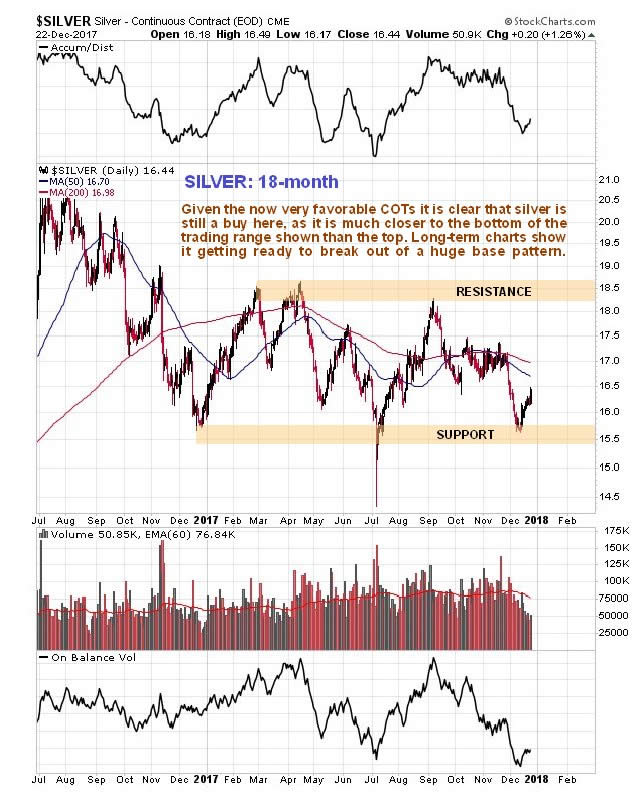
Next we will look at a 18-month silver chart, the main reason being so that we can compare the peaks and troughs on it directly to the 1-year COT chart placed below it. On this chart we can see that the silver price is within the confines of a large gently downsloping trading range bounded by approximately $15.25 on the downside and $18.50 on the upside. This chart makes clear why it turned up where it did a couple of weeks ago—it had arrived at a zone of support towards its July lows.
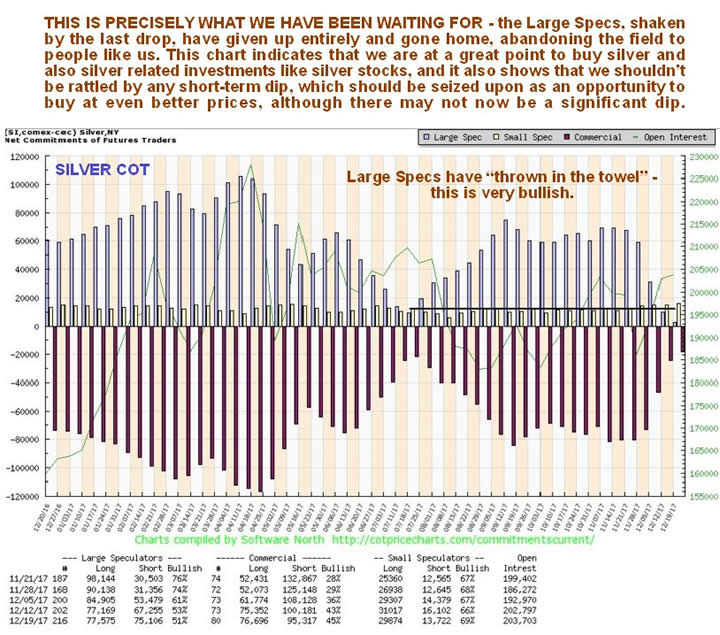
The latest silver COT chart shows a remarkable improvement in the COT structure in the space of just four weeks, remarkable because the drop in the silver price that triggered it was not all that great. What this COT chart shows us is that this latest drop in the silver price was “the last straw” for the Large Specs, who have "thrown in the towel," with the huge profits made by Bitcoin speculators in recent weeks making them feel like right lemons. If you had to give a job description for the Large Specs in silver, the most accurate one would be "bagholder" since collectively they are always wrong, and you certainly don't want to see them with a big long position if you are contemplating buying. Right now they are nowhere to be seen—they have fled, which means that the coast is clear for Smart Money buyers. There have been some doubts expressed with respect to silver in the recent past along the lines that either it will drop to new lows, or double dip to its lows of approximately two weeks ago, but the latest COT suggests that a drop to new lows is probably out of the question, and further that while we cannot rule out a drop towards the lows of two weeks ago, it looks unlikely, and should it do so, aggressive buying will be in order. Here we should note that a favorable COT setup generally leads to a rally, but does not, by itself, mean that a new bull market is set to start, although it is normally a precondition for a new bull market.
The latest Hedgers chart, a form of COT chart, also looks good for silver, and because this chart goes back much further than the COT chart, it enables us to see what happened to the silver price following peaks on this chart going back years.
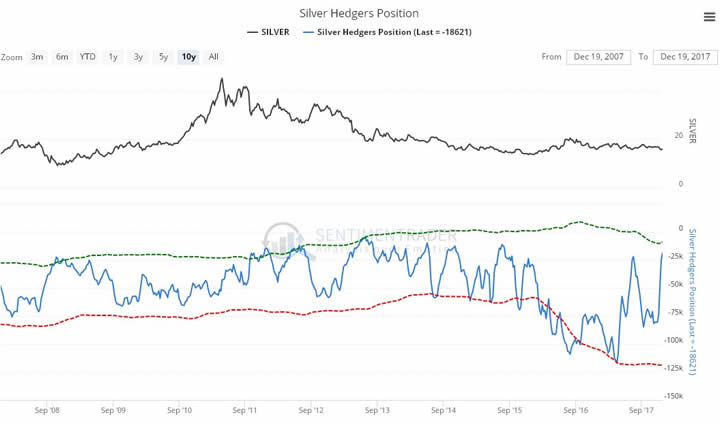
Chart courtesy of sentimentrader.com
The long-term 10-year chart calls to mind the excellent film Groundhog Day, where a guy keeps living the same day over and over, because we just keep trotting out the same description for the long-term silver chart (which does save work). Here it is again, with some adjustment:
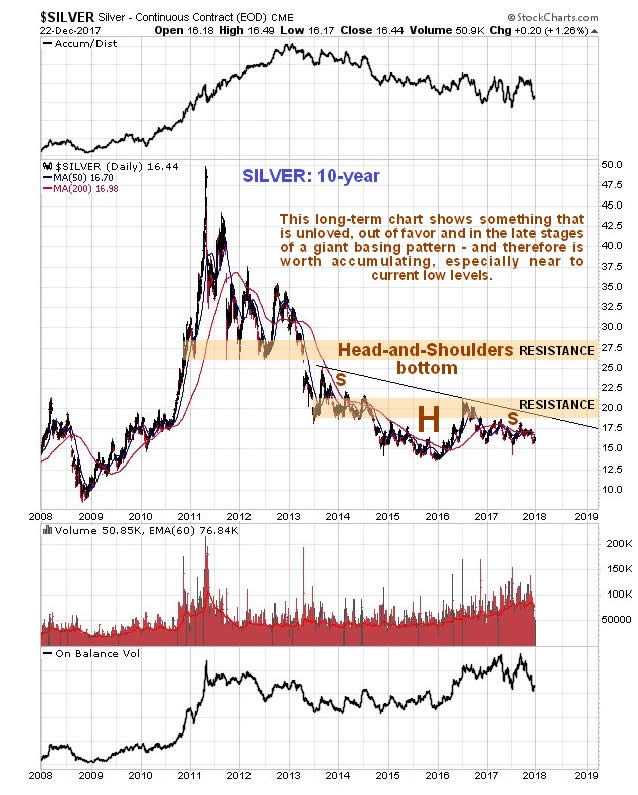
Like gold, silver is marking out a giant Head-and-Shoulders bottom pattern, but in silver's case it is downsloping as we can see on its 10-year chart below, which reflects the fact that silver tends to underperform gold at the end of sector bear markets and during the early stages of sector bull markets. Prolonged underperformance by silver is therefore a sign of a bottom. This chart really does show how unloved silver is right now, and while we have seen some deterioration in its volume indicators in recent weeks, more important is the big improvement in the COT structure detailed above. A break above the neckline of the pattern, the black line, will be a positive development, and more so a break above the band of resistance approaching the 2016 highs. Once it gets above this it will have to contend with a quite strong zone of resistance roughly between $26 and $28.
Finally, we see that silver's best month of the year is coming right up!
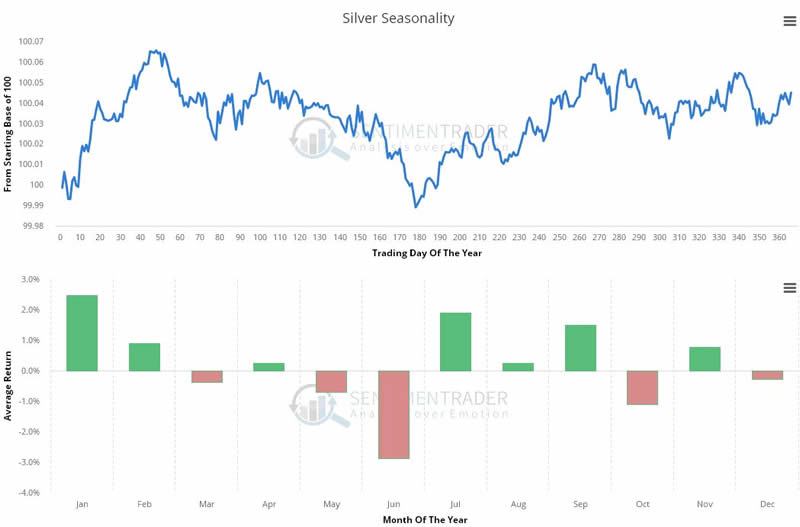
Chart courtesy of www.sentimentrader.com
The conclusion is that silver is now a strong buy, and an even stronger buy in the event that it should react back short term towards its lows of about two weeks ago. While we can speculate about why the silver price should rise soon, with reasons such as a falling dollar, and funds flowing out of the cryptos as a result of the Bitcoin bust, an attack on Iran, etc, it is not really necessary as the charts speak for themselves.
Clive Maund has been president of www.clivemaund.com, a successful resource sector website, since its inception in 2003. He has 30 years of experience in technical analysis and has worked for banks, commodity brokers and stockbrokers in the City of London. He holds a Diploma in Technical Analysis from the UK Society of Technical Analysts.
Disclosure:
1) Statements and opinions expressed are the opinions of Clive Maund and not of Streetwise Reports or its officers. Clive Maund is wholly responsible for the validity of the statements. Streetwise Reports was not involved in the content preparation. Clive Maund was not paid by Streetwise Reports LLC for this article. Streetwise Reports was not paid by the author to publish or syndicate this article.
2) This article does not constitute investment advice. Each reader is encouraged to consult with his or her individual financial professional and any action a reader takes as a result of information presented here is his or her own responsibility. By opening this page, each reader accepts and agrees to Streetwise Reports' terms of use and full legal disclaimer. This article is not a solicitation for investment. Streetwise Reports does not render general or specific investment advice and the information on Streetwise Reports should not be considered a recommendation to buy or sell any security. Streetwise Reports does not endorse or recommend the business, products, services or securities of any company mentioned on Streetwise Reports.
Charts provided by the author.
CliveMaund.com Disclosure:
The above represents the opinion and analysis of Mr Maund, based on data available to him, at the time of writing. Mr. Maund's opinions are his own, and are not a recommendation or an offer to buy or sell securities. Mr. Maund is an independent analyst who receives no compensation of any kind from any groups, individuals or corporations mentioned in his reports. As trading and investing in any financial markets may involve serious risk of loss, Mr. Maund recommends that you consult with a qualified investment advisor, one licensed by appropriate regulatory agencies in your legal jurisdiction and do your own due diligence and research when making any kind of a transaction with financial ramifications. Although a qualified and experienced stockmarket analyst, Clive Maund is not a Registered Securities Advisor. Therefore Mr. Maund's opinions on the market and stocks can only be construed as a solicitation to buy and sell securities when they are subject to the prior approval and endorsement of a Registered Securities Advisor operating in accordance with the appropriate regulations in your area of jurisdiction.
© 2005-2022 http://www.MarketOracle.co.uk - The Market Oracle is a FREE Daily Financial Markets Analysis & Forecasting online publication.