


Stock Market Turn In The Tide - Have a Happy Bear Market!
Stock-Markets / Stock Markets 2018 Dec 17, 2018 - 04:39 PM GMTBy: Plunger

 Using Charles Dow’s well known method of reading the stock market’s movements , on Friday December 14th 2018 , the averages confirmed a bearish indication and can now be classified to be in a bear market. This action Friday is the first occurrence of a valid bear market signal in 11 years. Together the Dow Industrials and Transportation averages triggered a bear market signal following a major bull market of unprecedented duration of almost 10 years. After 10 years of unprecedented monetary and policy intervention by the central banks of the world intending to fuel the bull market, the signal indicates the bull market has reached exhaustion and the primary trend has now reversed.
The implications of such a signal are beyond the ability of the vast majority of citizens to comprehend since a bear market has not been allowed to run its course since December 1974. Furthermore, an entire generation of investors has not even experienced a market in a primary downtrend since as has been 10 years since such an event last occurred.
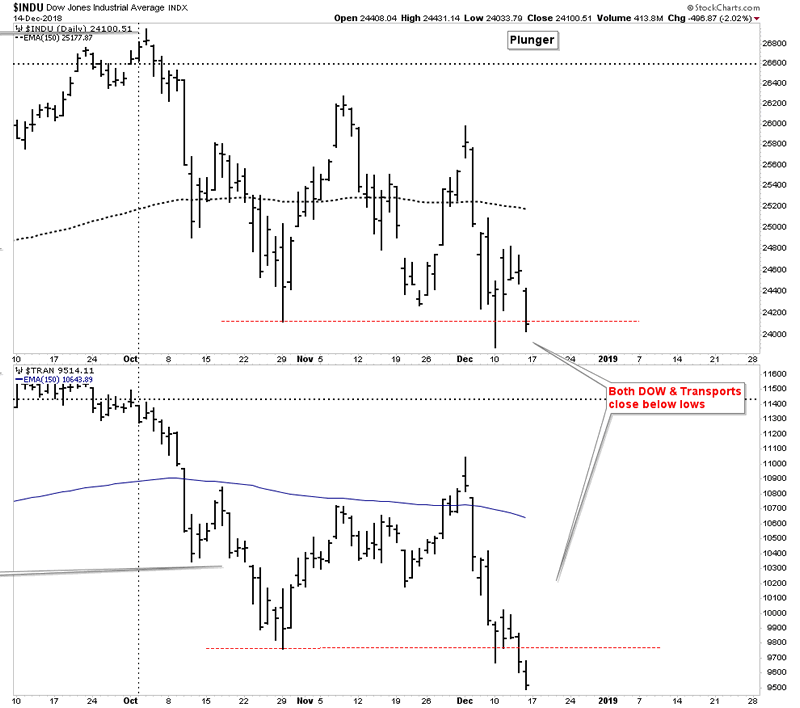
On Friday both the DOW and the Transport’s both closed below their secondary reaction lows thus triggering the conditions to classify it as a bear market. Let’s review this process and then discuss the over arching meaning of this event. Perhaps you should print out and store this report as a memento to show later on that you were there with full knowledge when the turn in the tide occurred.
January 2018- Global Synchronous Top.
Below shows all of the stock markets of the world ex-USA. These markets combined, put in a cathedral top in January caused by a final burst of speculation expressing itself as a final spike of activity. Typically at such tops there is an object of speculation which focuses the public’s attention on one particular asset. Classically, bitcoin seems to have filled this roll , as the bitcoin mania peaked simultaneously with world markets.
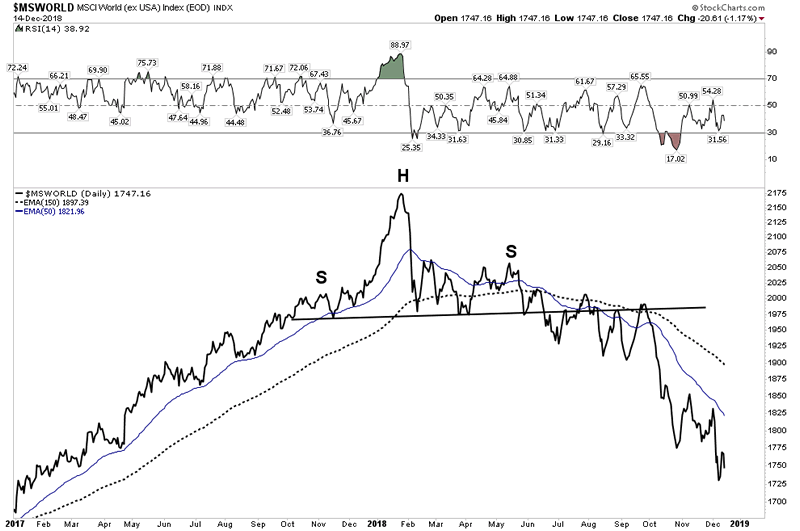
The entire year of 2018 served as an unfolding process of market tops. First hit were markets at the periphery of the world’s economies. The emerging markets were ravaged leaving no place to hide. Stock and bond markets got creamed in these countries and fleeing to cash was no safe haven as their local currencies got slaughtered as well. One had to send his funds into the core of the financial system to find a safe haven – the USD. Throughout the year senior markets entered their own bear markets such as Asia, Hong Kong and Europe. The weakness in these markets actually served to elevate the US market as cash flowed to the USA searching for safety. Below we see how the USA diverged with the rest of the world until late September:

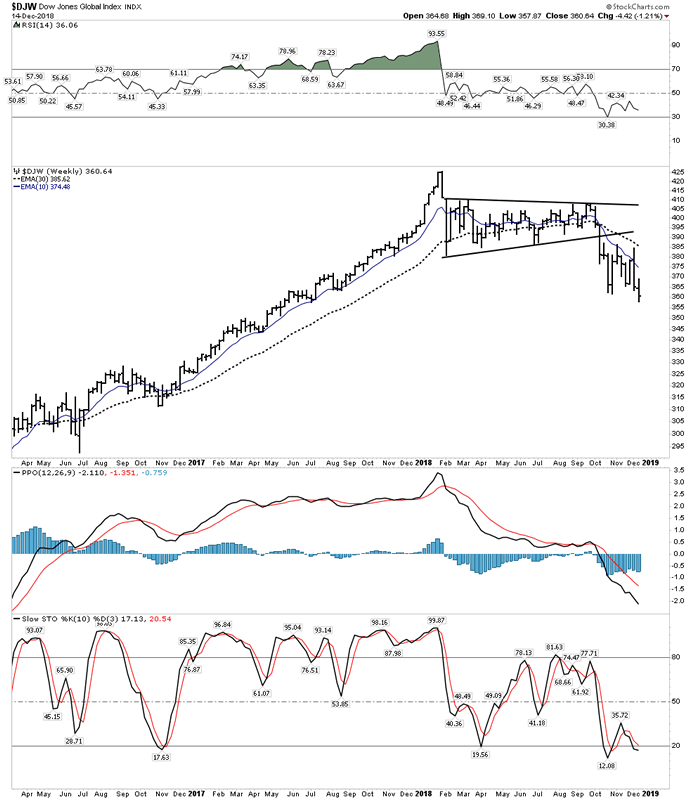
Until recently the USA acted as the world’s safe haven due to post bubble contraction money flows being channeled into the US. But the over all aggregate asset size of world markets peaked back in January. This can be seen below in the DJ Global index which wraps up all of the markets, including the USA, into one index. After the hit to the markets in Jan/Feb the strength of the USA contributed to the index allowing it to undergo an 8-month sideways consolidation. In early October the USA joined in on the downside causing the consolidation to resolve itself, breaking to new lows. The chart shows the entire world is now locked into a bear market.
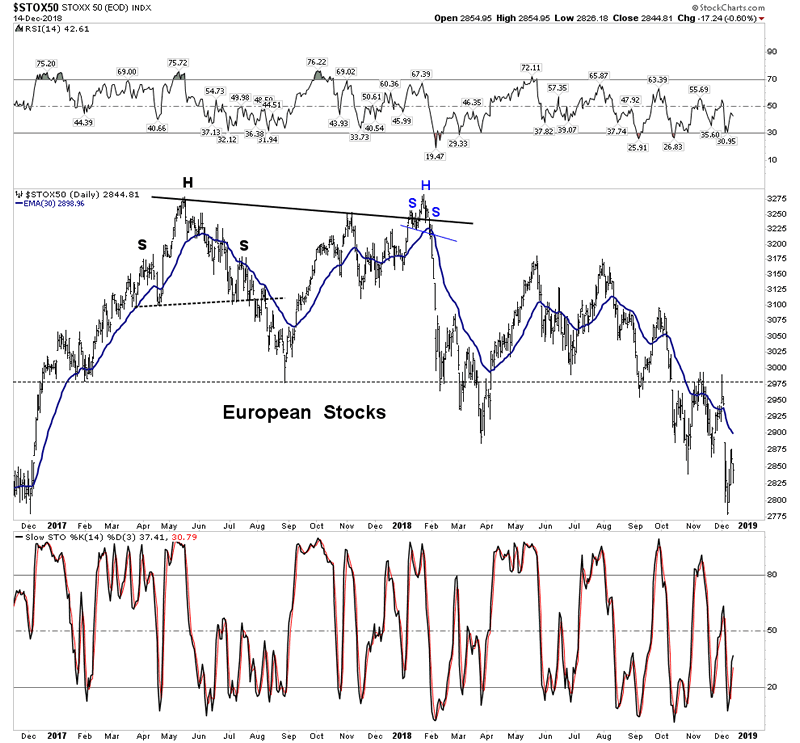
Europe – The senior mature European markets double topped in early 2018 then bled out for the rest of the year.
Dow Industrials & Transportation averages.
Phase III of the bull market kicked off with the election of Donald Trump and lasted just under 2 years. This is an unusually long timeframe for a phase III to run. Phase III is when the public finally embraces the bull market and throws concern for risk aside. The public becomes excited as they are lured by the bait of advancing prices and buy stocks without regard to values, basing their action on nothing more than hopes and expectations. This final phase is when people buy stocks simply because they go up and because other people are buying them. Green investors become boardroom oracles.
Ten Year Bull Market- March 2009- October 2018

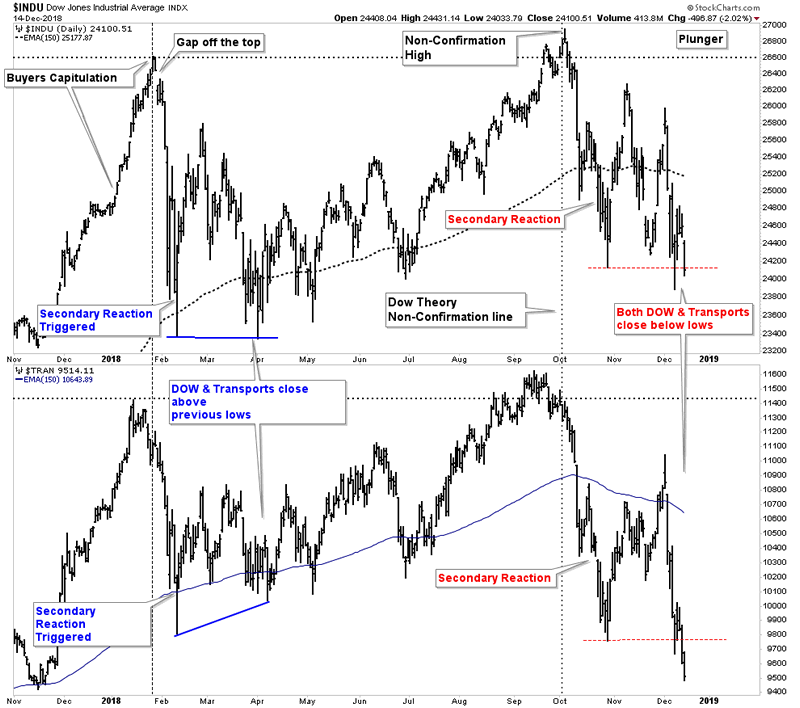
In the next chart below we follow the process which ultimately triggered a bear market signal. From late December into January was a time of buyer capitulation and marked the final blow-off portion of Phase III. This two month period had all the earmarks of a Phase III climax in a bull market. Concern for risk was totally shed by the retail investor, virtually everyday the market marched higher. The DOW blew out to the upside registering a daily RSI reading higher than anytime in the DOW’s 120 year history. Once everyone was in, Mr. market wiped out the most egregious area of speculation… the VIX traders. He took no prisoners as he wiped them out in one fell swoop in overnight trading. The market then entered into a secondary reaction, correcting the final two month advance.
Secondary Reaction (SR)- A significant market move against the primary trend, typically lasting 3 weeks to 3 months in duration. They arrive when least expected and when the consensus is that lower prices are out of the question. The purpose it serves is to correct the previous primary swing and its excesses. They dampen the enthusiasm of the amateur speculators and remind the chronic bulls the market can go both ways.
Secondary reactions following phase III can eventually progress into a bear market after undergoing a market vetting process. This early 2018 SR however did not progress to trigger a bear since it was unable to fall below the prior SR lows.
Here is how a true bear market signal develops:
First a full secondary reaction completes itself then embarks on a multi-week rally, which corrects the SR. At the completion of the rally if one or both of the averages fails to break the old high and then they turn down with BOTH averages breaking the SR lows, on a closing basis, a bear market signal would have been given.
We can see how both averages failed to break the SR lows when they bottomed in April 2018. Therefore a bear market was not triggered and instead a 6-month rally to new highs ensued. It is critical to identify phase III correctly because it is only after a Phase III that a bear market signal is valid. If the process described above occurs in Phase II it does not signify a bear market, it is instead likely a mid-point slowdown in the primary trend.
The Bull Market Top of 2018
On October 3, 2018 the Dow reached its zenith of the great 10 year bull market. Back on September 14th the Transports had earlier put in its top. Therefore, when the Dow peaked on October 3rd the transports were unable to confirm this top, This was the first clue of trouble as the DOW top was not confirmed by the Transports. The averages then entered a secondary reaction with both averages bottoming on 29 October, 4 weeks later. The averages then corrected the SR with a 4 week upward correction peaking on December 3rd. This rally then failed and as of Friday December 14th violated the previous SR lows, on a closing basis, thus signaling a bear market. Both averages confirmed each other within a 2 day period making this a valid trigger signal. This signal is valid since it follows a clear bull market Phase III event.
Editors Note: If the title, “A Turn In The Tide” sounds vaguely familiar to you it is because it has historic significance. It is the name of the title that William P. Hamilton gave to his “Heard on the Street” column in the WSJ on October 25, 1929. He correctly identified the beginning of the bear market of 1929 and published the article 2 days after the bear market signal was given. Immediately what followed was the deluge referred to as the “crash of 1929”, ultimately leading to a decline in the DJIA of 89%. The analysis above uses the same method as was used by Hamilton.
Bull Market Post Mortem
The bull market over the past 10 years has sent stock and bond values to unprecedented historic values. It has trained investors to “buy the dip” and has advanced a narrative that the “Fed has got your back”. Over time a psychology has developed which has led investors to discard fear and embrace risk. In fact, record low interest rates have forced savers to “yield seek” into low grade securities of a quality few would have considered buying in the past.
All of these actions will be the fuel for the coming bear market which has now been triggered. These assets will be revealed for the garbage they are and will be purged at vastly lower prices. An entire generation has never even witnessed a bull market top. A top is an area of distribution by the informed and accumulation of those assets by the public. When experienced investors believe that stocks have advanced beyond all reasonable value or they sense danger on the economic horizon, they will protect themselves by trading stocks for cash. The best atmosphere for such distribution is an optimistic one where the public will pay a premium. Sage investors know that stocks are never cheap when the public turns bullish. These seasoned investors know they may have to wait years before value presents itself again.
Distribution by the pros often takes place up to a year before the highs where the public has gotten excited by the market activity. This is counter to the conditions at the low where the public never plays a major role near the bottom of a bear market.
Sir Issac Newton taught for ever action there is an equal and opposite reaction. This principle applied to the stock market hints that the upcoming bear market will be proportionate to the excesses of the previous bull market. Therefore it’s time for everyone to get out of the water as the length and duration of the now reversed primary trend could prove to be no less than epic.
Bear Market Phase I
We can now date the beginning of the bear market as October 3, 2018. The first phase will be relatively short lived and is the process where stocks will now reflect the abandonment of the hopes and expectations upon which stocks were purchased at inflated prices in the previous bull market. Phase I chiefly corrects the rank speculation of the final top of a bull market. The discounting of deteriorating business conditions of the economy does not occur until the market enters into Phase II. We have not yet arrived at Phase II as Mr Bear still has not gotten the attention of the average investor and the one thing we do know is Mr. Bear likes to be respected.
Immediate Market Implications
It is my view that we are one third to one half of the way into Phase I. The market acts as though it is about to break out into open field bear market operations and to express itself using shock troop tactics. It has now spent two and a half months of back and forth action triggering a bear market signal and now it’s ready to break out to the down side. We at Chartology focus a lot on lines of support & resistance and internal indicators, however price action often gives us insights and clues as well. Let’s look at the action in the NASDAQ Composite over the past 10 trading sessions. It appears to be exhibiting profound weakness telegraphing it cannot hold onto gains and needs to seek a lower level.
In the chart below note how the rally got capped at the 150 EMA. with a bearish black filled hanging man candle. Black is bad as it means price closed below the open, after being higher than the prior day’s close. So a black candle tells us it can’t hold price anymore and this was proven the next day. Look now at the extraordinary bearish outside reversal day to the downside candle where price opened in the body of the previous day, then exceeded the previous day’s high and closed below the previous days lowest low. The rally over the next 3 days was not able to exceed the bearish reversal day candle and it included two black candles (lower close than open). Note the second black candle was a bearish topping shooting star. The week ended on a low with a gapping down red candle. Taken as a whole, this entire sequence is screaming that it cannot hold its current level and needs to resolve itself to the downside.
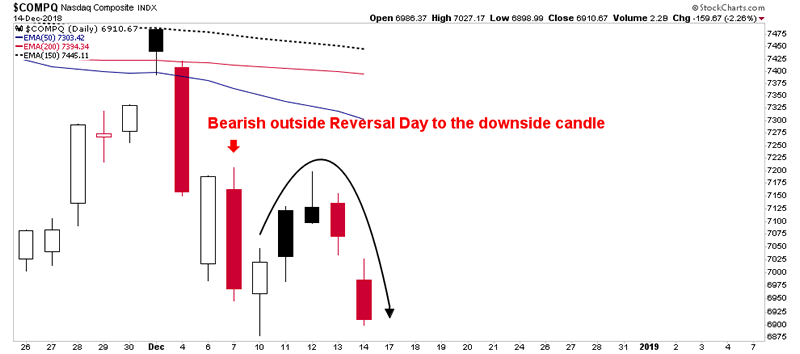
If you were in the market this week you had to notice each day opened with a huge opening gap up only to give it all back by the end off the day. What this says is the amateurs are still getting all excited for the opening bell and the seasoned players are using the rally to unload and sell into. Buyers are becoming exhausted and it appears the floodgates are getting ready to open.
Every Bear Market Has a Hook- The FED Meeting
Bear markets need a hook to keep players in the market. If they all got out the bear would then be over and Mr. Bear could not fulfill his target price objective. It is not hard to see what the hook in this market is… it’s the “FED will save us” hook which will ultimately wipe out a generation of investors. Therefore, I don’t see this market falling apart until sometime after the FED meeting. I suspect the action goes something like this:
FED declares victory in saving the economy, raises rates and claims they will go back to being “data dependent” as far as future rate hikes. The market oscillates wildly, loves it for a while then here comes those old seasoned players who use the rally to unload into. At this point the flood gates can open and the retail public finally gets its initial object lesson of what a bear market feels like.
The hook that the FED will save us is inherently flawed however, because in a primary bear market the actuating forces are above and beyond manipulation. This is because the market is bigger than the FED itself. Great market movements are beyond the manipulation of all the combined financial interests in the world.
Point of Recognition (POR)
But this is not the fabled POR because as a rule the retail public continues buying one third of the way into a bear market. Around that 1/3 point the POR gets discovered. So after an initial hard decline (possible crash) a late phase I rally typically occurs sparking false hope that the worst is over and many will come crawling back into the market. This will be manned of latent dip buyers still seeking bargains. The rally eventually fails and the rollover leads to the discovery of the point of recognition. POR’s can be triggered by anything, a news item, a market manipulation or about anything else as they are triggered by a spark when the conditions are ripe. The POR comes at a time where the public has been worn down. They have now lost the desire to buy the dip again as the pain has now gotten too great from previous episodes. Instead, they are beginning to entertain thoughts of quitting the investment game and moving to safety. They are ready to go “risk off” then comes the spark.
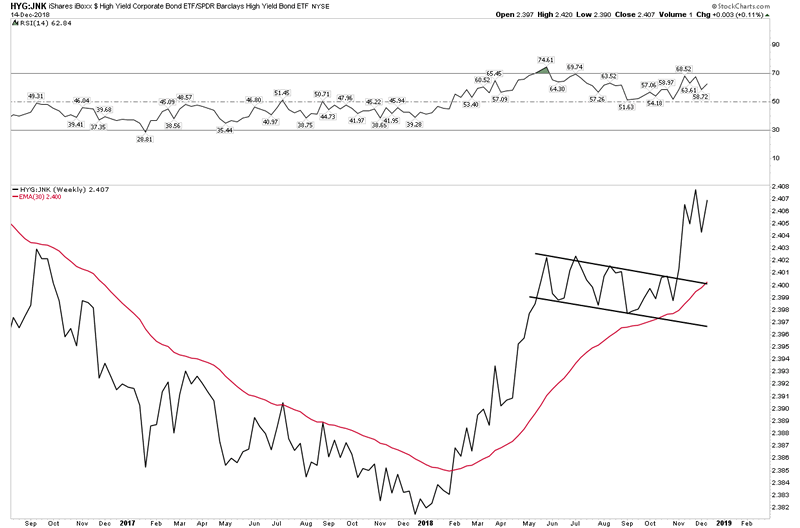
Credit Stress increasing & the derisking process
Below is an update on the flight from lower credit quality to higher credit quality, it has resumed its advance. This shows there is an increased revulsion towards riskier products and is another sign of the arrival of the bear market.
Downward Momentum begins to increase
The below moving average composite chart serves as a representation of momentum. Note how the two major rallies (blue) since the October peak were not able to muster up the momentum to penetrate the longer term moving averages (red). This shows waning momentum. Also we see an increase in volume as participants begin to flee their holdings. In the lower window we see the PPO turning negative
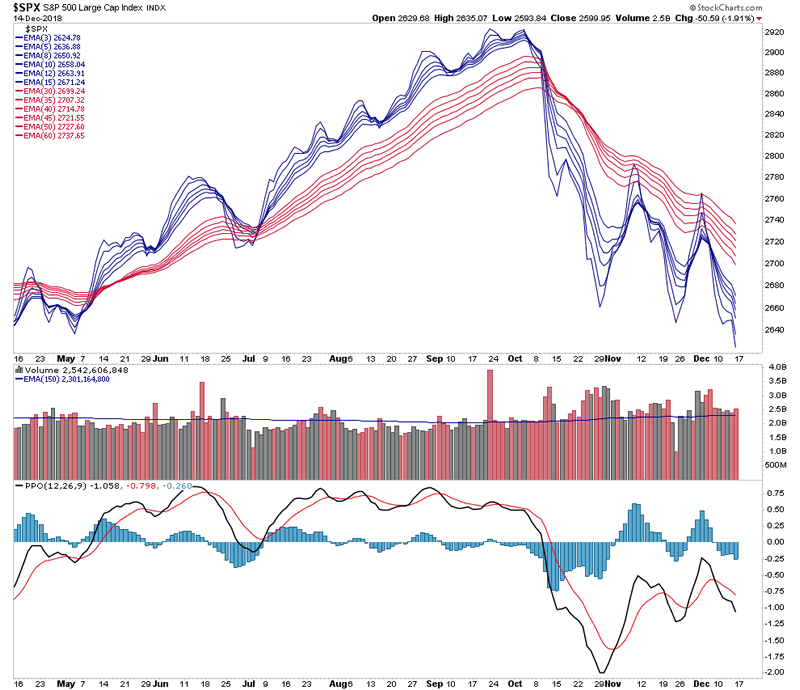
All of the above points towards the likely outcome of a bout of urgent selling on the immediate horizon. This event could occur as soon as this coming week or be forestalled until early next year. It should be recognized as the visible manifestation of the second half of Phase I of the bear market. Agile traders should be able to use the event to coin money working the short side, whereas the majority of investors should seek safety immediately and not hold out for higher prices in an attempt to “get back to even”.
Market Strategy
As mentioned, seasoned investors should not have actually waited for a bear market signal to exit the market. They should already be out of the water and trying to identify the existence of any counter bull markets. If one is a trader he can focus his efforts in identifying short sale opportunities. This week Johnson and Johnson provided a good object lesson of why one should be out of the the market and individual stocks. JNJ is a blue chip stock that is actually regarded as a defensive issue, a stock Wall Street would advise holding in a bear market. Never-the-less in a bear market a negative news item can lead to the stock being taken out and shot:
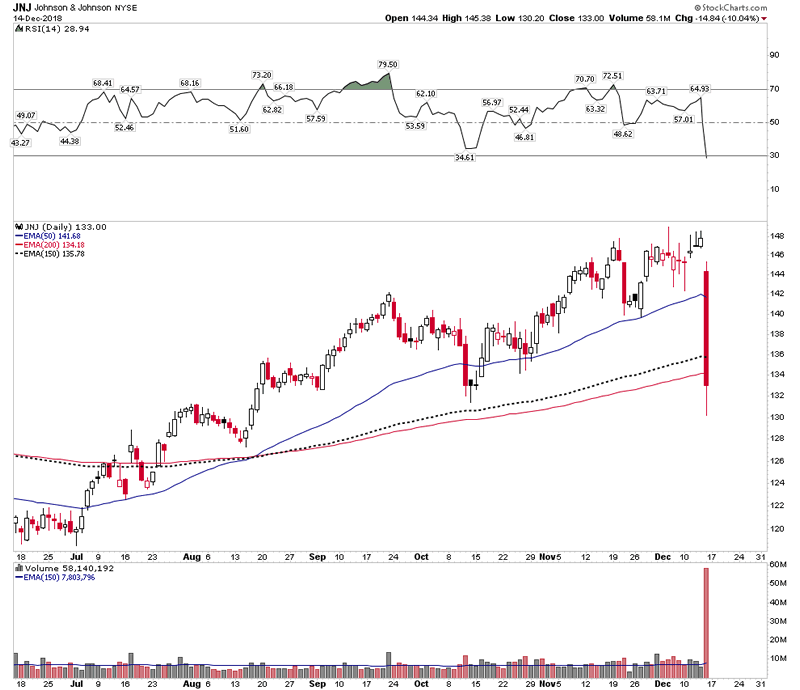
Above we see what a little asbestos in baby powder can do to a stock- amazing. Keep in mind this is a big cap stock sporting a now reduced $356 B market cap. This is bear market action – Ouch!
The Rise of Gold and the next Bull Market
Gold is a counter cyclical asset. When risk comes out of the market, capital seeks safety. It’s why we get gold bull markets when we have general bear markets. This is not a new phenomenon, in fact it’s as old as the hills. Writing in 1922, William P. Hamilton noted the action of the South African gold stocks traded on the London stock exchange since the first Transvaal gold rush in 1889: “The stocks of gold mining firms tend to flourish when other industries are stagnant or even prostrated.” He goes on to further describe the counter cyclical nature of gold and the gold mining stocks.
One month ago I titled the weekend report “Did we just witness the bottom of the gold market?”. In this report I suggested that we indeed did see the gold mining stocks bottom in late September. Now one month later this increasingly appears to be the reality. Amongst universal pessimism, principally espoused by expert opinion, the gold stocks have likely carved out a bottom after a 2-year decline. It has been a laborious bottom which continues to be tested, but a bottom nevertheless and we continue to see positive action in the gold mining stocks.
Let’s look at some elements in Plunger’s Gold Bottoming System. In composite the indicators have turned up which is the first step, yet it won’t confirm a bull market until we can break out above trend channels and moving averages then correct back for a successful back test and resume the advance. At that point we will know for sure, but being the pathfinders that we are we can now take positions ahead of the full turn upward.
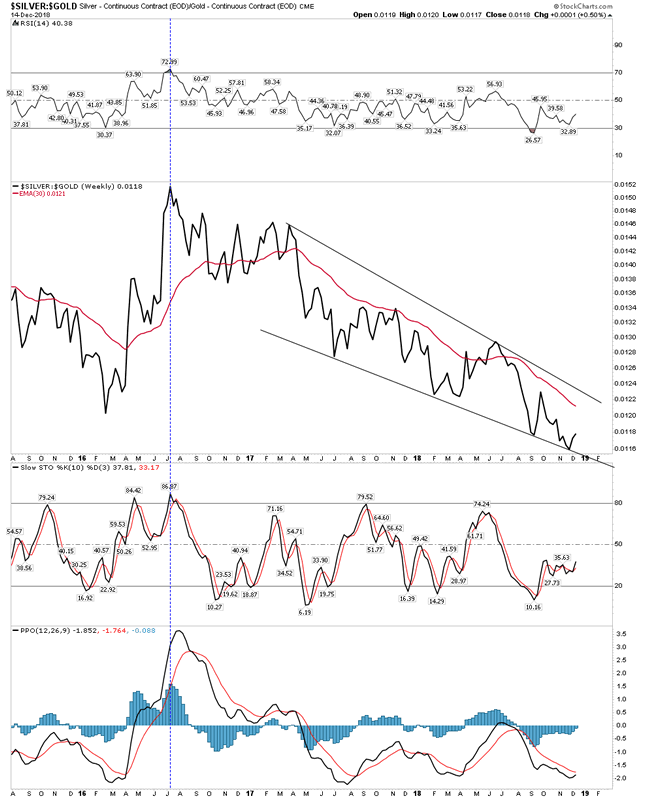
I have added a dashed vertical line designating a turn up in the SGR indicator. This signals a bottom has occurred.
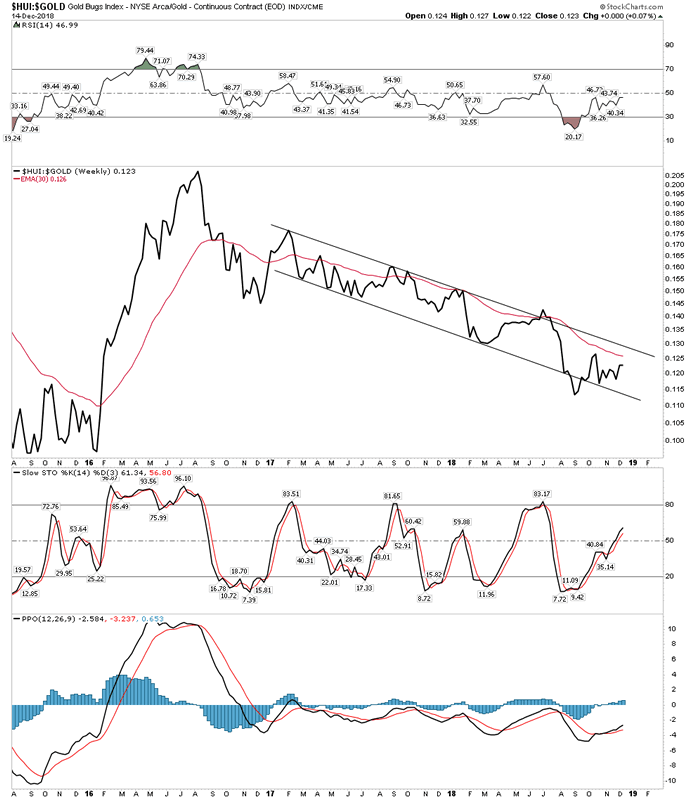
HUI:Gold
This is my most important indicator and it has turned up. To indicate a confirmation of a bull market we still need to have it above the 30 W EMA and break above the channel. These steps will need some time to unfold, but we are now headed in the right direction as Stochastics and PPO are now in an upward configuration. Patience knights.
SGR– Another representation of the SGR shows it has halted the downtrend. This is a lagging indicator used mostly to confirm a trend.
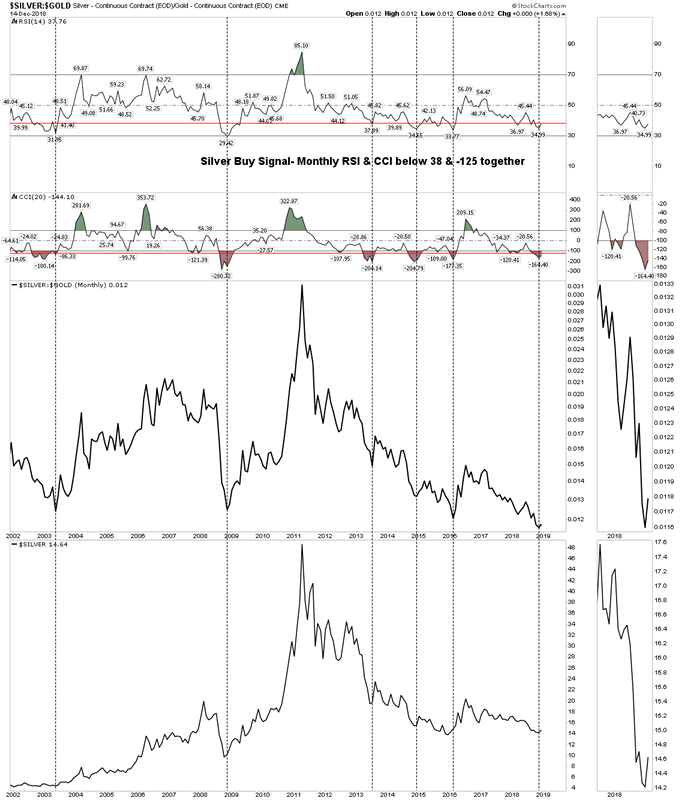
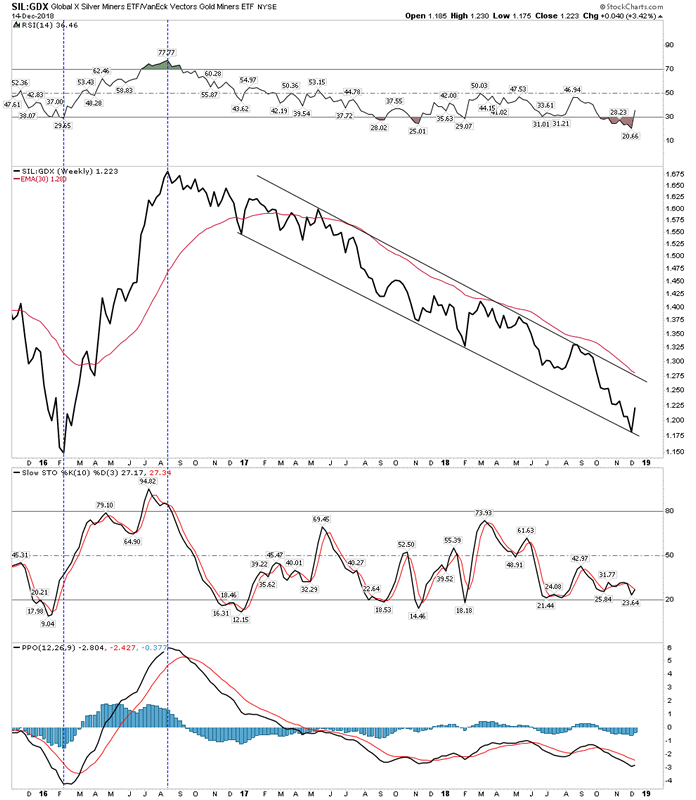
Silver vs Gold stocks
Again another lagging indicator, but it is important to see the decline stopped where it needed to stop. Indication:encouraging
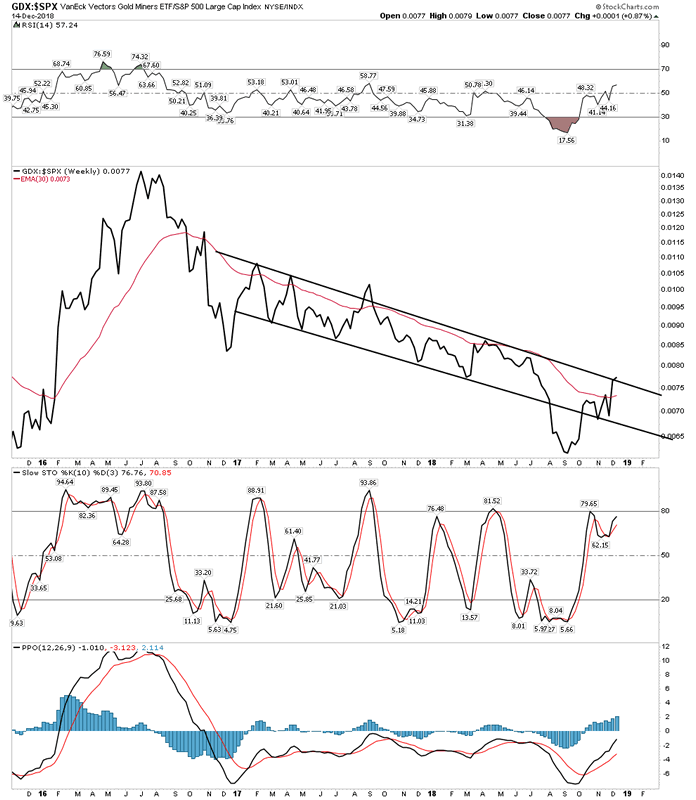
Gold Stocks vs S&P 500
Looking good here, gold stocks out performing the general stock market.
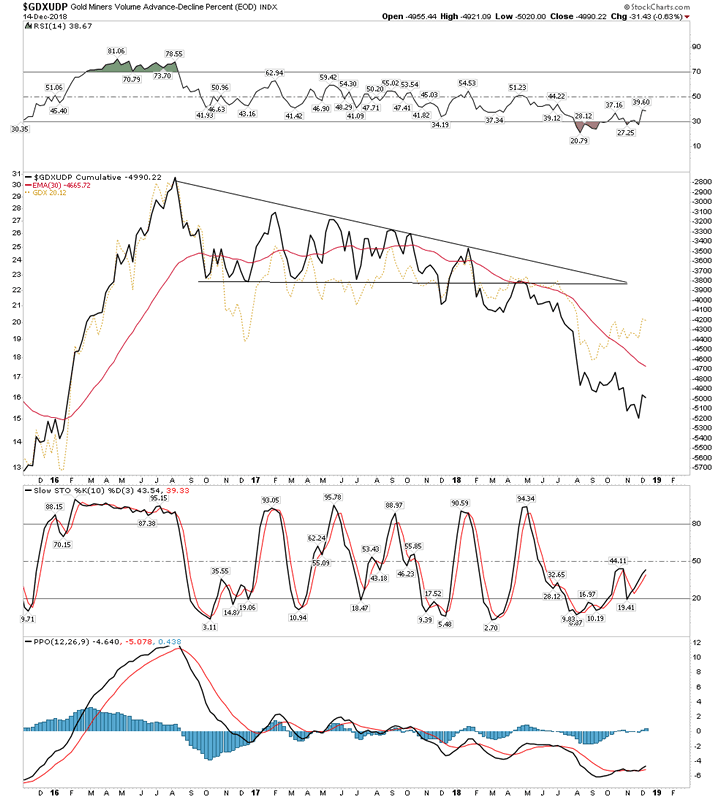
Gold Stocks Adv/Decline
Finally turning up. The adv/decline lagging shows that the advance has in fact been laborious.
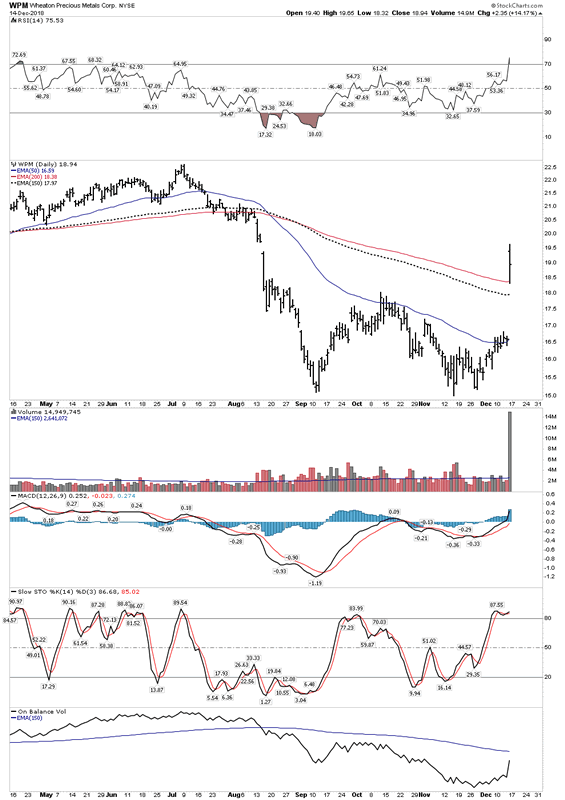
Money Grubbing Politicians- Strike Two
Wheaton Precious Metals- received good news this week in the form of bull market action. They reached an out of court settlement with the Canadian Tax Authority. Bottom line the money grubbing politicians admitted they have no rights to money made on foreign assets held outside of the country. Gee, go figure. The previous whiff at the ball was in losing its court case against Cameco. So now the overhang has been removed from Wheaton and it is now – game on!
Initial Bear Market Casualties :
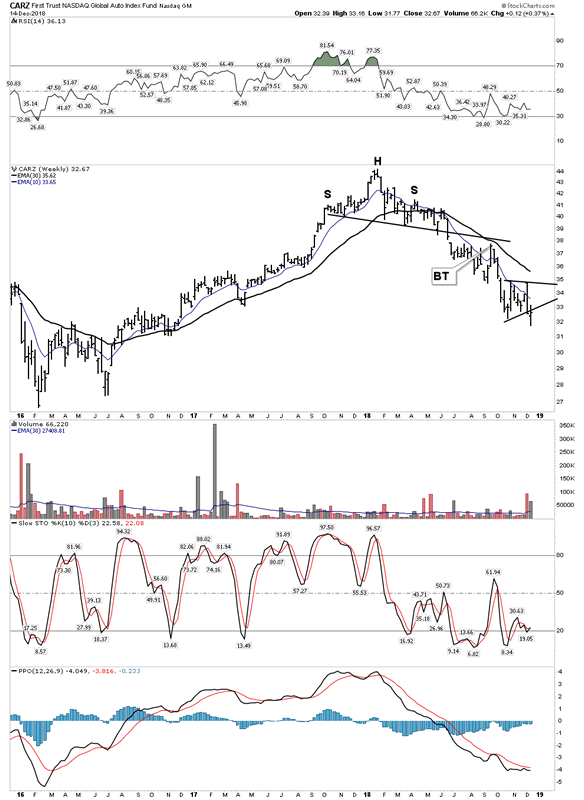
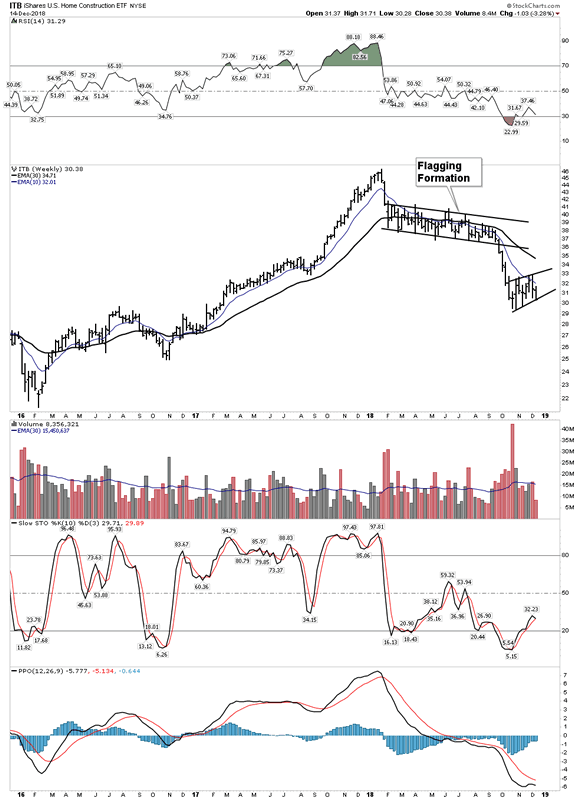
Interest rate sensitive sectors such as the home builders and autos have been the first to lead the bear market down. They now both look like they are about to move down into the next level lower:
Autos show no signs of a bottom.
Below the home builders look to resume the downside after building out a bear flag.
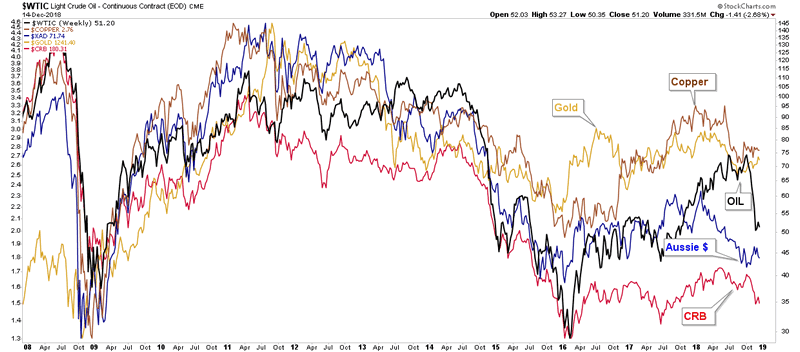
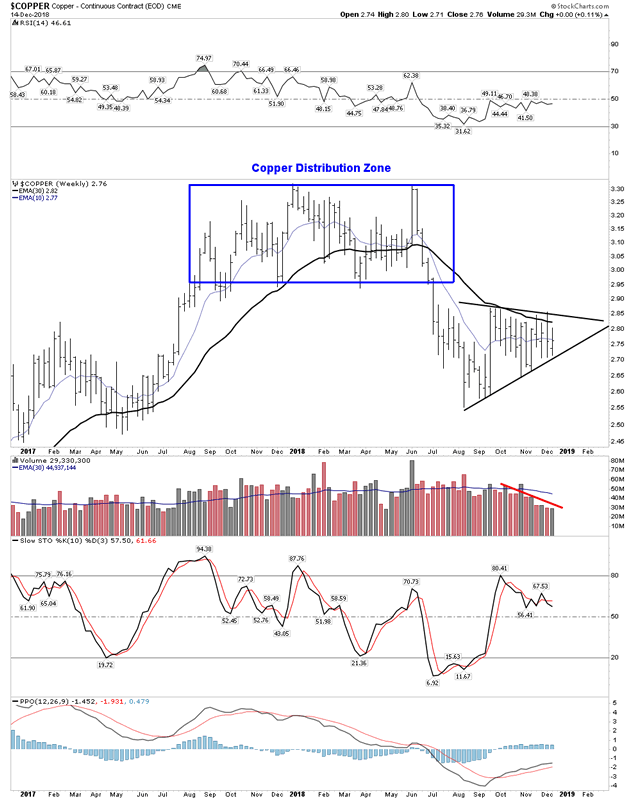
Commodities indicating weakness in demand on the horizon:
Copper showing a massive distribution top:
Oil Entering the Third Cyclical Bear Market within a Secular Bear Market.
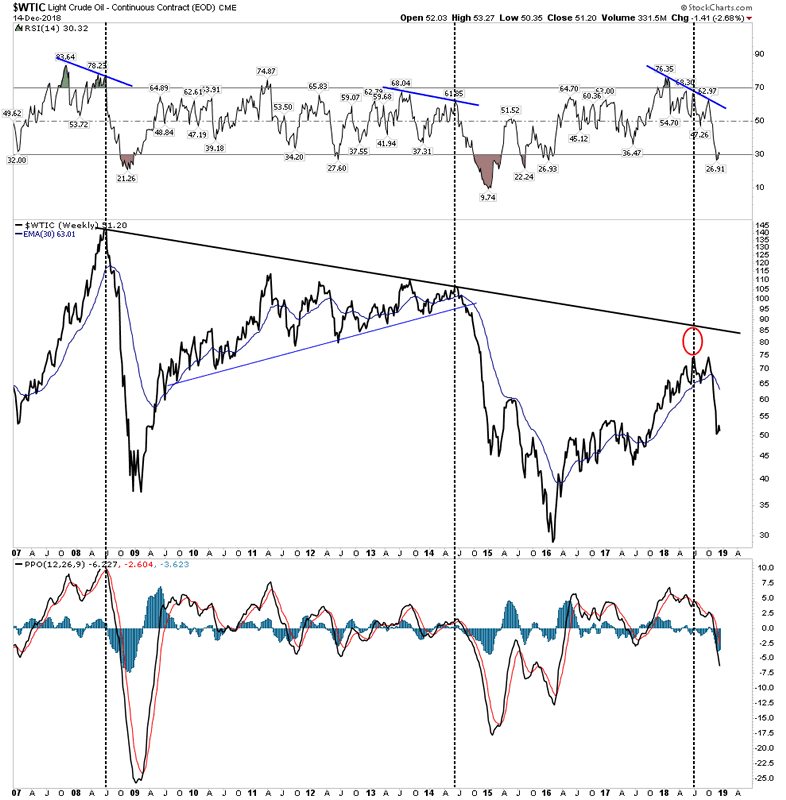
Above we can see how oil is now in its third cyclical bear market within the context of a secular bear market. This is likely the final decline in a 10-year plus massive bear market. It may take years to complete, however when it does it should set the stage for an epic long term bull market. That future bull market will offer huge opportunities in the deep water drillers and traditional oil service stocks which are currently highly out of favor. When the time comes we will want to stalk the bottom of this bull as we have been doing with the bottom of the gold bull market of today.
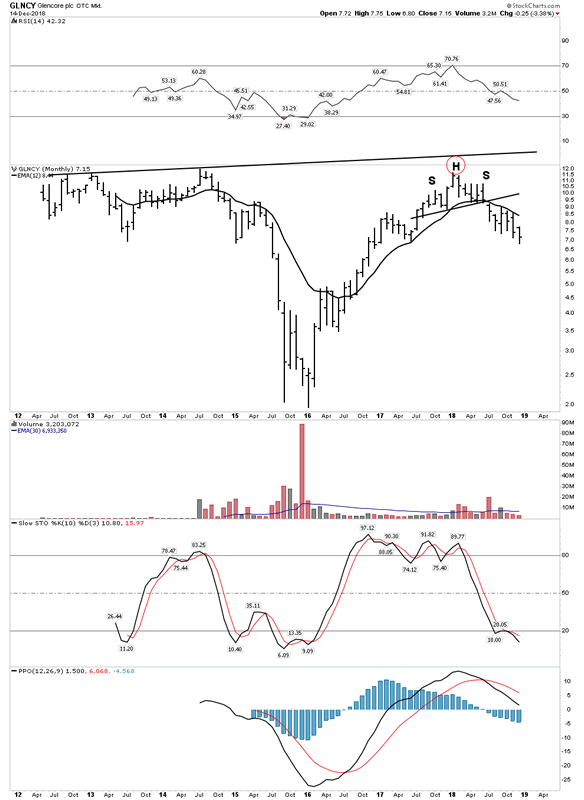
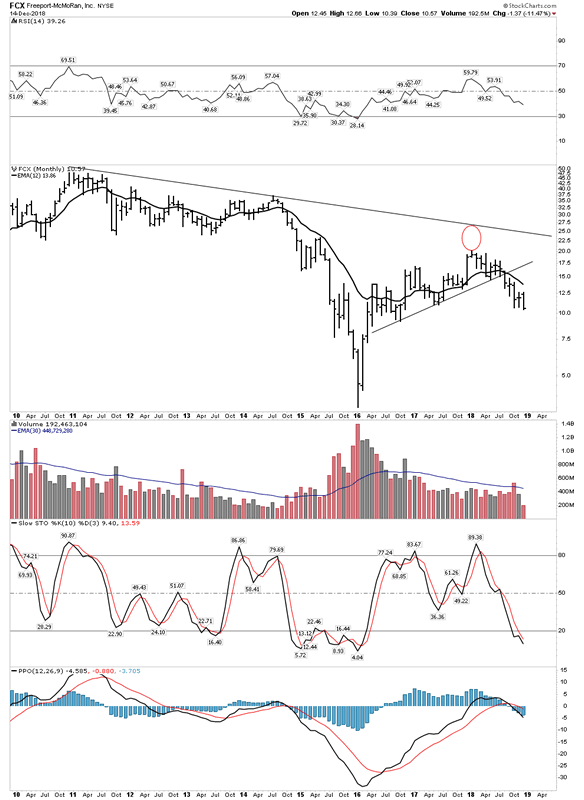
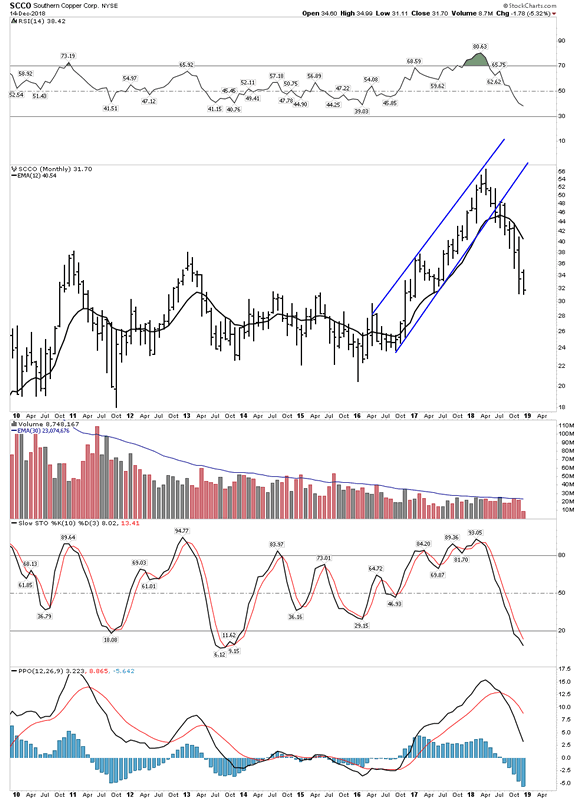
Up Coming Casualties of the Bear Market- Base Metal Extractors :
These companies can make you rich if you can buy them near a cycle bottom. However the other side of the coin is they can crush you if don’t understand market cycles and end up riding them down. Recently, I sat through a presentation at the Stansberry conference given by their commodity guru. He laid out the case that we were in a major bull market in commodities, and are just undergoing a pull back from trend. I sat there in the audience feeling his pain, knowing he was in the midst of destroying himself and his subscribers. Apparently he has no understanding of what a post bubble contraction is… but he is the expert right?
Glencore– The quality company… avoid
Freeport-Industry leader- avoid
Southern Copper- Already in a deep downturn
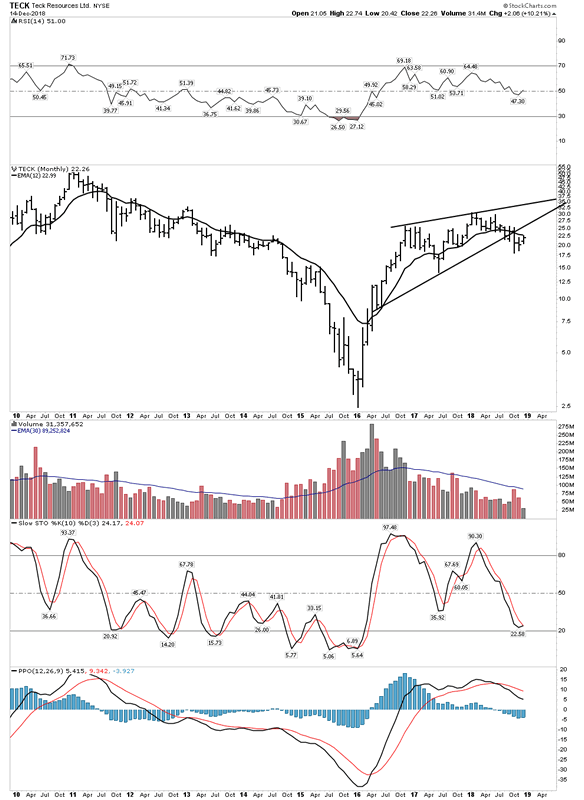
Teck– Canadian Giant- Don’t be fooled- avoid
Potential Trades and a Warning
To summarise , in my opinion, one should be out of the general stock market and now accumulating a precious metals stock portfolio. In addition, one should be holding select uranium shares. For traders the opportunities are on the short side and to catch the long side on a crude oil rally.
Crude oil has a seasonal component to bottom in December/January. I will be looking for a washout low soon and to buy that low. The bounce that unfolds should last for a few months.
Short selling stocks is now the game traders should be focused on. Sell completed rallies and cover after extended declines.
The Warning: If the market sells hard at some point after the FED meeting the gold stocks could fall in sympathy. Be prepared for this by maintaining a proper position size and having some cash on the sideline to buy gold shares on that potential dip.
This could be a generational changing bear market with implications beyond what any of us can even fathom. It will likely lead to a changing of the guard. Be safe then try to be prosperous.
Have a Happy Bear Market!
Plunger
Plunger is Rambus Chartology’s Resident Market Historian and an associate writer. For a complete compilation of his work members can check the “Plunger” Tab .
Copyright © 2018 Plunger - All Rights Reserved
All ideas, opinions, and/or forecasts, expressed or implied herein, are for informational purposes only and should not be construed as a recommendation to invest, trade, and/or speculate in the markets. Any investments, trades, and/or speculations made in light of the ideas, opinions, and/or forecasts, expressed or implied herein, are committed at your own risk, financial or otherwise. The information on this site has been prepared without regard to any particular investor’s investment objectives, financial situation, and needs. Accordingly, investors should not act on any information on this site without obtaining specific advice from their financial advisor. Past performance is no guarantee of future results
© 2005-2022 http://www.MarketOracle.co.uk - The Market Oracle is a FREE Daily Financial Markets Analysis & Forecasting online publication.