


Stock Market Intermediate Sell Signal
Stock-Markets / Stock Markets 2019 Aug 05, 2019 - 03:00 AM GMTBy: Andre_Gratian

 Current Position of the Market
SPX: Long-term trend – Finallong-term phase on the way? How much longer, is the question.
Intermediate trend – We have started a correction of intermediate nature.
Analysis of the short-term trend is done on a daily basis with the help of hourly charts. It is an important adjunct to the analysis of daily and weekly charts which discusses the course of longer market trends.
Daily market analysis of the short-term trend is reserved for subscribers. If you would like to sign up for a FREE 4-week trial period of daily comments, please let me know at ajg@cybertrails.com
Intermediate Sell Signal
Market Overview
“It ain’t over till it’s over!” IT’S OVER!
My view was that for the last couple of weeks, the market was just hanging around waiting for a catalyst to put an end to its suffering! Last week we got two! The first was when the Federal Reserve cut interest rates by a quarter-point at Wednesday’s FOMC meeting. This triggered an immediate sell-off, with the SPX declining from 3017 to 2958 before an oversold rally took hold. The next day showed that the market had only been wounded, as the index recovered all the way back to 3018. Then came the coup de grace administered by a Trump tweet that new tariffs were being imposed on China. It was all downhill after that, with the index losing nearly 100 points from the previous Friday’s close.
“One reason why I believe that there could be a good sell-off in the index after next week is because the cycle which bottomed on 6/03 is due to make its next low on 8/12! That does not guarantee a sharp sell-off into that date but, considering how things are stacked currently, it’s certainly a possibility; and it’s better to go into that date with a cautious attitude. Especially since there is also an 80-day Hurst cycle due to make its low on 8/26.” Thisis reproduced from last week’s letter to show the benefits that can be derived from following just a few reliable cycles. Now that we have confirmation that these cycles are operative, we can predict the short-term market path with a certain amount of confidence. Unless the first cycle bottomed early (which is not supported by the technical picture), we should extend the downtrend for another day or two, get a relief rally, and then decline even lower into the end of the month. Should this scenario come to pass, it would likely be only the first salvo of a more protracted correction.
Technical Analysis (Charts appearing below are courtesy of QCharts.)
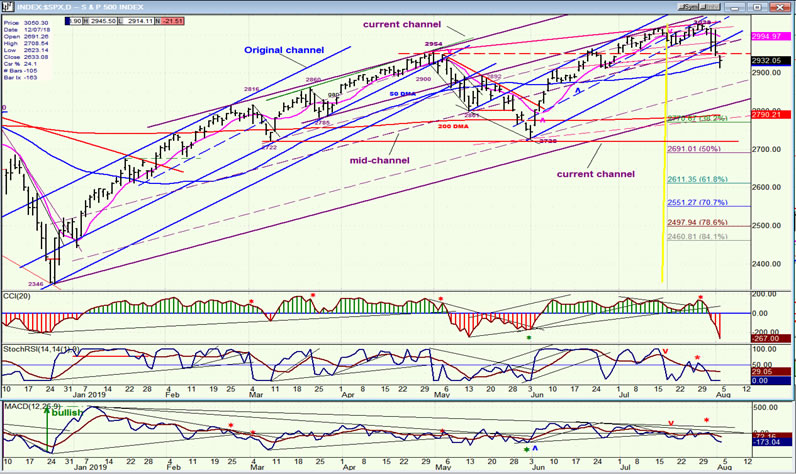
SPX daily chart
From the perspective of an EWT analyst, the current market’s structural position offers two possibilities: 1) we just completed a B-wave of wave IV, or 2) we have only come to the end of Wave III and are starting wave IV. The market will be the final arbiter as to which is the correct one. The first option would limit the correction to one of the higher Fibonacci retracement zones shown on the chart, while the second could take SPX all the way back down to 2346 and perhaps beyond. Either way, this should turn out to be a substantial correction.
The market had been rolling over for some time in an obvious loss of upside momentum. This is usually caused by one or several large cycles in the process of topping. After moving out of the original channel, prices formed a smaller channel within a larger channel This past week’s sell-off took the index outside the smaller blue channel, as well as beyond the mid-channel line of the larger channel. Whether we are tracing out option 1) or 2), it is likely that we will move completely outside of the large channel before the correction comes to an end. As you can see, the last time the oscillators showed this much initial weakness, SPX lost 236 points. Should we get a similar correction, it would cause a .382 price retracement of the uptrend from 2346 which would be the minimum expectation for a C-wave, but would not even come close of satisfying an entire wave IV. The congestion that formed at the current top gives us a P&F chart count matching a 50% retracement of the previous rally; but measuring across the last two tops amounts to enough distribution to retrace almost entirely the rally from 2346. It’s still early in the correction and perhaps later on another pattern will form which will give us a more specific confirming count.

SPX hourly chart
The first selling wave took the index outside the smaller blue channel as well as beyond the mid-channel line of the larger channel, but an intraday rally caused it to close above both. The second wave closed well below the two and kept on going the following day. Ideally, the decline should continue a little longer followed by a rebound and then the next larger cycle should take over and send the index to a new low. That would complete the first phase of the decline but not end the correction because, if I am correct, there is an even larger cycle due to bottom in October.
If we are in fact just now starting wave IV, October would only bring the completion of the A-wave of wave IV of the bull market which started in 2009. We would then have to work our way through wave B and C of wave IV, and this could extend the correction into the middle of next year. Whether or not this is the way the market trend actually unfolds over the next several months, it is a plausible scenario that we can follow, which is better than having no idea about what comes next. As the weeks go by, we can see if it works out, or if we need to consider another path for the market.
Back to the present: if the first cycle low is still ahead of us, about 2880-90 would be a good level where an initial reversal could take hold.
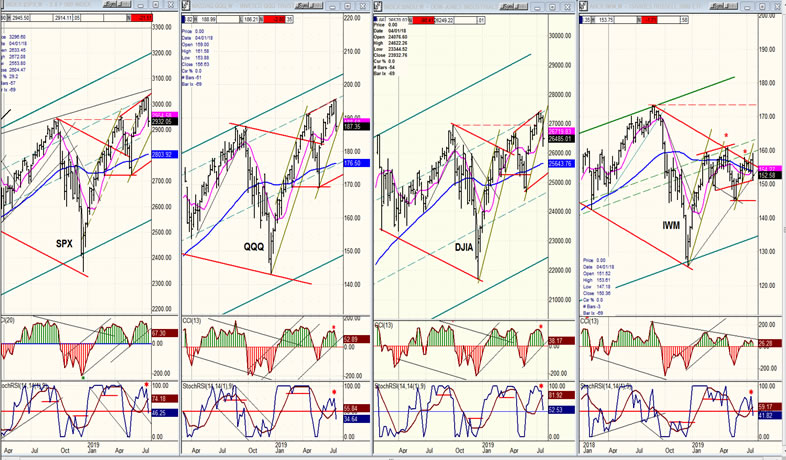
QQQ, SPX, DJIA, IWM (weekly)
All four indices fell last week and closed near the low of their weekly ranges. The worst performer continues to be IWM because of its previous weak technical position which, with last week’s reversal, places it a long way below the top that it made a year ago. Although all indexes show confirmed sell signals at the daily level, it takes more than one week for the weekly indicators to follow the daily ones into the red.
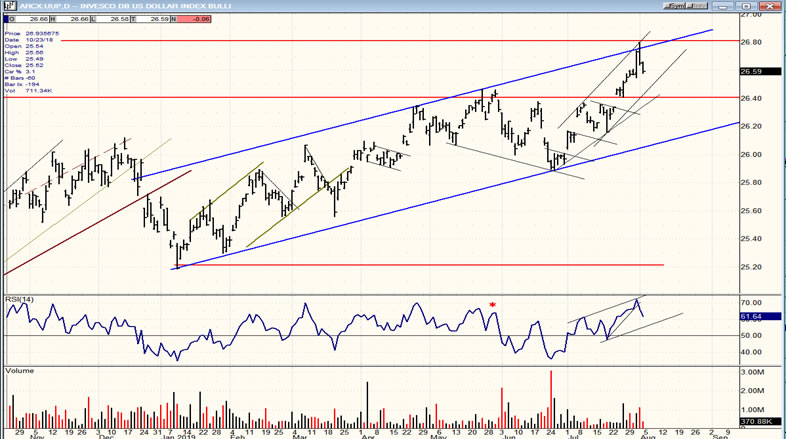
UUP (dollar ETF) daily
I have reduced the UUP chart to basics for a clearer evaluation of the current trend. UUP is still making new highs. As of Friday’s close there are no convincing signs that the top has occurred.
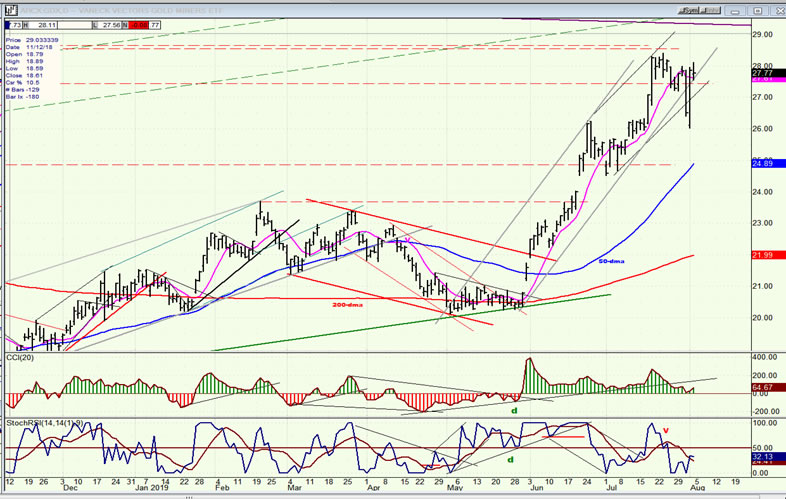
GDX (Gold miners ETF) daily
After reaching its interim 28.00-28.50 target, GDX had a sharp pull-back and an equally sharp recovery. This suggests that additional consolidation, if required, should be shallow. Not sure about its duration until we see more data.
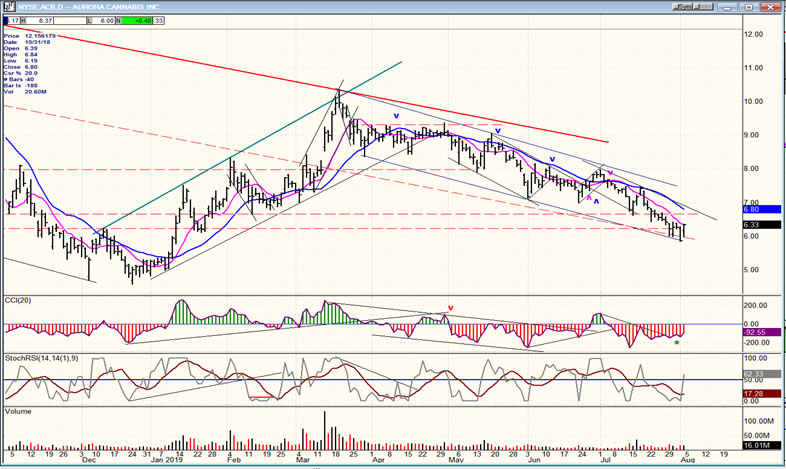
ACB (Aurora Cannabis) daily
ACB hit the bottom of its long corrective channel and bounced. We’ll need more data here also to see if it is in the process of meeting important support and putting an end to its correction, as the indicators are beginning to suggest.
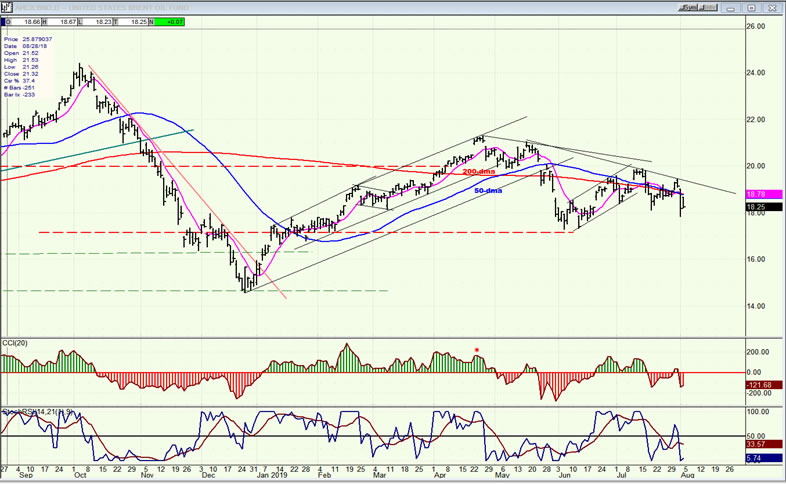
BNO (U.S. Brent oil fund) daily
BNO is also correcting. It is possible that this is only starting and more of it will be seen as the market itself corrects.
Summary
“Next week could be a game changer for SPX. It will bear watching!”
And it was, as SPX kicked off a correction which is expected to be of intermediate nature. This means that we should see much lower prices as a result of a correction which can last at least into October, and perhaps well into next year. More specifics will be made available as the corrective process unfolds.
Andre
FREE TRIAL SUBSCRIPTON
For a FREE 4-week trial, send an email to anvi1962@cableone.net, or go to www.marketurningpoints.com and click on "subscribe". There, you will also find subscription options, payment plans, weekly newsletters, and general information. By clicking on "Free Newsletter" you can get a preview of the latest newsletter which is normally posted on Sunday afternoon (unless it happens to be a 3-day weekend, in which case it could be posted on Monday).
Disclaimer - The above comments about the financial markets are based purely on what I consider to be sound technical analysis principles uncompromised by fundamental considerations. They represent my own opinion and are not meant to be construed as trading or investment advice, but are offered as an analytical point of view which might be of interest to those who follow stock market cycles and technical analysis.
Andre Gratian Archive |
© 2005-2022 http://www.MarketOracle.co.uk - The Market Oracle is a FREE Daily Financial Markets Analysis & Forecasting online publication.