


Surprising Advantages Of Investing In Gold, A 50 Year Historical Analysis
Commodities / Gold & Silver 2019 Sep 24, 2019 - 08:27 AM GMTBy: Dan_Amerman

 One of the most common reasons to buy gold is to use it as a stable store of value. This analysis uses 50 years of history to test that common belief, and finds it woefully lacking - for it misses the best parts of investing in gold.
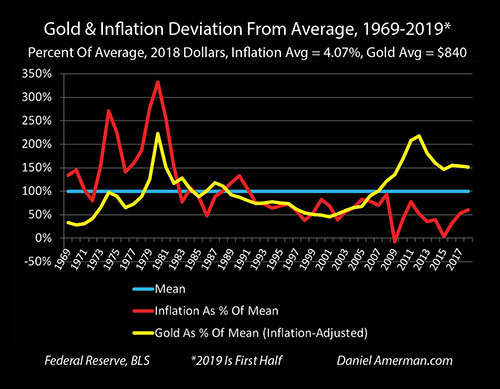
The graph below will be developed, and we will show that gold is instead a more sophisticated (and desirable) investment than most people realize. When properly understood, gold can deliver unique advantages to knowledgeable investors, and it can be put to much better uses than just acting as a mere stable store of value.
As we will explore, the actual history of gold is that it can deliver real (inflation-adjusted) profits that are up to 7X greater than what perfect inflation hedge would deliver. When we look at the times that this wide outperformance occurs, this means that gold can have an integral role in portfolio management in the modern era, and can "punch far above its weight" when compared to such inflation hedge alternatives as TIPS.
This analysis is the 16th chapter in a free book. The earlier chapters are of essential importance for achieving full understanding, and an overview of some key chapters is linked here.
Level One: The Theory Of Gold As Stable Money
The most popular perception of gold is that it acts as a stable store of value, and that it will protect the purchasing power of savings against the ravages of inflation.
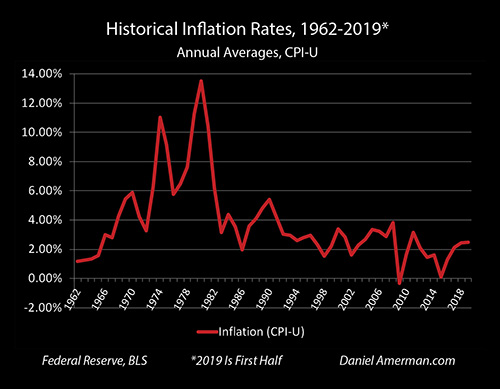
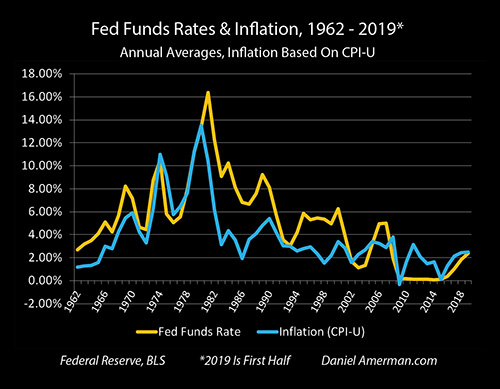
The need for such protection can be seen in the graph of inflation above, which shows average annual rates of inflation in the United States for the years 1962 through the first half of 2019. Any time the red line is above 0%, then the value of the dollar is falling. While the rates of inflation varied widely, on an annual average basis the dollar lost value every single year with the exception of a miniscule increase in value in the year 2009, during and in the aftermath of the Great Recession.
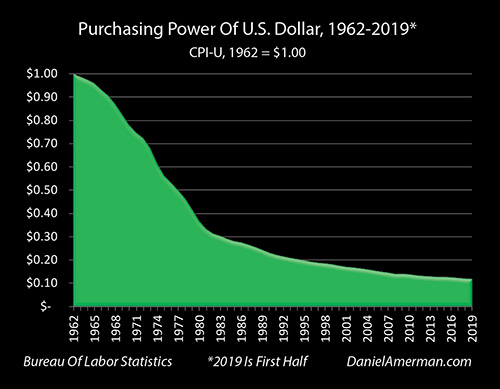
The cumulative impact of this steady destruction of the purchasing power of the dollar can be seen in the graph above. When compared to what it would buy in 1962, the dollar would only buy 50 cents by the year 1977. The purchasing power of the dollar would then drop in half again by the year 1989, and then in half again - down to a value of 12 cents on the dollar - by the year 2017. (If we go back to the 1933 when FDR took the U.S. off of the gold standard for domestic purposes, the paper dollar has lost 95% of its value since that time.)
The actual purchasing power of a vast amount of saver wealth has been steadily destroyed over the decades - and the theory behind owning gold it that it is supposed to keep that from happening. How has that worked in practice?
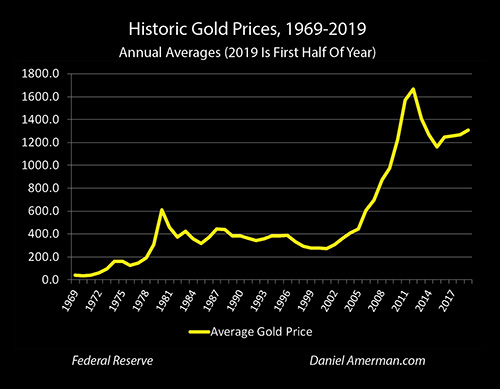
The graph above shows average annual gold prices from 1969 to the first half of 2019 - and gold has done very well indeed over those years. The average price of gold was $41 per ounce (on the London exchange) in the year 1969, and it was up to $1,307 dollars an ounce by the first half of 2019.
So the value of each dollar was way down, the number of dollars that each ounce of gold could buy was way up - did gold effectively protect the purchasing power of savings as it was supposed to?
Testing Gold As An Inflation Hedge
To test whether gold was an effective inflation hedge, we need to look at the value of gold over time in inflation-adjusted terms.
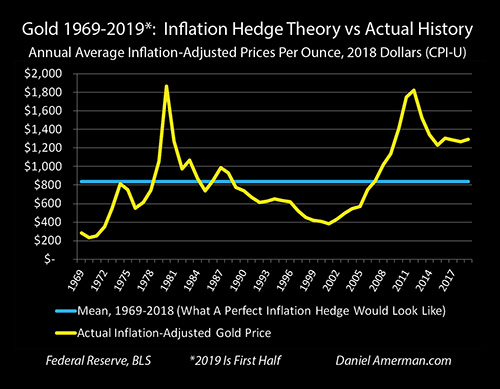
When we adjust the average annual price for an ounce of gold by the purchasing power of the dollar in each year, we get the graph above.
A hedge is something that protects the value of a financial position. A perfect inflation hedge that fully protects saver purchasing power would necessarily be a flat line in inflation-adjusted terms - an ounce of gold would always have the same real purchasing power, regardless of the rate of inflation that is experienced.
An example of such a perfect hedge is the blue line above. The average inflation-adjusted price of an ounce of gold between 1969 and 2018 was $840 an ounce (in 2018 dollars). If gold were acting as a perfect inflation hedge, then exactly maintaining purchasing power would mean sticking to the very stable and boring blue line above, with little or no annual variation.
However, when we look at the yellow line of actual historical gold prices on an inflation-adjusted basis - we get wild fluctuations instead of boring stability. The real purchasing power of gold soars, and then plunges, and then soars, and then plunges.
Let's break it apart, and see if we can get a better idea of what is happening.
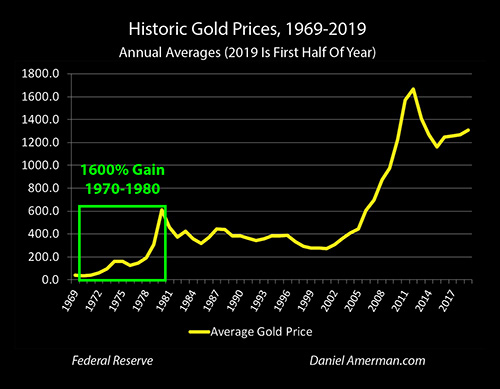
The 1970s were a time of inflation, and on an annual average basis, the price of gold jumped from $36 an ounce in 1970, to $613 an ounce in 1980, which was a gain of about 1600% in ten years.
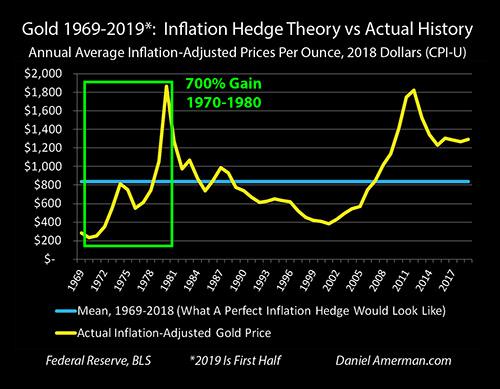
When we adjust the prices for inflation and put them in more current terms (2018 dollars), then the price of gold moved from $232 an ounce in 1970, up to $1,869 an ounce in 1980, which was a gain of about 700% in ten years.
Now, if gold were acting as a perfect inflation hedge or stable store of value, it should have started at an inflation-adjusted value of $232 an ounce, and ended at an inflation-adjusted value of $232 an ounce.
Instead, gold experienced a spectacular 8X increase in value in inflation-adjusted terms, creating the towering spike seen above. For gold investors - this movement was lucrative, and far more profitable than if gold were merely just keeping pace with inflation. (Just to be clear: going from 100% to 800% is an 8X increase but a gain of 700%, just as doubling (2X) the price of an investment produces a 100% gain.)
That said, there is a price that goes along with those extraordinary gains - and that is accepting that the overwhelming majority of the gains did not come from gold acting as a stable store of value, but quite the reverse. This then set the stage for a much more unpleasant era for gold investors.
After the peak annual average price of $613 an ounce in 1980 (not adjusting for inflation), the price of gold would trend downwards for the next 21 years, bottoming out at $271 an ounce in the year 2001.
That was a 56% loss on its own, but there was another problem as well. Inflation had not stopped, indeed some of the peak years for inflation in the modern era occurred during that time, with a 10.4% rate of inflation in 1981, and a 6.2% rate of inflation in 1982. By 2001 - the dollar had lost 53% of its purchasing power, relative to what it would have bought in 1980.
In order to just keep up with inflation, to act as an inflation hedge or stable store of value, gold should have more than doubled in price between 1980 and 2001 - but in practice it dropped in price by more than half.
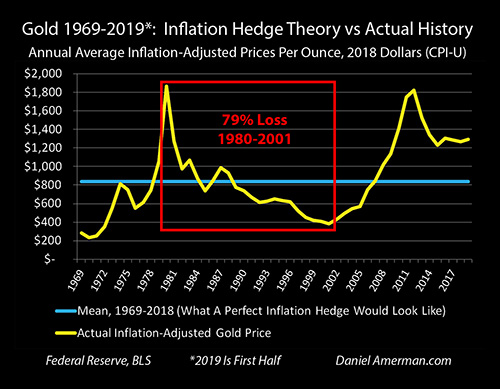
When we combine the much fewer number of dollars that each ounce of gold could buy, with the much lower value of each of those dollars, then we get the graph above. In inflation-adjusted terms (2018 dollars), the value of gold fell from $1,869 an ounce in 1980 down to $384, which was a 79% decrease in purchasing power.
If someone had just held a dollar, their purchasing power would have been down to 44 cents by 2001. However, if they had held gold in order to protect themselves from inflation - then their purchasing power would have been down to 21 cents by 2001. Savers would have been much better off just holding on to their paper dollars.
What actual financial history shows us is that gold completely failed in its job of acting as a stable store of value for a period of a little more than two decades, losing almost 80% of its inflation-adjusted purchasing power.
Now, I'm not saying this to knock gold or to offend anyone. Indeed, the place that I am going is that gold is a far better investment than if it were just a mere stable store of value or perfect inflation hedge. Particularly from an overall portfolio perspective in these days of heavy-handed central banking interventions, including quantitative easing and many negative interest rates around the world - gold is a more sophisticated and powerful financial tool than most people realize.
But to uncover that real value, we need to look with both eyes wide open, and see gold for what it truly is, rather than what many people want it to be. In the real world, gold was awful as an inflation hedge for two decades. That historical fact then in turn set the stage for gold to again spectacularly outperform what a mere stable store of value could do.
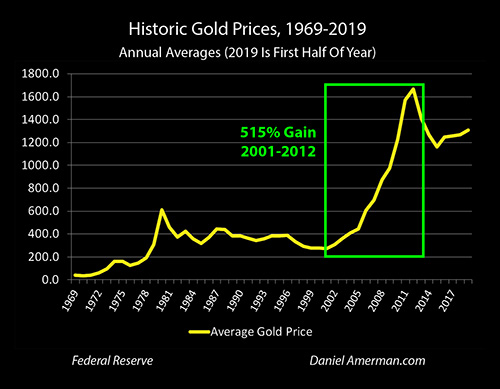
From the bottom point of an annual average price of $271 an ounce in 2001, gold would soar to an average price of $1,669 in the year 2012. This increase in price would produce a 515% gain over a period of 11 years.
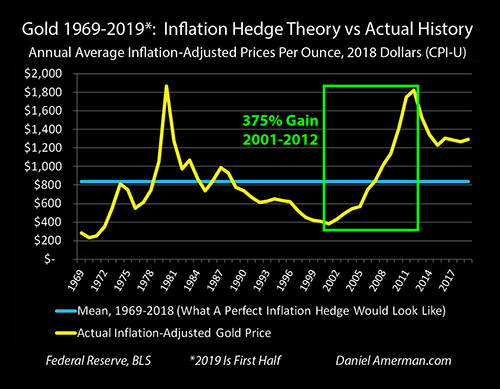
Even when we adjust for inflation - there was still a stunning gain. Gold went from $384 an ounce in 2001 (2018 dollars), to an annual average price of $1,825 an ounce in 2012. This was a gain of 375% over the eleven years, even after fully discounting for the decreased purchasing power of the dollar.
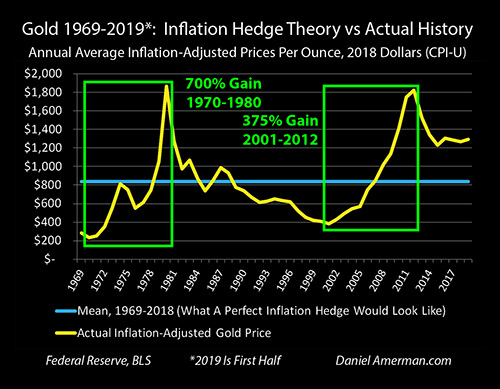
To briefly review, using the graph above which is focused on the positive: 1) gold performed spectacularly during the ten years from 1970 to 1980, with a gain that was 700% better than what can be explained by merely keeping up with inflation; and 2) gold also performed extremely well during the eleven years from 2001 to 2012, with a gain of 375% even after fully taking inflation into account.
Those two add up to 21 years of bull markets. However, the gap between the two spectacular bull markets was dominated by 21 year bear market, where gold failed miserably in its job of being an inflation hedge, losing 79% of its purchasing power.
I think we can safely draw two conclusions from this review so far. The first is that there is something going on that is not just about keeping up with inflation or gold acting as a stable store of value. The second conclusion is that whatever is actually happening - it isn't boring.
In the attempt to find a better explanation - let's raise the sophistication of our analysis by a notch.
Level Two: Gold As An Investment Subject To Supply & Demand
Let's say that gold is not money (at this point in history), but that it is an investment. Of course, once we adopt an investment framework, then we have to take into account that investments change in price depending on supply and demand.
If we look at gold in supply and demand terms, then many other factors come into play. We have supply in terms of the physical production of gold from mines, or from central banking sales from their reserves. We have demand for gold for such things as jewelry or central banks increasing their gold reserves, with either use pulling the gold out of circulation. We also have the demand for gold in other nations changing the price for gold in their currencies, and then we need to consider how the changing value of the dollar intersects with that changing demand for gold in other countries.
For simplification, we will ignore those factors for now, and concentrate on one basic relationship within the United States.
If most people view gold as a way of protecting themselves - or profiting - from inflation, then the higher that inflation goes, the higher the price of gold should go. More people are coming in with their money, trying to buy gold. Because demand is rising sharply at that point - prices should be rising sharply as well, even after discounting for inflation.
In addition, rising markets tend to draw in more money. The increasing demand for gold as an inflation hedge should bring in money from speculators as well, who see the rapidly rising prices and want to participate. This further increases demand, which would further increase prices.
Conversely, if people begin to lose their fears about inflation - then the demand for gold should drop sharply, so there is no longer the upward price pressure. Now the supply of people wanting to exit gold exceeds the demand from new investors who are worried about rising inflation - so prices should be dropping. Falling prices send the speculators heading for the exits, which further increases the excess supply problem, and that should decrease prices even more.
So if gold is an investment where demand increases with rising inflation, and demand falls with decreasing inflation - then we should be able to see that relationship over time.

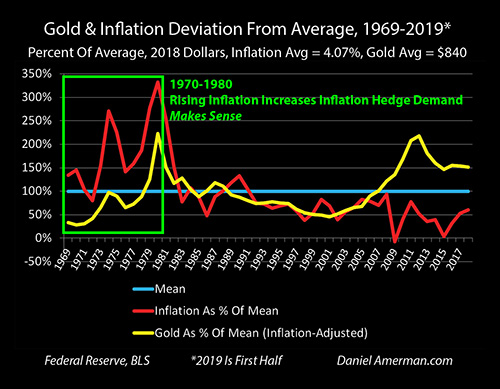
To put both inflation and gold on the same graph, I averaged each for the years 1969 to 2018, and determined that the average annual rate of inflation was 4.07%, while the average inflation-adjusted price of gold was $840 an ounce. These averages are expressed in percentage terms, with the average (mean) being the 100% blue line for both inflation and gold.
When inflation was above average - the red line goes above the blue line. When inflation-adjusted gold prices go above average - then the yellow line goes above the blue line.
Now let's revisit the 1970 to 1980 gold bull market, looking at both the rate of inflation and at what was happening with inflation-adjusted gold prices.
The rate of inflation was below average in 1972, and so were gold prices. Then the rate of inflation shot upwards in 1973 and 1974 - and inflation-adjusted gold prices spiked upwards right along with it, as more investors sought protection from inflation.
Annual rates of inflation fell back quite a bit in 1975 and 1976 - and so too did the inflation-adjusted price for gold as fewer investors sought out inflation protection.
There was then a tremendous spike in the rate of inflation over the next four years, with average annual inflation reaching 13.5% in 1980. As shown on the graph, this was equal to 332% of our long term average rate of inflation of 4.07%.
Demand soared for protection from inflation, sending gold prices upwards at a rate that was far in excess of the high rate of inflation, the surging prices drew in speculators, which then further increased real prices for gold, and gold topped out at an inflation-adjusted price of $1,869 an ounce, which as shown on the graph, was equal to 223% of the long term average price of $840 an ounce.
The relationship is not quite perfect - but the yellow and red lines seem to have a very strong visual correlation, with upward spikes in the rate of inflation producing upwards spikes in inflation-adjusted gold prices (as demand rises), and downward spikes in inflation producing corresponding downward spikes in inflation-adjusted gold prices (as demand falls).
When we look at the changes in gold prices from this viewpoint - then the three phases of the first spike up, the spike down, and then the final soaring spike up, all just plain make sense. There is a great deal of explanatory power.
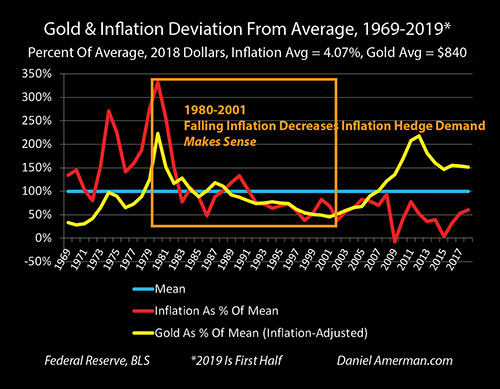
Now, let's take a look at the period from 1980 to 2001, using the same visual tool. On a year by year basis, the relationship is not quite as tight - but from big a picture perspective, it remains remarkably good.
Annual rates of inflation and inflation-adjusted gold prices plunge together from 1980 to 1982, continuing the close relationship that we saw from 1972 through 1980. This is exactly what we should expect - a plunging rate of inflation should create a plunging investor demand for protection from inflation, this should be exacerbated by the flight of speculators from the market, and the end result should be a dramatic plunge in inflation-adjusted gold prices.
For the 1983 through 1990 period, the year by year correspondence is not as good as the remarkable similarity that we saw from 1972 through 1982 - but the range is very similar. Inflation and inflation-adjusted gold prices are each oscillating up and down in a relatively limited range over and above their averages.
Indeed, when we average inflation between 1983 and 1990, it was equal to 95% of its long term average, and inflation-adjusted gold prices in that period were equal to 103% of their long term average. Close to average rates of inflation should produce close to average investor demand for protection from inflation, this should produce close to average inflation-adjusted gold prices - and that is what we got.
During the 1991 to 2001 period, both rates of inflation and inflation-adjusted gold prices were consistently below their long term averages. The visual correlation now returns to being remarkably close - indeed, almost perfect - for the years 1991 to 1999, before inflation separated itself with a distinct red spike upwards in 2000 and 2001.
However, inflation never did reach average, and the spike was fairly small in comparison to previous spikes. When we average the full 1991 to 2001 period, then inflation was equal to 69% of its long term average, and inflation-adjusted gold prices were equal to 65% of their long term average. That is a remarkably close correspondence, and it makes perfect sense. Rates of inflation that are well below average should produce a demand for investments that protect from inflation that is well below average, and that should logically lead to inflation-adjusted gold prices that are well below average. As it did.
For the whole period between 1980 and 2001 - the relationship between inflation-adjusted gold prices and the changing rate of inflation just plain made sense.
Gold As A Uniquely Valuable Investment Category
When we test the theory of gold as a stable store of value and perfect inflation hedge - then none of what actually happened between the early 1970s and early 2000s makes any sense. The wild spikes up in the purchasing power of gold shouldn't have happened, and the sharp spikes down shouldn't have happened either. Gold never should have experienced a 700% gain in inflation-adjusted terms over a decade, and it never should have lost 79% of its purchasing power over a more than two decade period either.
The actual history invalidates the belief system. (At least for those years, it is different over the longer term of previous centuries when gold was actually serving as money, rather than as an escape hatch for investors who were fleeing the destruction of the purchasing power of fiat money).
However, when we look at gold as a popular investment category dominated by the laws of supply and demand, where increasing demand increases values as inflationary fears rise, and decreasing demand drives values down when inflationary fears fall - then everything makes sense.
This does not invalidate the attractiveness or desirability of gold as an investment for protecting against inflation. Instead, gold becomes a substantially more sophisticated and attractive investment, particularly when viewed from a portfolio perspective.
As an example, let's say that someone keeps 10% of the value of their portfolio in gold, and the other 90% is money or investments that are vulnerable to the ravages of inflation. If gold is a stable store of value, and inflation rises sharply - then 10% of the portfolio keeps up with inflation, the other 90% does not, the purchasing power gets ravaged, and the investor is left with a 90% exposure to inflation on a portfolio basis.
However, If gold is not only just keeping up with inflation, but can dramatically rise in value in inflation-adjusted terms when inflation spikes upwards, then at the very time that the investor needs it most - gold can produce excess gains that can equal 100%, or 300% or even 700% of the original investment amount. In this case these extraordinary gains can reach out and shelter the inflation losses in the rest of the portfolio. Depending the specifics, most of the inflation-based losses in the other 90% could be covered - or the investor might be kept whole, or could even come out ahead (at least in pre-tax terms).
This ability for a relatively small portfolio component to "punch above its weight" and potentially reach out and shield a much larger portfolio from inflationary losses is both rare and extremely valuable. This is something that can't be done with a mere "stable store of value", and it also can't be done with inflation protection alternatives such as TIPS.
Of course, conversely, if inflation doesn't materialize, then our more sophisticated view of gold pricing makes it plain that the investors could lose most of the purchasing power of their investment over time. This might seem a problem in isolation (and it is a big problem if gold is most of the portfolio), but so long as precious metals are a minority component, then from an overall portfolio perspective the response to this potential issue could be - so what?
The other 90% is doing just fine. The gains generated during a sustained period of prosperity and low inflation would likely dwarf the slow incremental losses of the 10% component (in this example) that is invested in gold.
This supports a more sophisticated view of gold as a unique and highly attractive form of portfolio insurance. When the insurance turns out not be needed, then as with any insurance there is an ongoing cost in terms of slow losses, or the opportunity cost in terms of foregone cash flows and capital gains from other investment categories. However, when the insurance is needed during times of sharply rising inflation - the historical track record shows that gold delivers, and in amounts that can greatly exceed what is produced by some other types of inflation hedges.
While beyond the scope of this particular analysis, there a number of other unique advantages to gold when compared to many other financial instruments. The first and perhaps most important being that it isn't an actual "financial instrument", but is instead a physical asset, a yellow metal that is very valuable in small quantities and is quite portable.
Now, the difference between having all of one's assets in (effectively) electronic form and dependent on the stability of the global financial system, versus having some level of reserves that are not in electronic form nor part of the financial system may seem trivial or unimportant to most, and that is what it will be, quite unimportant - until it isn't.
(To be clear, the 10% number is just an example and not a suggestion. It is not uncommon to recommend a 5% to 10% precious metals weighting for high net worth investors - just in case - even if this is less common with many smaller investors. What is appropriate for any given individual, and whether that level is 5% or 25%+, is entirely dependent on the beliefs and circumstances of that individual.)
A Break In The Pattern
While what we have been reviewing worked great for many years, there is an issue, and it is plainly visible on the right side of the graph below.
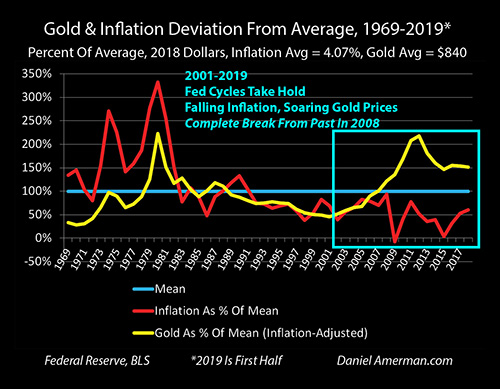
As is visually obvious, the relationship between inflation-adjusted gold prices and annual rates of inflation completely broke down after 2008. In the aftermath of the Financial Crisis of 2008, the average annual rate of inflation fell to 38% of its long term average. Based upon what we saw over the previous three decades, then gold should have fallen to an inflation-adjusted average price equal to something roughly around 38% of $840, which would be an inflation-adjusted price of about $319 an ounce (in 2018 dollars).
Gold didn't fall to $319 an ounce, but did the direct opposite. If we look at the average inflation-adjusted price for gold between 2009 and 2018, it was equal to $1,408 an ounce, which is equal to 168% of the long term average. This means that the average price of gold was 4.4X greater than what history indicates it should have been, based upon the government reported rate of inflation (168% / 38% = 4.4).
(Whether the government reported rate of inflation is accurate is an analysis for another day.)
This is a "feature", not a problem. The extraordinary divergence between the red line and gold line after 2008 is indeed boldly obvious. The numbers are very clear as well.
An extraordinary breakout has occurred - and the breakout is to the upside.
Something has changed - and it is increasing the demand for gold far above what it should be just based upon solely the government-reported rate of inflation.
It is also worth noting that the starting value for gold was $41 an ounce in 1969, and $36 an ounce in 1970. These numbers are much more reflective of gold prices in prior decades, when gold prices were pegged to the dollar for currency exchange purposes via the Bretton Woods agreement. The inflation-adjusted value of $41 an ounce for gold in 1969 is equal to $281 today (or at least based on the 2018 average value of the dollar).
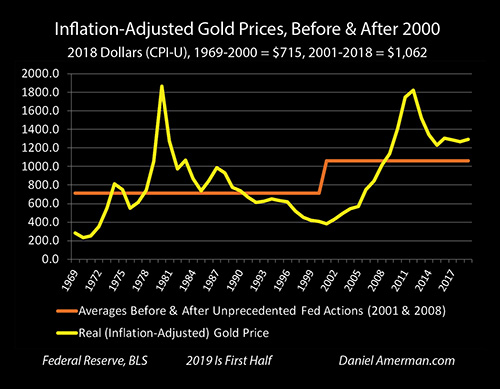
Another alternative is to take the same approach as we have been taking for other asset classes in previous chapters, and compare the average inflation-adjusted value of gold from 1969 to 2001, to average prices from 2000 to 2018. The previous long term average price for gold when we do not include the post-2000 prices is $715 an ounce.
So whether we look at simple historic averages for inflation-adjusted gold prices, or we look at norms in the decades prior to the early 1970s, or we look at what was developed herein in terms of the previous close relationship between rates of inflation and inflation-adjusted gold prices - from any of those perspectives, the current inflation-adjusted value of gold is abnormally high from a historical perspective.
Now, it needs to be noted that none of this necessarily negates the future relationship between rates of inflation and inflation-adjusted gold prices. All else being equal, an increase in inflation should increase the demand for gold as protection from inflation, the higher those prices go as a result, then the more speculators that should be drawn in, and there is every reason to believe that gold prices would again increase at a rate well in excess of the rate of inflation. So the advantages of using gold as a portfolio hedge against inflation should remain, and they should still be quite powerful.
This is the sixteenth chapter in this book that is in the process of being written, and we have previously been exploring the three bars on the left, those of the much higher asset prices that we have been seeing for bond prices, home prices and the stock value that is being assigned for each dollar of corporate earnings.
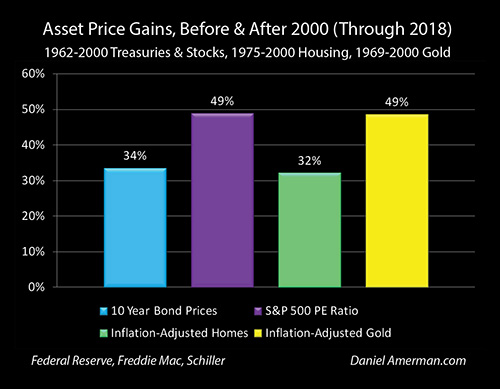
The yellow bar on the right shows a 49% increase in the inflation-adjusted price for gold from 2001 to 2018, relative to the 1969 to 2000 period. (Which is different from the 1969 to 2018 averaging mostly used in this particular analysis.)
As with each of the other asset categories, gold is up sharply, and it indeed equals the maximum increase for the other categories, that of the 49% increase in PE ratios for the S&P 500. But the source of gains for gold is entirely different than with the other three categories.
As we have been exploring, we have been going through cycles of crisis and the containment of crisis, with ever more heavy-handed Federal Reserve interventions eventually leading to every higher asset prices across all the major investment categories.
Using zero percent interest rate policies and quantitative easing in combination, the Fed has completely distorted the investment markets. Yes, inflation was falling as can be seen above, but the Fed was forcing down interest rates even more.
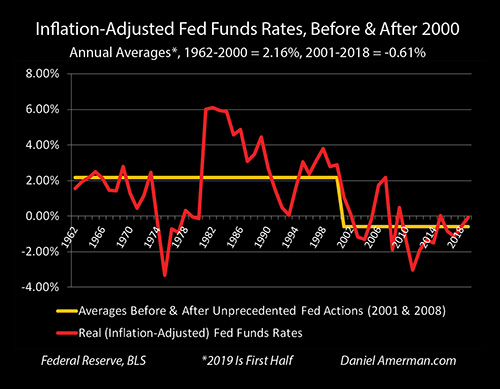
In combination, this produced the bizarre anomaly explored in previous chapters, where the Federal Reserve forced negative interest rates on the United States as a whole (in inflation-adjusted terms), for a period of eighteen years. It was that distortion which ultimately created elevated asset values for stocks, bonds and real estate.
That very same distortion should have driven gold prices to near historic lows, if inflation rates were all that determined gold prices - but it didn't. Instead we see what is arguably the greatest investment price distortions for any asset category - perhaps as much as 4.4X higher than what the rate of inflation alone would indicate - and it is coming from the direct opposite source of the higher asset valuations for stocks, bonds and real estate.
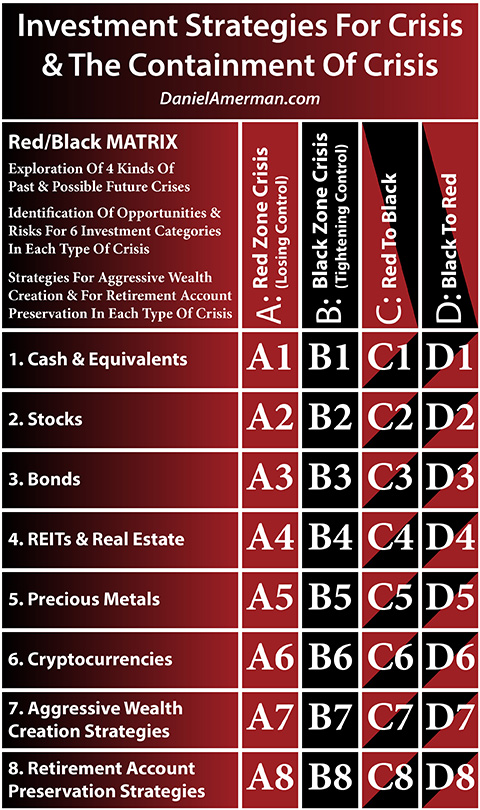
The graphic above is the framework we have been developing for exploring the new cycles of crisis and the containment of crisis (an introduction to the Red/Black matrix is linked here.)
For this book, this is our first close look at the fifth row, that of precious metals. Because it is so different from the other rows, it can do some fascinating things, particularly when viewed from within an overall portfolio context.
We've reached the limits for a single chapter here, and further development will take another chapter. I hope that this chapter has been of interest to you in terms of seeing precious metals investment in a different light, as well as identifying what has been so different in recent years.
Advantages Of Investing In Gold, A 50 Year Historical Analysis
Daniel R. Amerman, CFA
Website: http://danielamerman.com/
E-mail: mail@the-great-retirement-experiment.com
Daniel R. Amerman, Chartered Financial Analyst with MBA and BSBA degrees in finance, is a former investment banker who developed sophisticated new financial products for institutional investors (in the 1980s), and was the author of McGraw-Hill's lead reference book on mortgage derivatives in the mid-1990s. An outspoken critic of the conventional wisdom about long-term investing and retirement planning, Mr. Amerman has spent more than a decade creating a radically different set of individual investor solutions designed to prosper in an environment of economic turmoil, broken government promises, repressive government taxation and collapsing conventional retirement portfolios
© 2019 Copyright Dan Amerman - All Rights Reserved
Disclaimer: This article contains the ideas and opinions of the author. It is a conceptual exploration of financial and general economic principles. As with any financial discussion of the future, there cannot be any absolute certainty. What this article does not contain is specific investment, legal, tax or any other form of professional advice. If specific advice is needed, it should be sought from an appropriate professional. Any liability, responsibility or warranty for the results of the application of principles contained in the article, website, readings, videos, DVDs, books and related materials, either directly or indirectly, are expressly disclaimed by the author.
© 2005-2022 http://www.MarketOracle.co.uk - The Market Oracle is a FREE Daily Financial Markets Analysis & Forecasting online publication.