


Is This the "Kiss of Death" for the Stocks Bull Market?
Stock-Markets / Stock Market 2021 Sep 14, 2021 - 10:58 PM GMTBy: EWI

Stock market prices usually decline after this occurs
Many market observers believe that the catalyst for the next bear market will be a piece of extraordinarily bad news.
However, Elliott Wave International has shown time and again that the stock market's price action is often "entirely detached from what most people assume are causal conditions."
Examples of stocks rising when the news is bad -- and falling when the news is good -- are so numerous that a library shelf of books would be inadequate to show a fair representation of them. For the most recent vivid example, just think back to March 2020, when the first wave of the pandemic hit and shuttered the entire global economy -- yet, stocks (around the world!) happily found a bottom and haven't looked back since.
No, the stock market is governed by the psychology and behavior of investors themselves.
One of the noteworthy behaviors is investors' use of margin debt.
Indeed, back in 1980, The Elliott Wave Theorist, a monthly publication which provides analysis of financial markets and social trends, said:
[A] failure of margin debt to expand in an advancing market [can be] the 'kiss of death' to a bull trend.
With that in mind, consider this chart and commentary from the recently published September Elliott Wave Financial Forecast, a monthly publication which covers key U.S. financial markets:
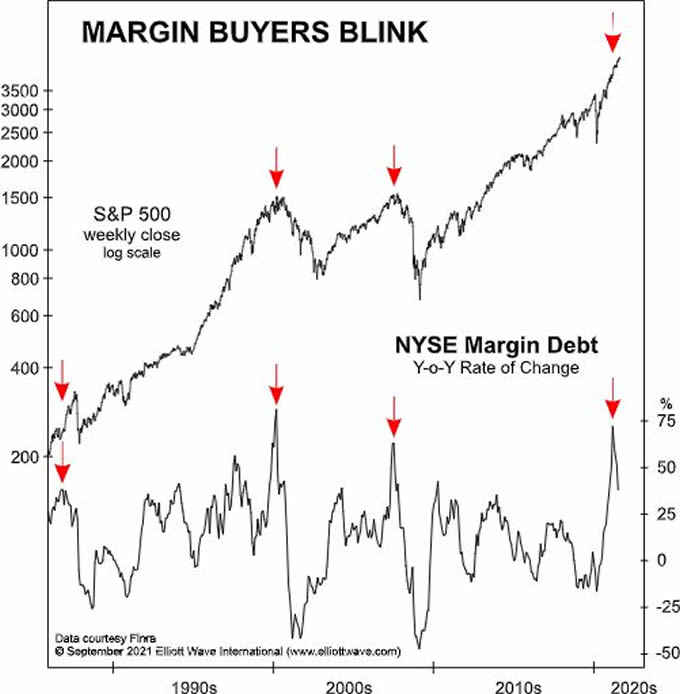
The arrows on the chart of the year-over-year change in New York Stock Exchange margin debt show that [The Theorist's] statement has been true at three major market tops over the last 24 years: at the market top in August 1987 ... the S&P's March 2000 top ... and at the October 2007 peak. As the latest arrow shows, a rapid expansion in margin debt has, once again, reversed trend.
Keep in mind that the stock market does not always decline after a year-over-year drop in margin debt. However, if the use of margin debt substantially falls just after reaching a record high, history does show that stock prices usually tumble thereafter.
That said, in June, margin debt reached a record high of $882 billion, which makes the July retreat of $37.7 billion especially significant.
The Elliott wave model pinpoints the patterns of investor psychology even more precisely.
As our September Financial Forecast said, the current unfolding Elliott wave of the Dow Industrials is "one for the ages."
If you'd like to learn how the Wave Principle can help you analyze and forecast financial markets, Elliott Wave Principle: Key to Market Behavior, is the go-to book for doing so. Here's a quote from this Wall Street classic:
Because applying the Wave Principle is an exercise in probability, the ongoing maintenance of alternative wave counts is an essential part of using it correctly. In the event that the market violates the expected scenario, the alternate count puts the unexpected market action into perspective and immediately becomes your new preferred count. If you're thrown by your horse, it's useful to land right atop another.
Always invest with the preferred wave count. Not infrequently, the two or even three best counts comfortably dictate the same investment stance. Sometimes being continuously sensitive to alternatives can allow you to make money even when your preferred count is in error. For instance, after a minor low that you erroneously consider of major importance, you may recognize at a higher level that the market is vulnerable again to new lows. This recognition occurs after a clear-cut three-wave rally follows the minor low rather than the necessary five, since a three-wave rally is the sign of an upward correction. Thus, what happens after the turning point often helps confirm or refute the assumed status of the low or high, well in advance of danger.
You can read the entire online version of the book for free when you become a Club EWI member. Club EWI is the world's largest Elliott wave educational community and is free to join. Members enjoy free access to a wealth of Elliott wave resources on financial markets, investing and trading.
Get started by following this link: Elliott Wave Principle: Key to Market Behavior -- free and instant access.
This article was syndicated by Elliott Wave International and was originally published under the headline Stocks: Is This the "Kiss of Death" for the Bull Market?. EWI is the world's largest market forecasting firm. Its staff of full-time analysts led by Chartered Market Technician Robert Prechter provides 24-hour-a-day market analysis to institutional and private investors around the world.
© 2005-2022 http://www.MarketOracle.co.uk - The Market Oracle is a FREE Daily Financial Markets Analysis & Forecasting online publication.