


SILVER’S BAD BREAK
Commodities / Gold and Silver 2022 Aug 05, 2022 - 06:47 PM GMTBy: Kelsey_Williams

Bad breaks can be tough to recover from. The process can be arduous and can take a long time. Sometimes a full recovery remains elusive and distant.
Silver has a history of bad breaks over the past half-century. Below is a series of charts that tell the story…
CHART NO. 1
Silver Prices – 2 Year Historical Chart
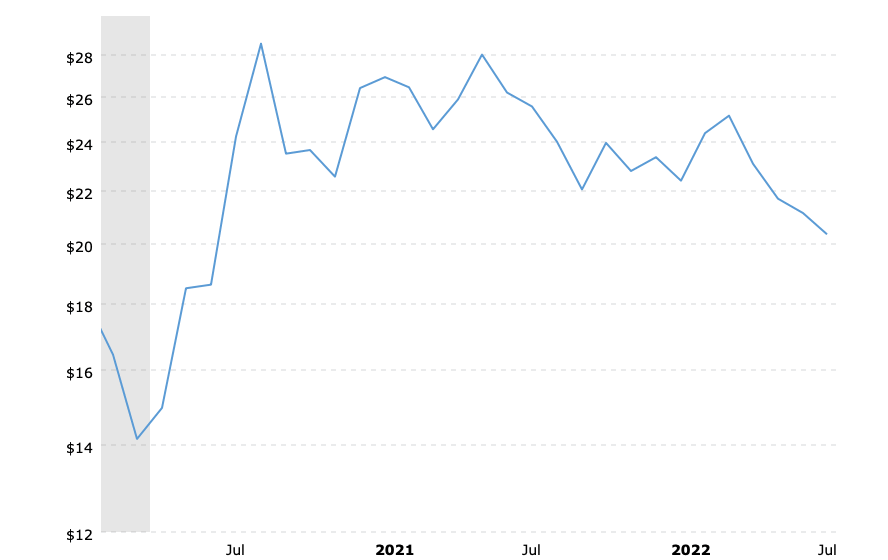
An extended, downward slide has taken the silver price down by thirty percent since its peak of close to $30 oz. in August 2020. At its recent low of $18.40, silver’s price has declined by thirty-seven percent over the past two years.
CHART NO. 2
Silver Prices (inflation-adjusted) – 2 Year Historical Chart
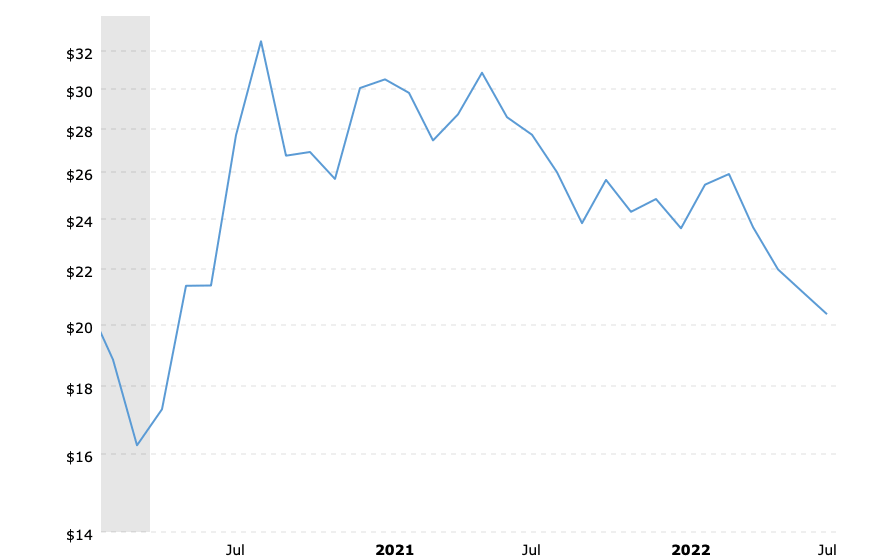
The magnitude of the price decline is amplified in Chart No. 2 when factoring in the effects of inflation. In this case, the decline from silver’s 2020 peak to its recent low amounts to forty-three percent.
CHART NO. 3
Silver Prices – 10 Year Historical Chart
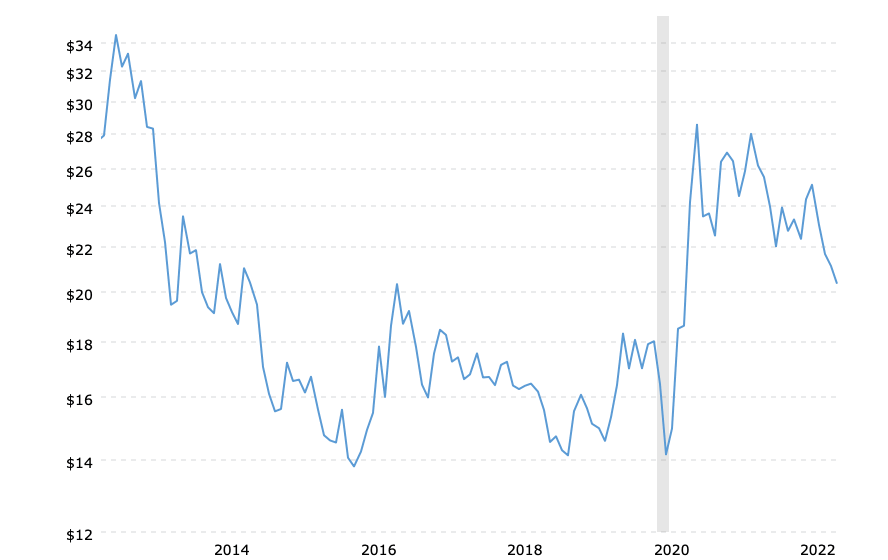
The ten-year history above helps bring additional perspective to silver’s break. Since October 2012, silver’s price has declined by forty-six percent. If we go back to the April 2011 peak, the decline measures a whopping sixty-one percent.
CHART NO. 4
Silver Prices (inflation-adjusted) – 10 Year Historical Chart
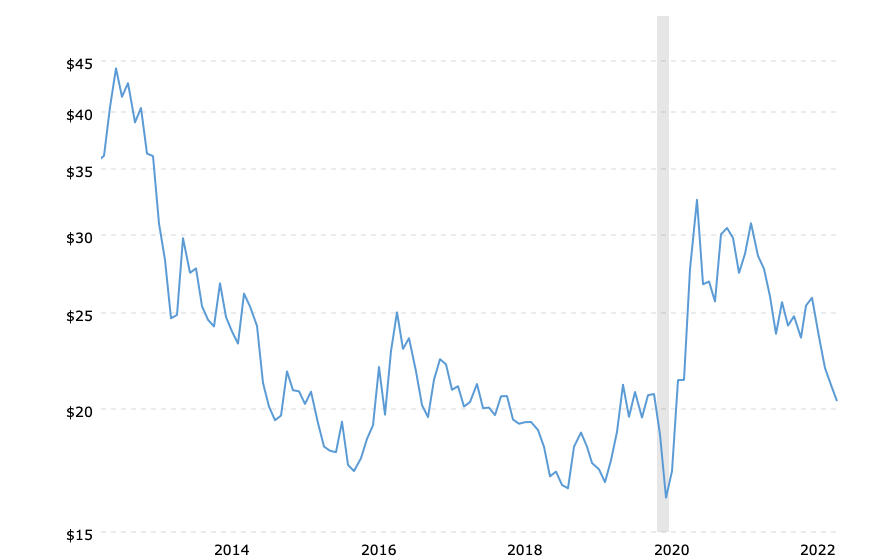
The effects of inflation give a more accurate picture and the numbers are worse. The forty-six percent decline shown in Chart No. 3 increases to nearly fifty-nine percent in Chart No. 4 above. The sixty-one percent decline from the April 2011 peak measures seventy-one percent.
CHART NO. 5
Silver Prices – 50 Year Historical Chart
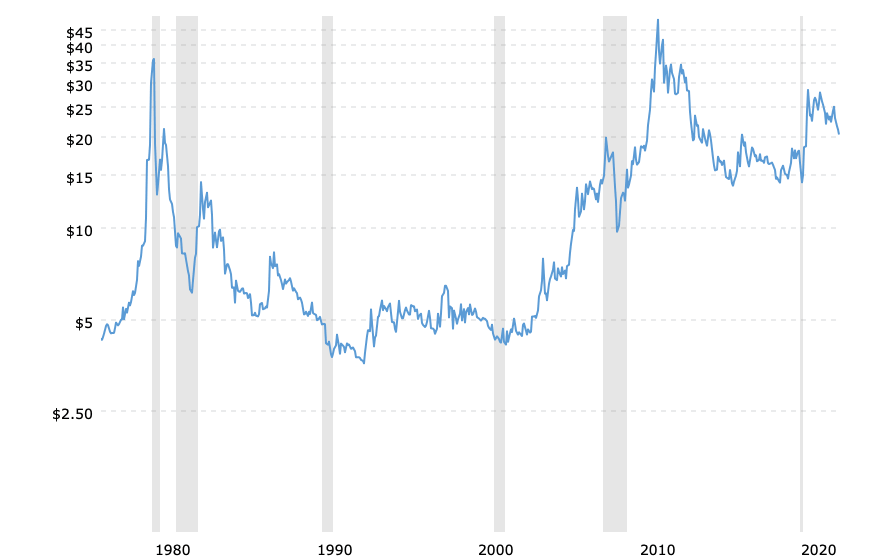
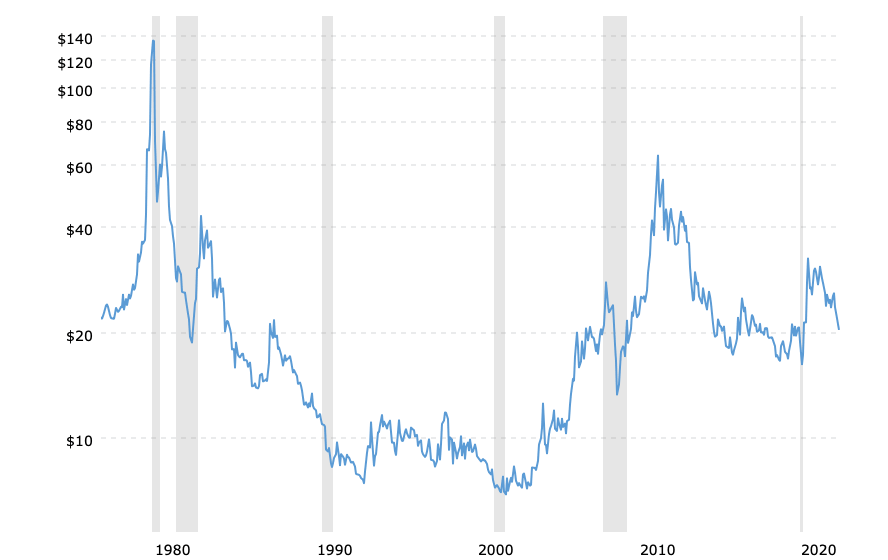
Looking at Chart No. 5, it appears that silver has reasserted itself on a long-term basis and that its price is ascending nicely. However, after allowing for the effects of inflation, the picture looks depressingly different. This is shown in Chart No. 6 below…
CHART NO. 6
Silver Prices (inflation-adjusted) – 50 Year Historical Chart
SILVER NEARLY ALWAYS IN RECOVERY MODE
Price action to the upside for silver is always a matter of retracing lost ground. The biggest, most explosive moves to the upside come after huge, multi-year declines, and the up moves never get back to their original highs.
The intraday high for silver in January 1980 was $49.45 oz. It took thirty-one years for silver to find its way back to that price level – almost. It topped out at $48.70 in April 2011.
Then, in August 2020, silver’s price peaked at $29.26. This was followed by a secondary peak the following year in May 2021 at $29.45.
Silver’s recent low of $18.40 oz. is the lowest it has been since May 2020, before those price peaks occurred.
NO NEW HIGHS FOR SILVER
Some final thoughts for silver enthusiasts…
- Silver needs to be at $64 oz. right now to match the inflation-adjusted peak from April 2011.
- Even if silver were at $64 oz now, it would still need to be triple that number to match the January 1980 peak.
- The inflation-adjusted, 1980 intraday peak for silver is currently $187 oz.
- Silver, at $20 oz., is priced ninety percent below its 1980 peak intraday price.
Expecting new highs in the silver price amounts to wishful thinking. Even ordinary, bullish projections for higher silver prices are unsupported by fundamentals and by historical fact.
(Also see Silver Is Cheap – And Getting Cheaper and Inflation Is Killing Silver)
Kelsey Williams is the author of two books: INFLATION, WHAT IT IS, WHAT IT ISN’T, AND WHO’S RESPONSIBLE FOR IT and ALL HAIL THE FED!
By Kelsey Williams
http://www.kelseywilliamsgold.com
Kelsey Williams is a retired financial professional living in Southern Utah. His website, Kelsey’s Gold Facts, contains self-authored articles written for the purpose of educating others about Gold within an historical context.
© 2022 Copyright Kelsey Williams - All Rights Reserved Disclaimer: The above is a matter of opinion provided for general information purposes only and is not intended as investment advice. Information and analysis above are derived from sources and utilising methods believed to be reliable, but we cannot accept responsibility for any losses you may incur as a result of this analysis. Individuals should consult with their personal financial advisors.
© 2005-2022 http://www.MarketOracle.co.uk - The Market Oracle is a FREE Daily Financial Markets Analysis & Forecasting online publication.