


Answering the Question - Has the Stocks Bear Market Bottomed? Apple Nut About Crack?
Stock-Markets / Stock Market 2022 Oct 02, 2022 - 10:29 PM GMTBy: Nadeem_Walayat

Dear Reader
Has the BEAR market Bottomed? That is the question I am most often asked for the duration of this bear market, where my earlier responses were that my focus was on accumulating target stocks as they DEVIIATE FROM THEIR HIGHS TO NEW LOWS, so where the indices actually bottom is largely irrelevant. Still this is the most asked question so following the June bottom my stance changed to the bottom is probably in for most target stocks, though I cannot say the same for the indices. However in the run up to 4180 I had penciled in a subsequent bear swing target of between 3720 to 3920 for a probable higher low, which means that June was probably the bottom. This weeks price action further strongly suggests that the BOTTOM IS IN as I voiced in the comments section of my last article where for me the key indication was the breakout above 4200, it was not an intraday move or a few shallow spikes above 4200, Instead the S&P rocketed higher by over 110 points in a 3 day run from 4200 to 4317 that acted as a strong indicator that 3637 was THE BOTTOM, and thus all we can now seek is a correction of a fraction of the rally off the bottom for a 2nd bite at the AI stocks investing cherries.
However, the bottom is in is also based on my past studies that suggest a 50% reversal from the bear market lows usually act as a strong indication of the bottom being in which is the focus of this analysis that acts as a further excerpt from my forthcoming in-depth analysis that I have hit the pause button on for 1 week as I venture out of my castle for the first time in 6 months to travel to Wales for some sun, sea and sand and perhaps see if I can find Excalibur in one of it's many lakes that follows the slow recovery form my March ruptured Achilles tendon injury that revealed the extent to which the NHS is a JOKE Health Service when one actually has the misfortune to use it.
This analysis Answering the Question - Has the Stocks Bear Market Bottomed? Apple Nut About Crack? was first made available to patrons who support my work.So for immediate first access to ALL of my analysis and trend forecasts then do consider becoming a Patron by supporting my work for just $4 per month. https://www.patreon.com/Nadeem_Walayat.
Most recent analysis includes -
- Can the Stock Market Hold June Lows Despite Spiking Yields and Dollar Panic Buying?
- September the Stock Markets WORST Month of the Year Could Deliver a Buying Opportunity
- Jerome Powell's TRANSITORY DIP in INFLATION, AI and High Risk Stocks Updated Buying Levels
- Answering the Question - Has the Stocks Bear Market Bottomed? Saudi Black Swan
Including access to my soon to be published extensive analysis that concludes in a detailed 1 year trend forecast into October 2023.
So for immediate first access to to all of my analysis and trend forecasts then do consider becoming a Patron by supporting my work for just $4 per month. https://www.patreon.com/Nadeem_Walayat.
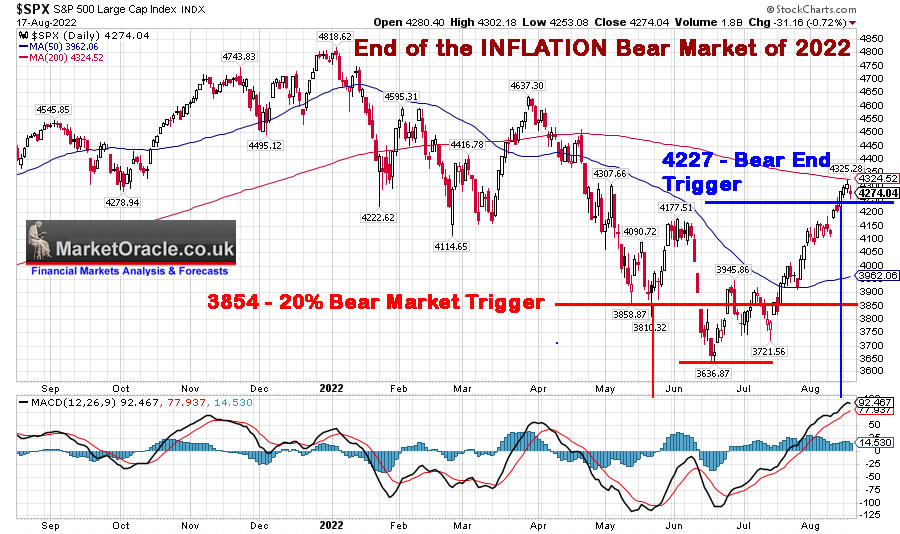
The Great Inflation Bear Market of 2022
Firstly bear markets need to be triggered for one to start contemplating a reversal signal which thus requires a 20% drop, this analysis is focused on the S&P as I slowly trend away from analysis of the Dow.
Summary of the Bear Market END Indicator.
1. Bear Market triggered after a 20% drop
2. Stock market rallies beyond 50% of the Bull high to bear low range .
Note this is obviously not a trading or investing indicator but solely seeks to answer the question is the Bear Market Over?
The S&P topped at 4818, 20% bear market trigger was at 3854, subsequent lowest point of the bear market was at 3637, 50% advance from equals 4227, thus should the S&P break above 4227 then that indicates that the bear market is over and thus whatever follows in terms of the next swing down, it should NOT break the June 3667 low, instead set a higher low. As you are probably all aware the S&P DID break above 4227 last Friday and thus implies that the bear market is over and thus one should position oneself accordingly know that the probability of the S&P breaking below 3637 during the remainder of this year is very low.
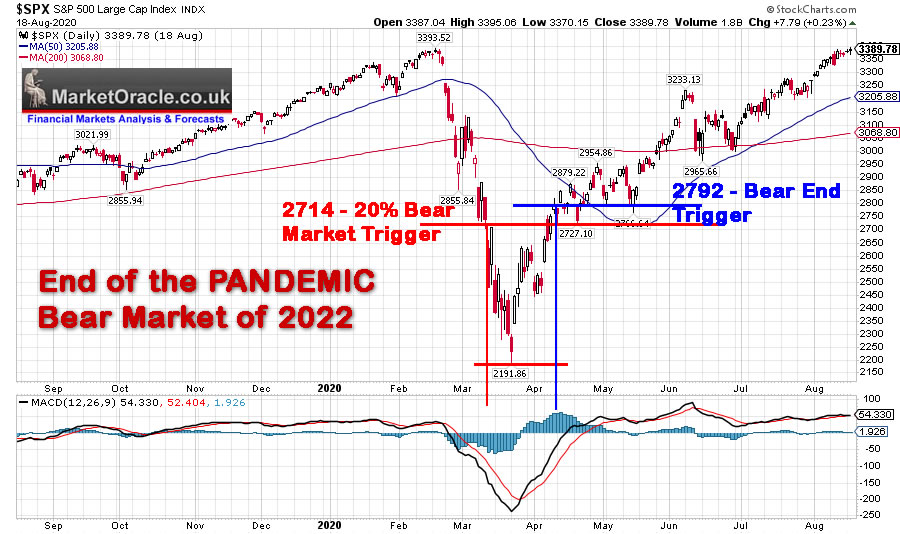
The Pandemic Bear Market of 2020
The S&P topped at 3393, 20% bear market trigger was at 2714, subsequent lowest point of the bear market was 2192, 50% advance from equals 2792, thus signaled the end of the Pandemic bear market on a break above 2972, which was followed by a 60% advance on the 50% trigger level to the next bull market peak.
GFC Bear Market of 2007 to 2009
The S&P topped at 1576, 20% bear market trigger was at 1260, subsequent low of the bear market was 1257, 50% advance from equals 1416, which was triggered during MAY 2008 so one can either treat the 3 month rally as a tiny bull market or more accurately as a FALSE signal. A lesson that If the housing market goes gaga you can forget about a stocks bear market bottom!
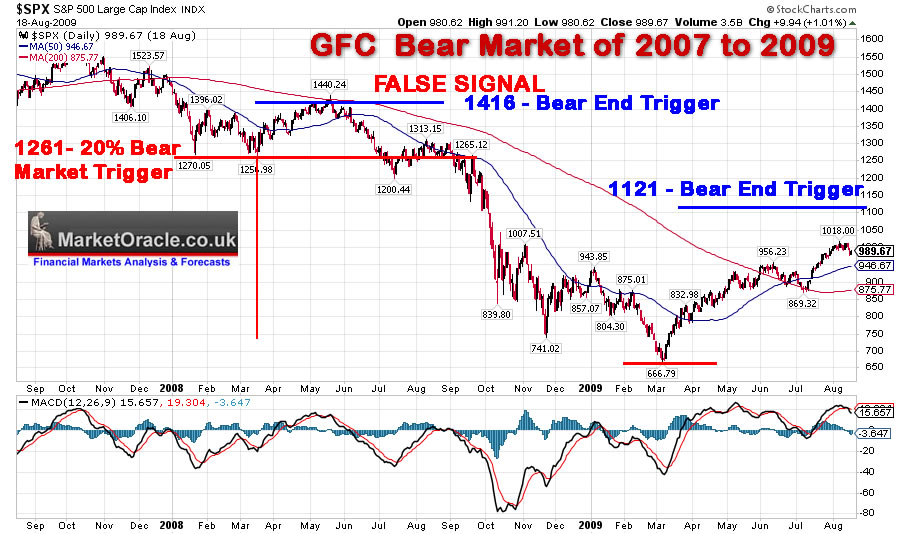
The actual end of the bear market trigger came some 18 months later during 2009 on break above 1121 off of the 667 low.
The Dot Com Bust Bear Market of 2000 to 2003
This market was very volatile that witnessed very powerful counter trend rallies. However, despite a series of powerful up swings NOT once resulted in a FALSE End of the Bear Market trigger.The S&P topped at 1553 in March 2000, following which the volatile bear market did not trigger a reversal until the rally off the 768 low to above 1160 early 2004 which acted to confirm that the bear market was over following which the bull run continued for another 3 years to 1576.
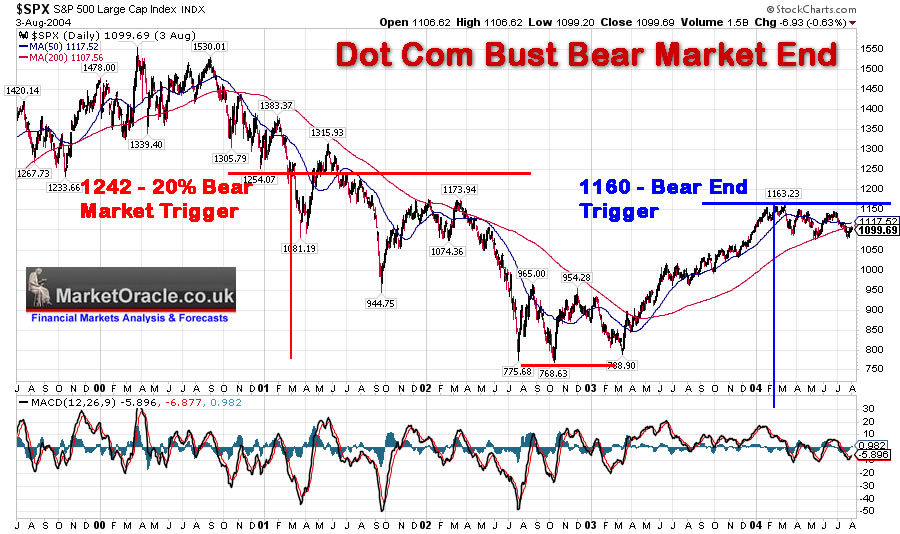
(Charts courtesy of stockcharts.com)
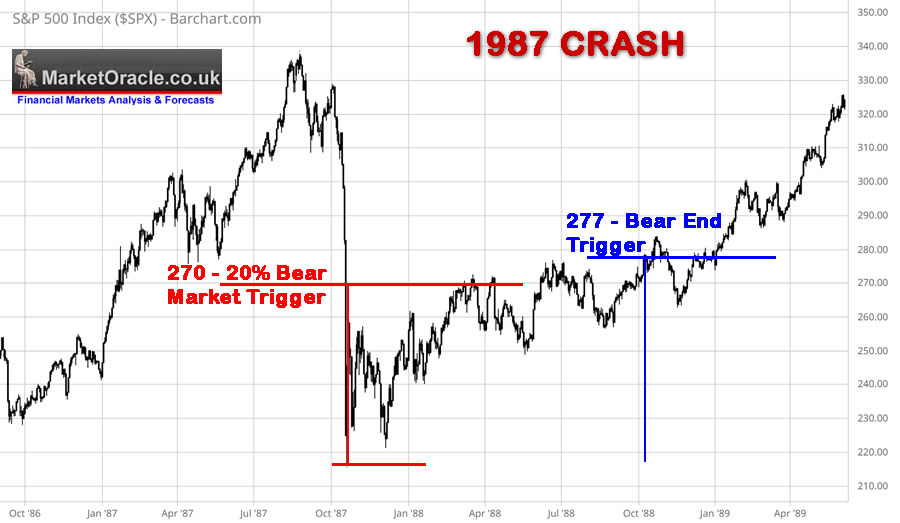
1987 CRASH
August top at 338, bear triggered during Black Monday on break below 270, bear market low at 216.6, 50% trigger 277 triggered a year later in October 1988, then the S&P X6 over next 12 years.
So to answer the question has the bear market ended?
There is a 80% probability that the bear market has ended, whilst we will get a retest of sorts there's only a 20% chance that it will break the June low.
And once more this is a "Has the Bear Market ENDED" Indicator, it is not a trading or investing signal as ones objective is to accumulate during the bear market at prices that are significantly below this trigger price i.e. at well below S&P 4227 for which we should see further opportunities to do so in the run up to the mid-term election chaos.
S&P Current State
My view during the current rally has been that on it's conclusion I expect the S&P to target a trend to between 3720 to 3920 with 3820 as being the most probable outcome. Now I would revise my trend expectations to target 3920 as being most probable. The S&P this week gave it's SELL signal on a decisive break below 4280, falling to a low of 4252, it does not matter that the market has rallied since to back above 4280, that is what markets do, the break lower than return to above the breakout point to create the lower highs and lows price pattern, so the rally 'should' have topped at 4317 and we are now in the very early stages of a downtrend.
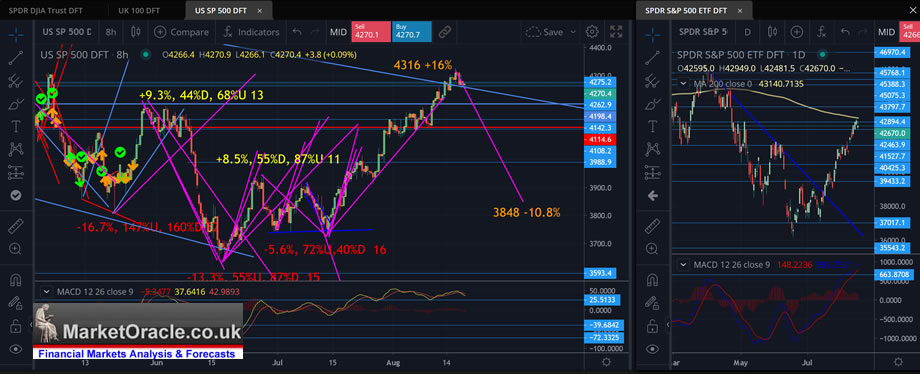
The S&P closed Thursday at 4283, clearly something is 'temporally' holding the market up, what could it be?
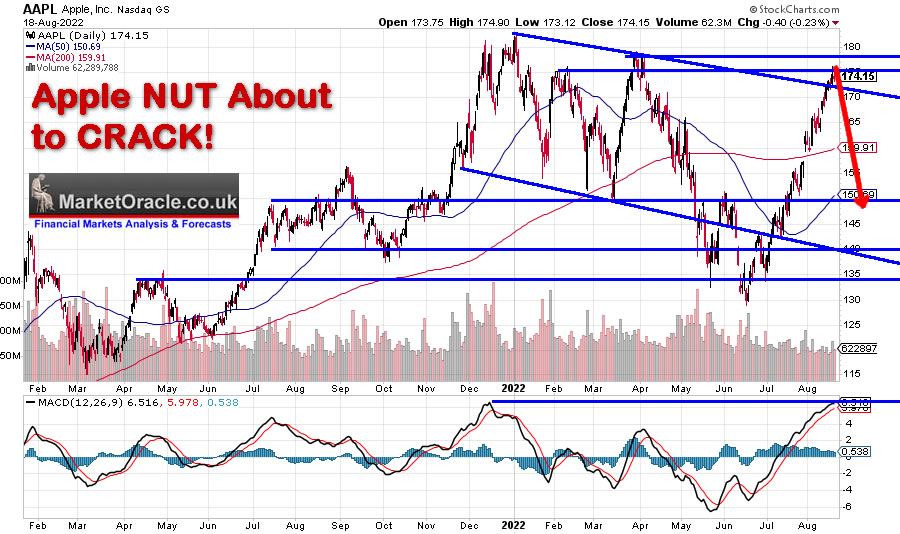
A loony toons cartoon bull run in the Apple stock price, lifting it 36% off it's low to a high of $176 within touching distance of it's all time high of $182, trading on a PE of 29X earnings, not far from the bull market peak of 30.6! Market cap of $2.8 trillion! EC ratio of 106, EGF -17%, EGF12M 4%, Fair value of $107. This is a cartoon stock! If Apple was NOT cheap near it's lows then what is it now? My best guess is that it's being seen as a safe haven in times of uncertainty, so rather than reflecting market strength is actually suggesting extreme fear! Why else pay X29 for a bloated over hyped expected to fall earnings, trading on a market cap of $2.8 trillion stock?
I can see the headlines in the not too distant future "APPLE HAS FALLEN" A ticking time bomb, just as it was at the end of March when it held up the S&P until the NUT CRACKED! Which at the very least suggests a SHARP drop to $150, How can this go even higher? It' CAN'T under any commonsense analysis for the prospects of the stock and it's valuation, 29X earnings, think about that! TWENTY NINE TIMES EARNINGS! Should be UNDER X19 earnings which equates to a stock price of $115! Which is why I hold virtually no Apple stock. Instead I am short equivalent to 4% of my target long exposure, only second to my S&P short position, with my next largest shorts being on Microsoft, Tesla and Amazon, though still only a pin pricks in terms of overall exposure.
AI Stocks Portfolio
A reminder that the primary objective during this bear market is to accumulate target stocks at deep deviations form their highs, where the greater the deviation then the greater the buying opportunity being presented.
My target is to get to 85% invested during this bear market, peak exposure was 77% invested, current is 71.5% following trimming during the current rally, However that now drops to 65.8% following influx of new cash to capitalise on what I was anticipating as a probable last leg down for this bear market into the end of August. Overall since the start of the year I have now added cash equivalent to about 12% of my original portfolio, at the start of the year I was 40% invested which equates to being 28% allowing for 12% new cash, so in effective terms my exposure to stocks has increased from 28% to 65.8% during the bear market.
For the portfolio table see my article of a few days ago.
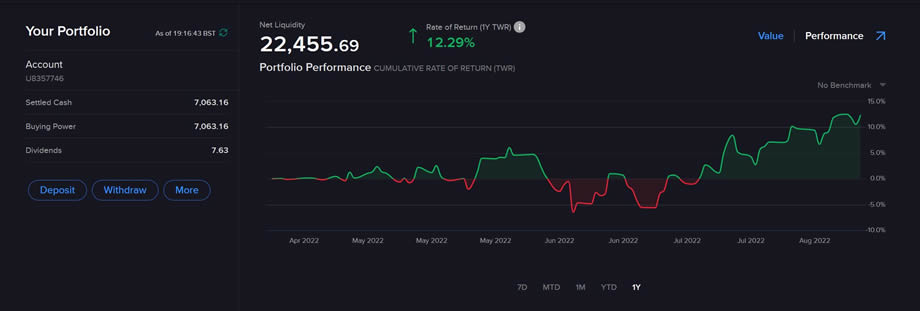
How to Profit During a Bear Market - Portfolio Account
Back in early April I opened an IKBR ISA with £20k (ISA limit) that I proceeded to quickly populate with target stocks as they traded down to new bear market lows. ISA's limit what one can do, i.e. NO SHORTING, Options and no access to most ETF's due to HMRC rules, another restriction is one cannot hold US Dollars, every buy and sell has to be converted into and out of US dollars, so ISA's are definitely geared towards longer term investors. Anyway the IKBR ISA acts as a good real world proxy for how my public portfolio should perform if one followed my analysis, where the primary goal is to accumulate during this temporary bear market to capitalise on during the subsequent bull market, my expectations from the outset were that there WILL BE DRAWDOWNS because stock prices FALL during bear markets so as to result in the buying opportunities, stocks getting cheaper during a bear market is a good thing! Cheaper in terms of their valuations for if a stock price falls and the stock gets more expensive in valuation terms then that is NOT a good thing!
Current state of the IKBR ISA is up 12% since inception (Early April 2022) through following my analysis of buying target stocks when they trade down to NEW LOWS and then trimming lightly on the subsequent rallies, cash now comprises about 33% of this portfolio up from about 3% near the lows, as IKBR does not charge a rip off f/x fee as many brokers, for comparison FreeTrade charges 0.45%, AJ Bell 1% and Interactive Investor charge 1.5%, what are they smoking! AJ Bell recently cut their f/x fee to 0.75% but their platform is a pain in the butt to use for US stocks i.e. NO LIMIT ORDERS!
So my IKBR ISA is primed to pile back on the next dip. Max draw down was -6.5% at the Mid June low when I was fully invested, max gain was +12.55% a few days ago. It's not easy to be FLAT let alone up 12% during a bear market! And why even though I expected NEW bear market lows into Aug/Sept that did not stop me accumulating target stocks as I often voiced in my articles not to focus on the indices but rather the individual stocks for we will only see the bear market bottom proper in the rear view mirror which strongly looks to be the case today.
The portfolio largely resembles my AI stocks portfolio as my Top 11 holdings illustrate with a sprinkling of Feb 2022 high risk stocks where the most stocks trimmed during the current rally have been GFS, Qualcom, AVGO, ADSK, ASML, AMD, GPN, Amazon, Roblox, JBL, and Arrow.
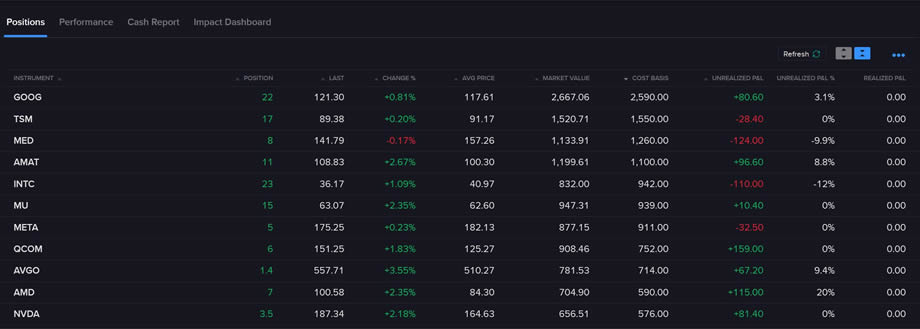
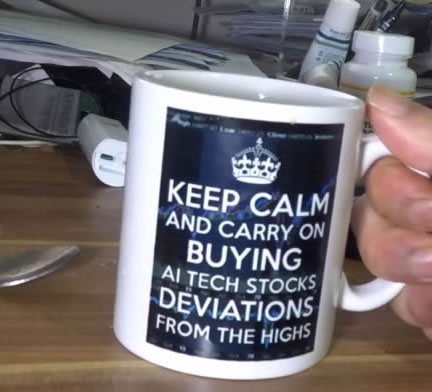
So even if ones timing sucks i.e. I did not buy any of these near their LOWS, still the strategy does work! And why I tend to BE CALM AND CARRY ON BUYING QUANTUM AI TECH STOCKS AS THEY DEVIATE FROM THEIR HIGHS, whilst many investors are running around like headless chickens, reacting to nonsense market calls of SELL EVERYTHNG RIGHT AT THE MARKET BOTTOM!
Saudi Arabia Potential DOOMSDAY BLACK SWAN!
Yes here's another potential black swan brewing in the background as the world continues to reel from the impact of high oil prices with the blame firmly being placed at the feet of Czar Putin, so I trundled along to take a look under the hood of the oil market and I noticed something strange that could result in an oil market DOOMSDAY Black Swan event!
Look at the graph of proven Saudi Arabian oil reserves and what do you see?
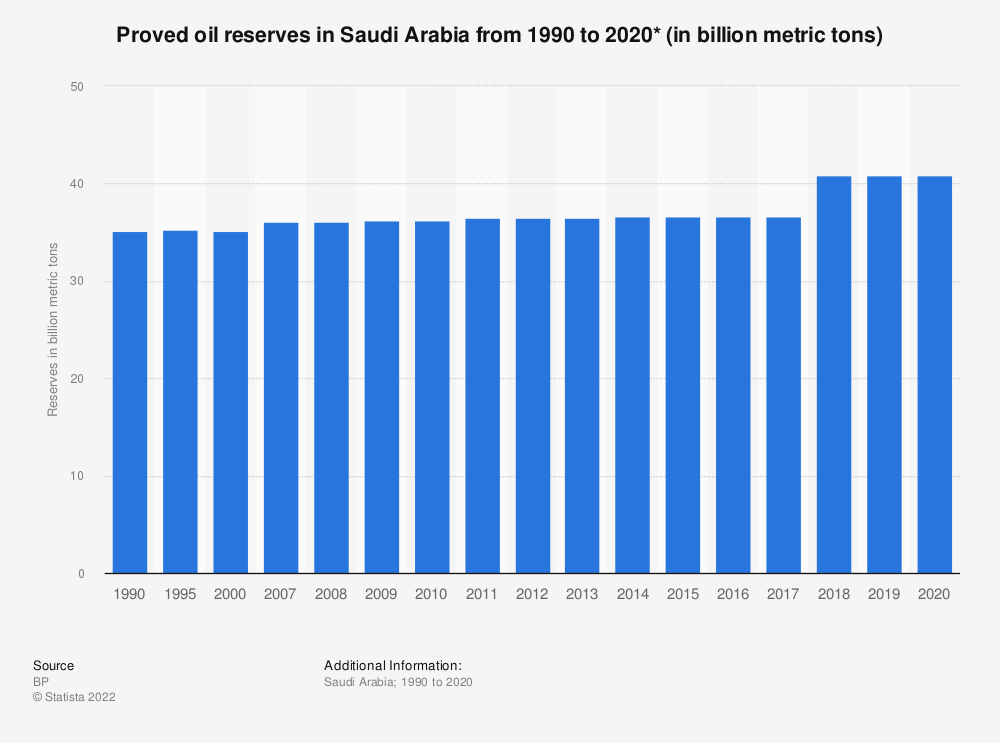
Constant proven reserves that hovered at 30.9 billion metric tonnes for decades but then jumped in to 40.9 billion around the time when there was much media hype surrounding IPO for Saudi Aramco in December 2019 when the Saudis sold a 1.5% stake that valued the Energy giant at $2 trillion, with current plans to sell a further $50 billion of shares this year.
Do you see it?
How the hell are Saudi oil reserves constant at 30.9 billion for decades and then jump to 40.9 billion ahead of the IPO when Saudi Arabia pumps out 550 million metric tonnes of oil per year, that's 22 billion tonnes of oil over the past 40 years!
Does Saudi Arabia actually have 40 billion metric tonnes of oil or is this the mother of all ENRON's! Hence why Saudi Arabia is eager to sell more shares in Saudi Aramco before the shit hits the fan and we find out that Saudi Arabia's oil reserves are a function of a horizontal line drawn by the hand of MBS himself and his father before him, the real reserves are likely 31 minus 22 = 9 billion metric tonnes, enough to continue conning the world for perhaps another 16-18 years, instead of the implied 75 years.
This also explains why Saudi Arabia is refusing to open the oil taps and increase supply even though it would profit hugely from doing so, it's because THEY CANNOT INCREASE OUTPUT! The max output of Saudi oil fields has been stuck at 10.5 million barrels per day for decades! All they need to do to increase supply is drill a few more wells, but why would they do that if it means.
a. They will run out oil sooner.
b. That the new oil wells will only have a short shelf life.
What would it mean for oil prices when the Saudi Emperor is found to have no oil? Oil price X2? X3? X4? And what if similar is true for other oil gulf states such as Iran, Iraq and Kuwait reminds me of the Milkshake scene out of "There will be Blood".
https://youtu.be/GX-9wXFQRgA
The bottom line is this potential Black Swan could rock the world's economic and geopolitical system if Saudi Arabia was found to have lied about it's oil reserves, the clear winners would be Russia and Venezuela, I can imagine the Americans kowtowing to Venezuela, let bygones be bygones, ce sara sara, Auld Lang Syne and all that, North and South Americans are brothers and sisters, now SELL us your OIL you bas....ds.
This analysis Answering the Question - Has the Stocks Bear Market Bottomed? Saudi Black Swan was first made available to patrons who support my work.So for immediate first access to ALL of my analysis and trend forecasts then do consider becoming a Patron by supporting my work for just $4 per month. https://www.patreon.com/Nadeem_Walayat.
Most recent analysis includes -
- Can the Stock Market Hold June Lows Despite Spiking Yields and Dollar Panic Buying?
- September the Stock Markets WORST Month of the Year Could Deliver a Buying Opportunity
- Jerome Powell's TRANSITORY DIP in INFLATION, AI and High Risk Stocks Updated Buying Levels
- Answering the Question - Has the Stocks Bear Market Bottomed? Saudi Black Swan
Including access to my soon to be published extensive analysis that concludes in a detailed 1 year trend forecast into October 2023.
So for immediate first access to to all of my analysis and trend forecasts then do consider becoming a Patron by supporting my work for just $4 per month. https://www.patreon.com/Nadeem_Walayat.
My Main Analysis Schedule
- UK House Prices Trend Forecast - Complete
- Stock Market Trend Forecast to October 2023 - 90%
- US House Prices Trend Forecast - 80%
- Global Housing / Investing Markets - 50%
- US Dollar / British Pound Trend Forecasts - 0%
- High Risk Stocks Update - Health / Biotech Focus - 0%
- How to Get Rich - 85%

- Gold and Silver Analysis - 0%
- State of the Crypto Markets
Again for immediate access to all my work do consider becoming a Patron by supporting my work for just $4 per month. https://www.patreon.com/Nadeem_Walayat.
Your analyst feeling the urge to increase exposure to oil stocks before the mother of all milkshake scams is revealed!
By Nadeem Walayat
Copyright © 2005-2022 Marketoracle.co.uk (Market Oracle Ltd). All rights reserved.
Nadeem Walayat has over 30 years experience of trading derivatives, portfolio management and analysing the financial markets, including one of few who both anticipated and Beat the 1987 Crash. Nadeem's forward looking analysis focuses on UK inflation, economy, interest rates and housing market. He is the author of five ebook's in the The Inflation Mega-Trend and Stocks Stealth Bull Market series that can be downloaded for Free.


 Nadeem is the Editor of The Market Oracle, a FREE Daily Financial Markets Analysis & Forecasting online publication that presents in-depth analysis from over 1000 experienced analysts on a range of views of the probable direction of the financial markets, thus enabling our readers to arrive at an informed opinion on future market direction. http://www.marketoracle.co.uk
Disclaimer: The above is a matter of opinion provided for general information purposes only and is not intended as investment advice. Information and analysis above are derived from sources and utilising methods believed to be reliable, but we cannot accept responsibility for any trading losses you may incur as a result of this analysis. Individuals should consult with their personal financial advisors before engaging in any trading activities.
Nadeem Walayat Archive |
© 2005-2022 http://www.MarketOracle.co.uk - The Market Oracle is a FREE Daily Financial Markets Analysis & Forecasting online publication.