


Stock Market US Presidential Election Cycle and Recessions
Stock-Markets / Stock Market 2023 Feb 20, 2023 - 09:40 PM GMTBy: Nadeem_Walayat

Dear Reader
Did you catch the Pump into last weeks US CP LIE data followed by the Dump? What happen's next - Stock Market Counting Down to Pump and Dump US CPI LIE Inflation Data Release
The Santa rally that runs for 7 trading days into the start of each new year expired on the 4th of January and believe it or not technically we actually got a Santa rally, the 7th straight Santa rally in a row.
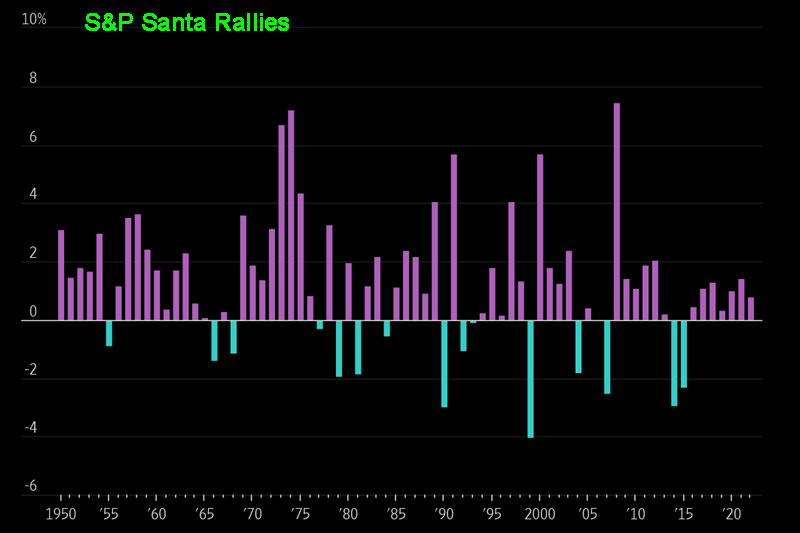
Of course it was a FAIL in terms of how ones portfolios technically played out but it did happen even if it seemed like Santa had gone missing this year. However the third run to a target S&P 4000 has remained pending given that my expectations have been for the window for a rally into the Middle of January which could stretch to options expiration of 20th of January, remember we have already had 2 breaks above 4000, the last being into the early December moon shot that propelled the S&P to just above my original target of 4,100 that gave way to the current correction ahead of a third run to 4,000.
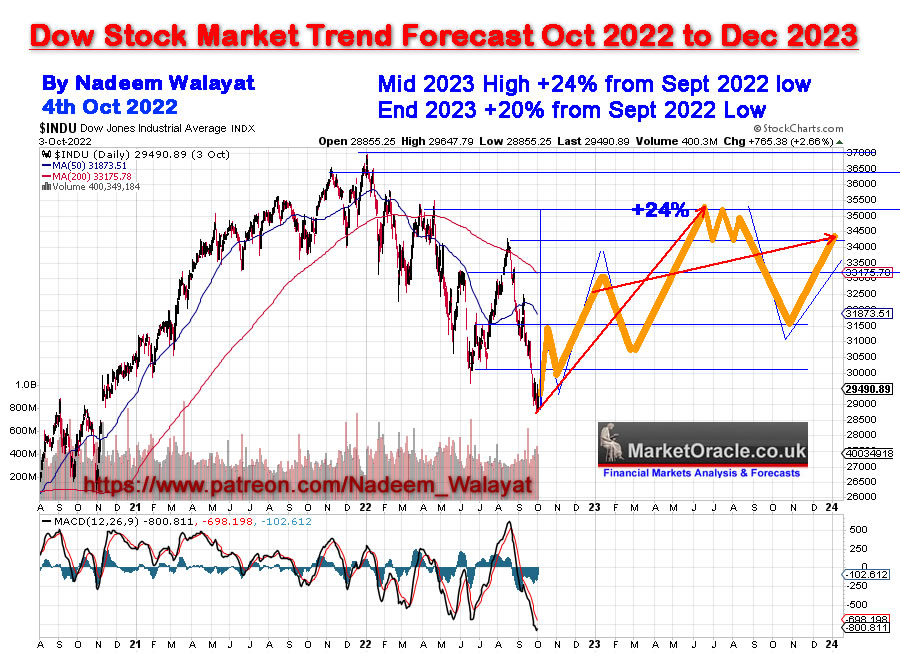
First a recap of the stock markets big picture - The trend forecast for 2023 that should see the Dow conclude the year significantly higher than it's 30th December close of 33,147, and similar for the other indices.
In terms of my trend forecast the Dow by now should be trading at approx 32,800 vs actual last close of 33,517 for a positive deviation against the trend forecast of +2% So the forecast continues to provide for an accurate road map against which to measure relative strength or weakness.
- Stocks Bear Market Max PAIN - Trend Forecast Analysis to Dec 2023 - Part1
- Stock Market Analysis and Trend Forecast Oct 2022 to Dec 2023
Despite all of the gloom and doom one is exposed to such as recession, depression, Fed determined to kill inflation with 5%, 6% even 7% rates, earnings contractions, contagion risks, all whilst the Dow is at 33,517 showing a +2% deviation against the trend forecast. Given the weight of bad news why +2% and not -10%? Is it because the Dow is about to do that which no one expects? Which is to TRADE TO NEW ALL TIME HIGHS? And if that is what transpires then what kind of seismic shock would it send to so many who have been caught badly wrong footed as they patiently wait for NEW bear market lows all whilst the Dow stealthily meandered it's way to a NEW ALL TIME HIGH!
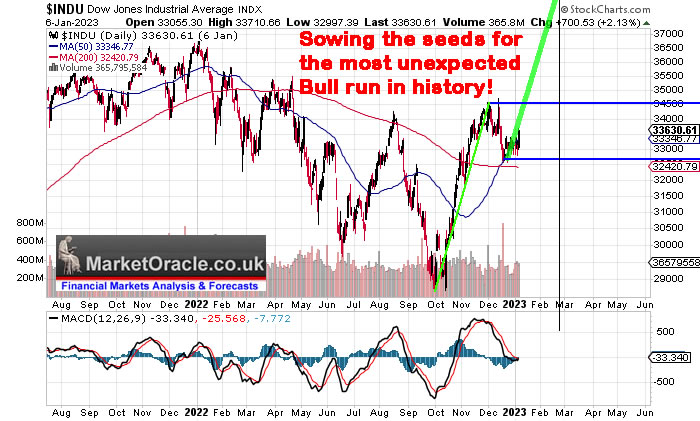
Whilst the Dow continues to show positive deviation against my trend forecast then one should take this as a warning to be prepared to expect that which no one expects - NEW ALL TIME HIGHS and thus act accordingly in by not letting oneself get infected by the perma doom merchants with their shrill cries of new lows ahead.
This article Stock Market Gasping to Reach 4000 Ahead of Earnings Season, Dow New All Time High 2023? was first made available to patrons who support my work.So for immediate first access to ALL of my analysis and trend forecasts then do consider becoming a Patron by supporting my work for just $5 per month. https://www.patreon.com/Nadeem_Walayat.
The First 5 Trading Days of the Year
If the Dow is higher for the first 5 trading days of the year then there is an 82% probability that the Dow will end the year higher with an average gain of 13.5%.
If the Dow is lower then there is an 56% probability that the Dow will end Up on the year with an average gain of 1%.
The Dow ended 2022 at 33,147 and closed Monday 9th January at 33,517, therefore the anticipated 2023 bull market has another check mark against it.
What about the S&P ? 30th Dec 2022 - 3839, Monday 9th 3892 - check.
US Presidential Election Cycle and Recessions
Apparently everyone assumes that a recession during 2023 is a done deal! However an analysis of recessions in terms of the US presidential election cycle suggests that a recession during 2023 is a very low probability event and that the actual recession may not materialise until 2024.
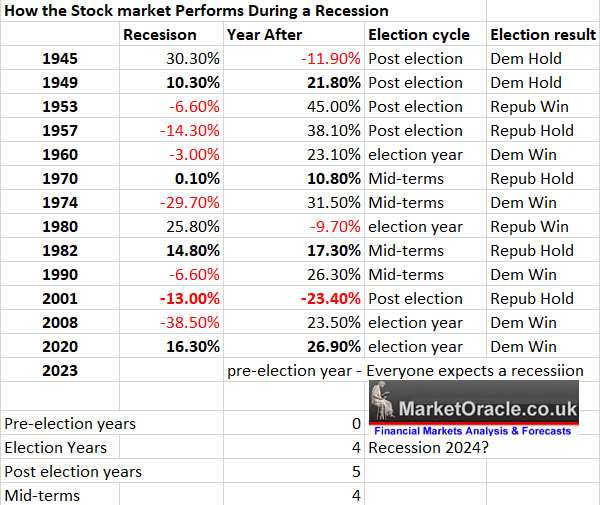
So 2023 could turn out to be economically stronger than most are imagining it to be, with weakness delayed until well into the second half of the year, thus implies to expect earnings surprises to the upside during Q1 and Q2..
S&P
Whilst the Dow has raged higher off its October low unfortunately our portfolios are far more in tune with the S&P which has under performed the Dow to significant degree. However the good news is that the S&P tends to outperform the Dow during bull markets so will catchup to and pass the Dow during 2023.
The S&P soared through 3900 running the stops sucking the S&P higher to 3953 as I flagged it would well ahead of the break higher in the comments section of the last posted article. So do check the comments section as I continue to provide patrons with my short-term view on a near daily basis as well as doing my utmost to answer patron queries. Also note, the Patreon app does not always show all of the charts so it is best to access the Patreon via a browser either from your phone, tablet or desktop PC rather than the from the ap..
The current state of the S&P as of 6pm UK time following the retracement of the whole rally back to below 3900 has the S&P perched precisely at 3900, this suggests to me that vested interests in the run up to options expiration seek the S&P to expire at 3900 so as to maximise profits on expiring options, that is there game plan.
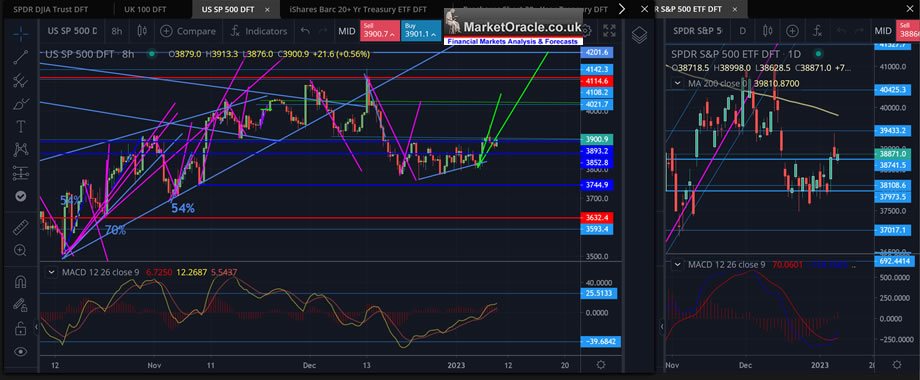
Big Image - https://www.marketoracle.co.uk/images/2023/Jan/SP-9th-A.jpg
This suggests any rally to above 4000 'should' prove short lived in the countdown to options expiration on the 20th of January. Whilst at the same time 3900 also acts as floor of sorts. Technically the S&P is primed for a bull run that at least targets 4000, for instance more often reliable than not swings analysis suggests the S&P could run to above 4050, which if it happened I would guard against over exuberance in getting carried away with the likes of 4300 as some where when the S&P blasted through 4100 early December as the window for this rally off the October lows is ending.
So whilst I still expect 4000 to be achieved, everything thus far suggests that the forecast decline set to commence around the middle of January will materialise thus I will see the likes of 4050 as a bonus for further trimming. And as my Dow analysis suggests it is possible we blast off into space, but that is NOT my base case which remains as per my October 5th concluding trend forecast.
So my game plan is to continue to trim during this rally, to exit my remaining March Call options preferably with the S&P trading above 4000 whist at the same time starting to accumulate S&P Put options most likely for June expiry. And should the S&P clear 4000 then many of the stocks will fall into shorting price zones which means I will open small covered short positions on a select handful of stocks such as Tesla, Amazon, Apple, Microsoft, Roblox etc, where should the stocks rally then I will trim to a greater extent than the size of the short positions thus resulting a net profit against the shorts, whilst also generating cash for reinvestment at lower levels if the stocks suffer deep draw downs.
So small short positions with wide stops of typically 15% that are covered by investments (long positions) should the Dow rip your face off rally materialise, thus I will end up making far greater profit on the longs then lost on the shorts. I view stock shorts more as trying to earn income during a temporary draw down, I.e. if Apple fell from $130 to $110 then exit the Apple shorts at a profit and use the funds to buy more Apple stock at $110.
Well that’s the plan, remains to be seen if it plays out as I expect it to do or not,
So in summary my base case remains in expectations for a significant Q1 correction to kick in off of S&P 4000 Mid Jan 2023, so any rally to beyond 4000 should prove short lived, probably similar to the 13th December spike high reversal.So if you are looking to trim and failed to do so during the two preceding spikes above 4000 then this is likely your third and final chance to do so.
THE POWER OF TRIMMING!
As a reminder when I see an opportunity to buy target stocks at deep discounts then I don't tend to flinch and buy the panics, the falling knives, even if takes me to well beyond my target exposure as has been the case for many stocks during the bear market of 2022 because of what will likely follow, a rally to TRIM.
The objectives is to bank profits and free up cash for future buys, as my target is to be approx 15% in cash (current 7.2%), as with many things I take trimming for granted and assume everyone does the same to some degree i.e. the more target stocks fall the more I buy with a view to engage in trimming during a subsequently rally. If you don't trim then it is something you need to adopt as part of your investment strategy as over time it does add up! Substantially for two reasons -
1. It encourages buying the dip to a deeper extent than one otherwise would, as ones objective is for the position to oscillate around 100% invested over the long-run.
2. It releases capital during subsequent rallies to enable one to buy during the following dips any target stocks that present opportunities, and thus one always has capital at had to buy which has the psychological effect of seeing declines as buying opportunities to accumulate more rather than that a falling stock price is bad, which of course it will be perceived as being so only if one has not fired all of ones bullets or already far exceeded ones target holding, where for me the real danger level is being over 150% invested of target.
To illustrate this point I opened an ISA with IBKR early April, bunged in the maximum £20k and preceded to pile into the target stocks on my list, so given since early April the Dow is down 2%, S&P down 15%, Nasdaq down 22% one would imagine a tech heavy portfolio would be down somewhere between the S&P and the Nasdaq if not worse?
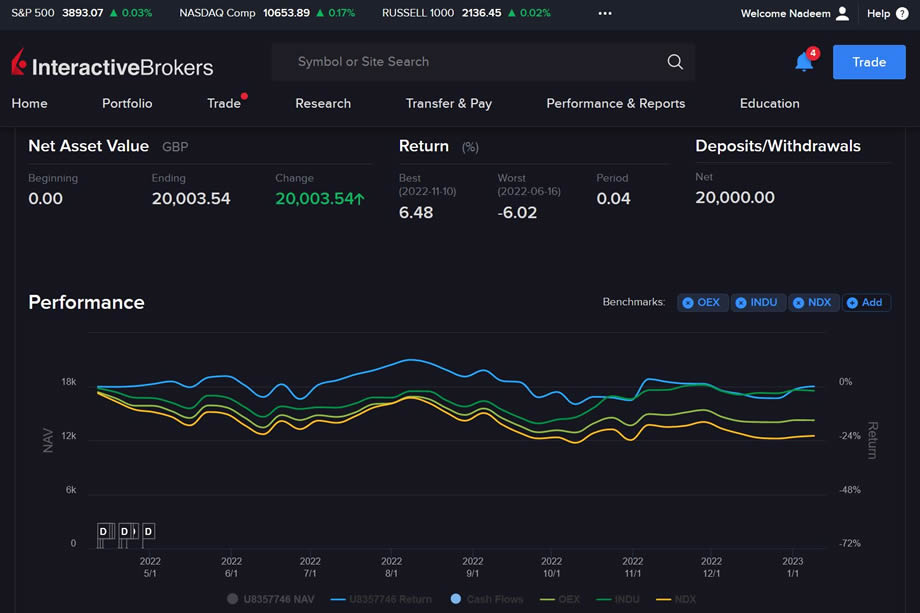
We'll the portfolio is actually FLAT since inception! Beats the Nasdaq, S&P AND DOW over the same time period. This is purely as a function of BUYING the DEEP discounts and then trimming on the rallies. The net result is that the overall portfolio stands at zero draw down which is set against any of the indices, let alone the ETF's and managed funds that only exist to line the pockets of the fund managers via their annual fees or worse as investors in the likes of ARKK are experiencing. And remember this is an ISA account so no complex trading involved such as shorting or options, just buying target stocks during the deep draw downs and then trimming on subsequent rallies, where the above portfolio currently stands at 96.5% invested, 3.5% cash, so primed for significant trimming during the current rally to rinse and repeat buying once more on the next dip. Whilst I do consider IKBR as a very good platform for trimming purposes i.e. very low commissions compared to virtually all other iSA providers, however it does have its quirks and complications which will likely be an issue for new users to get to grips with so do your own research on the pro's and cons before considering IKBR.
How to Trim?
Just as one scales into a position then one also scales out to some extent on the way up, the key difference is that one always only sells at a PROFIT. I.e. Say Google fell from 110 to 95, and I bought 10 shares each at 110, 100, and 95, then on the way up I would sell 10 at say 99, thus bank a $4 profit per share on those 10 shares, regardless of the fact that the average buying price for the 30 shares was $101.17, which on face value would seem like I sold at a loss but in reality I bought 10 shares for $95 and sold 10 for $99, and that is how I trim. free up capital to perhaps re buy Google at $95 again or lower given that one has more information than what one had when one originally bought Google at $95, the net result is no change in my portfolio i.,e. It would still show I own 30 shares however now if the platform is worth anything it 'should adjust for a lower average buying price, I though I prefer to do my own calc's in Excel.
So over time the average buying price goes down even if the stock goes nowhere, all whilst one always maintains a healthy amount of free cash on account without which one cannot buy any dips!
Another effect of actively trimming is that one is predisposed to pull the trigger and SELL a large chunk of ones portfolio in times of brewing uncertainty, as I noticed that during the second half of 2021 many patrons did not want to hear the likes of a brewing financial crisis, out of control inflation, and an impending valuation reset to at that time to a target of X20 earnings which seemed far fetched when the likes of AMD was trading on X60, Nvidia X90 etc. Clearly without any practice of actually SELLING then one is reluctant to do something that one is not practiced in this at the very least trimming and buying the dip develop experience in doing so otherwise many will find themselves reluctant to act. Which is why I sold 80% of my tech stocks portfolio BEFORE the end of 2021.
My portfolio current state 92.2% invested, 7.8% cash, my objective is to trim holdings to raise the cash percentage to at least 10% which would thus allow me to better capitalise upon any decline. I recently updated the Trend status column which indicates that most stocks have either bottomed or are bottoming. In terms of which stocks are in their buying zones - Google, AMD, META, Amazon, SMT, GPN, ADSK, CRPR. of these probably GPN, ADSK and CRSPR would perk my interest the most were I inclined to accumulate right now.
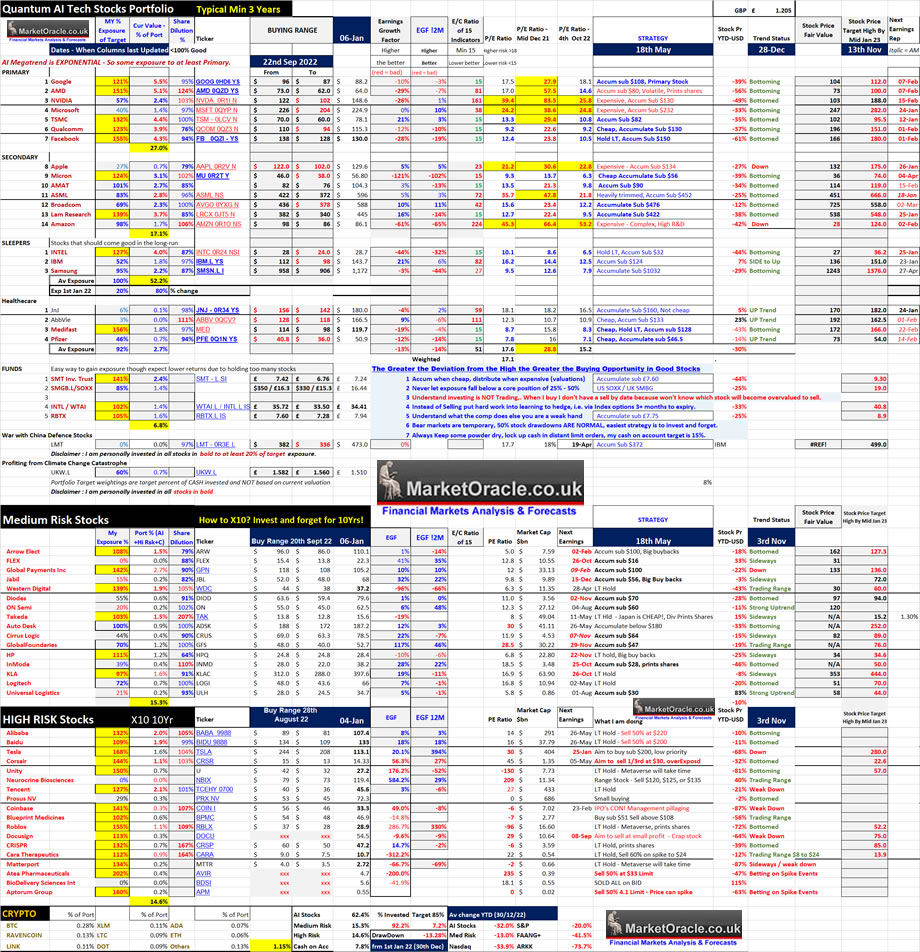
Table Big Image - https://www.marketoracle.co.uk/images/2023/Jan/AI-stocks-Big.jpg
So far only limited trimming in ASML, Micron, AVGO, KLAC, LOGI.
My current trimming ranges for most AI tech stocks are -
Google $101 to $122
AMD $78 to $110.
Nvidia $174 to $195
MSFT $261 to $292
TSMC $81.6 to $109
Qualcom $118 to $132
META $168 to $199 - Unlikely to trim any META.
Micron $57.2 to $74
AMAT $111 to $138
ASML $599 to $666
AVGO $576 to $631
LRCX $484to $533
Amazon $101 to $120
Intel $35 to $44
IBM $150 to $160
MED $155 to $192
Pfizer $53 to $57
Medium Risk Stocks
Arrow- $115 to $129
GPN - $117 to $135
HPQ $34.6 to $40
KLAC $414 to $436
Logitec $66 to $78
WDC $44 to $50
DIODE $90 to $98
ADSK $210 to $233
CRUS $85.5 to $95
GFS $67 to $78
INMODE $43 to $50
ULH $44 to $44
High Risk
CRSR $25 to $30
Tesla $156 to $196
Roblox $38 to $52
U $40 to $58
THE METAVERSE MEGA-TREND
After descending into the depths of hell the META Stock price is coming alive as that which the herd pundits dismiss as a gimmick is starting to gain traction, the METAVERSE, they will only get it when they see META trade to new all time highs, gaming is where it is right now and what most focus on but that is a mere pinprick of what the Metaverse will herald, realistic computer generated worlds in real time. One aspect of the Metaverse that most completely miss is GAME PLAYING! Not playing games but GAME PLAYING where one plays out scenarios in the metaverse of what one should do in the real world a multitude of times to fine tune ones actions in the real world, and what's more the game playing is compressed in time, i.e. learning to fly a plane well be infinitely quicker in the metaverse than the real world as there is no down time or limits to flight time, yes there are already expensive simulators but all one needs is a good high resolution headset, say the Quest 3 later this year or Quest 4 in 2 or 3 years time and we will be off to the races and META has a head start on the rest.
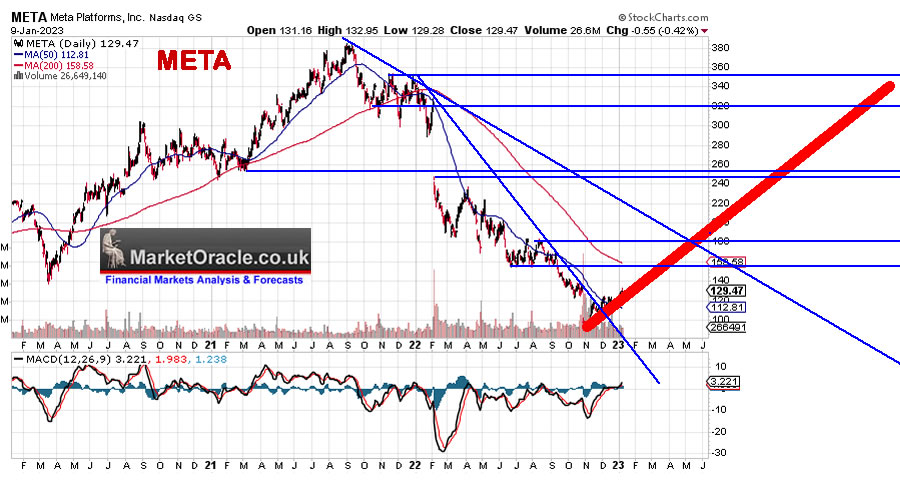
Those who deride META today will be scrambling to buy it as trades through $300 eventually propelling META to a new all time high. And META is just one of a basket of metaverse stocks that include the likes of Roblox (155% invested) that populate my portfolio with many of the tech giants already core Metaverse stocks, actively working on their own virtual worlds, in fact I would consider Nvidia more of a metaverse stock than what META is right now given the role it's GPU's play and the Omniverse, none of which is apparent from so called analysts on the likes of CNBC. Microsoft, Apple, all of the tech giants are gravitating towards the metaverse. In fact those stocks most exposed to the metaverse are currently outperforming the market.
The Metaverse IS a MEGA-TREND! that my portfolios by design give strong exposure to Virtual / Augmented Realities as a significant derivative of the AI Mega-trend, where Gaming leads the way given that games render virtual worlds in REAL TIME, which is probably closer to reality than most imagine it to be i.e. we may discover in the not to distant future that our reality is also being rendered.
Get Ready for the GREAT DISINFLATION / DEFLATION CON of 2023.
US CPILIE smoke and mirrors inflation rate has peaked and will head sharply lower during 2023 that will sow the seeds for the next spike higher to 10% during 2025.
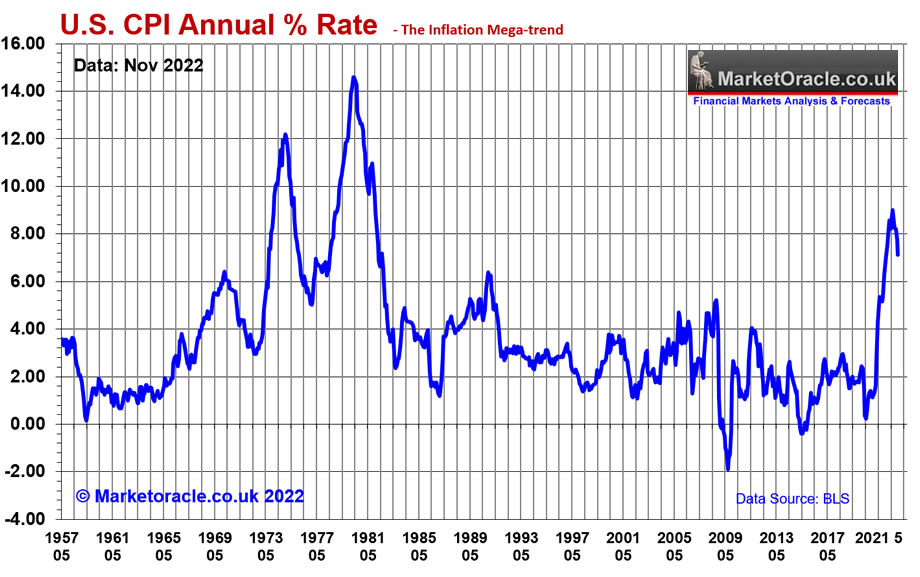
However once more understand that the disinflation / deflation debate that will soon rage amongst the talking heads during 2023 and into 2024 is a load of codswallop for the fundamental fact that Inflation is COMPOUNDING! And thus the Inflation of the 2020's will resemble that of the 1970's, a HUGE Inflation spike that will deliver a great deal of pain that most are totally unprepared for which will sow much civil unrest amongst the masses, rioting, looting and burning of commercial districts.
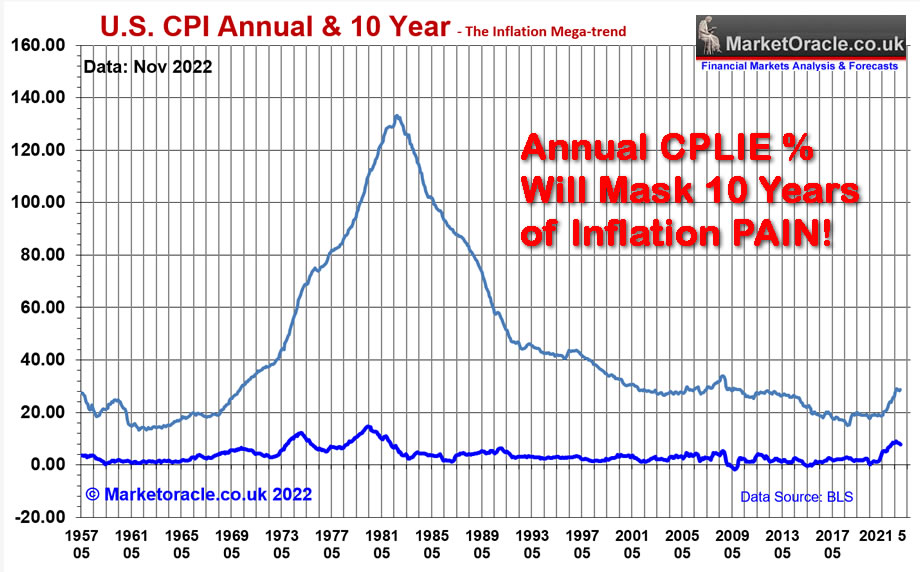
All whilst clueless economists will bang on about how the Fed has succeeded in bringing inflation under control, economics is not a science it is a PROPAGANDA tool to fool the masses into accepting the inflation stealth theft of purchasing power of earnings and savings, that has led to today's families with both partners working flat out full time unable match the single worker nuclear families of the past, INFLATION that's why! CPLIE! - Real inflation is DOUBLE CPLIE and THEN we have the annual rate of CPLIE con trick! as if CPLIE falling from 8% to 2% is any sort of victory! Instead it masks the damage that has already been done that compounds EVERY MONTH!
The inflation indices are masking the reality of the inflation pain and then we have the deflation garbage that spews out of the mouths of fools such as Cathy Woods and hundreds more! Against which even the great deflation of the Financial Crisis is merely a ripple on the ocean of Inflation.
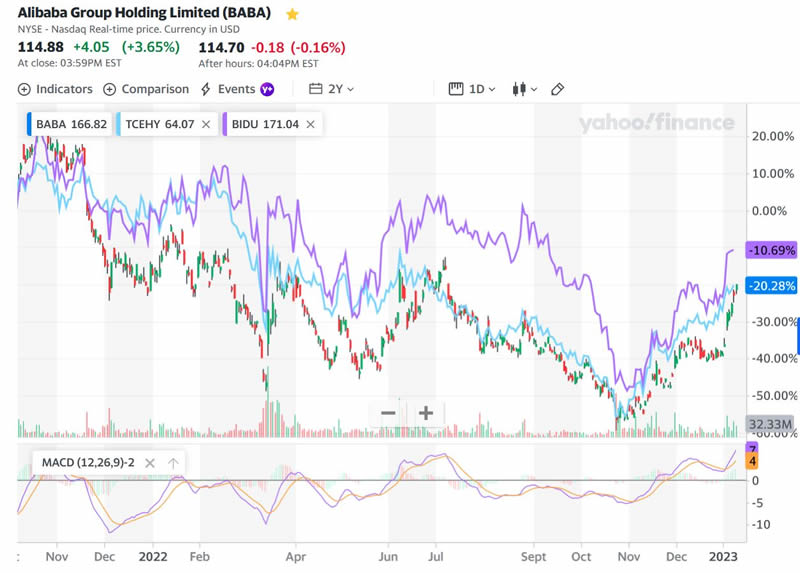
China Reopens
What does this mean? It means chinese stocks are now in a BULL MARKET! All those draw downs in the likes of Tencent and Alibaba are going to VANISH! My Bidu draw down has already vanished as the chart illustrates Chinese stocks HAVE BOTTOMED! I am 132% invested in Alibaba, Baidu 109% invested, Tencent 127% invested and in addition to those I hold chunk of FXC.L, so I am ready for the Chinese Dragon to deliver NEW ALL TIME HIGHS over the coming years.
This article Stock Market Gasping to Reach 4000 Ahead of Earnings Season, Dow New All Time High 2023? was first made available to patrons who support my work.So for immediate first access to ALL of my analysis and trend forecasts then do consider becoming a Patron by supporting my work for just $5 per month. https://www.patreon.com/Nadeem_Walayat.
For first access to ahead of the curve analysis as my extensive analysis of the stock market illustrates (Stocks Bear Market Max PAIN - Trend Forecast Analysis to Dec 2023 - Part1), that continues on in the comments section of each posted article, all for just 5 bucks per month which is nothing, if you can't afford 5 bucks for month then what you doing reading this article, 5 bucks is nothing, if someone did what I am doing then I would gladly pay 5 bucks for it! Signup for 1 month for a taste of the depth of analysis that cannot be beat by those charging $100+ per month! I am too cheap! I am keeping my analysis accessible to all, those willing to learn because where investing is concerned the sooner one gets going the better as portfolios compound over time, $5 month is nothing for what you get access to so at least give it a try, read the comments, see the depth of analysis, you won't be sorry because i do do my best by my patrons, go the extra mile.
And gain access to the following most recent analysis -
- Stock Market Counting Down to Pump and Dump US CPI LIE Inflation Data Release
- Stock Market Completes Phase Transition, US Real Estate Stocks - Housing Market Part1
- Stock Market Rally Slams into Q4 Earnings Season
- Stock Market Gasping to Reach 4000 Ahead of Earnings Season, Dow New All Time High 2023?
- S&P500, Gold, Silver and Crypto's Trend Forecasts 2023
- Stocks Analysis Bonanza - GOOG, QCOM, ASML, TCHEY, BABA, BIDU, TSLA, WDC, RBLX, MGNI, COIN, BITCOIN CAPITULATION!
- Stocks Bear Market Max PAIN - Trend Forecast Analysis to Dec 2023 - Part1
- Stock Market Analysis and Trend Forecast Oct 2022 to Dec 2023 - Part 2
So for immediate first access to to all of my analysis and trend forecasts then do consider becoming a Patron by supporting my work for just $5 per month. https://www.patreon.com/Nadeem_Walayat.
My Main Analysis Schedule:
- US House Prices Trend Forecast - 50%
- Global Housing / Investing Markets - 50%
- US Dollar / British Pound Trend Forecasts - 0%
- High Risk Stocks Update - Health / Biotech Focus - 0%
- State of the Crypto Markets
- Gold and Silver Analysis - 0%
- How to Get Rich - 75%

And ensure you are subscribed to my ALWAYS FREE newsletter for my next in-depth analysis.
Your trimming the rally analyst.
By Nadeem Walayat
Copyright © 2005-2022 Marketoracle.co.uk (Market Oracle Ltd). All rights reserved.
Nadeem Walayat has over 30 years experience of trading derivatives, portfolio management and analysing the financial markets, including one of few who both anticipated and Beat the 1987 Crash. Nadeem's forward looking analysis focuses on UK inflation, economy, interest rates and housing market. He is the author of five ebook's in the The Inflation Mega-Trend and Stocks Stealth Bull Market series that can be downloaded for Free.


 Nadeem is the Editor of The Market Oracle, a FREE Daily Financial Markets Analysis & Forecasting online publication that presents in-depth analysis from over 1000 experienced analysts on a range of views of the probable direction of the financial markets, thus enabling our readers to arrive at an informed opinion on future market direction. http://www.marketoracle.co.uk
Disclaimer: The above is a matter of opinion provided for general information purposes only and is not intended as investment advice. Information and analysis above are derived from sources and utilising methods believed to be reliable, but we cannot accept responsibility for any trading losses you may incur as a result of this analysis. Individuals should consult with their personal financial advisors before engaging in any trading activities.
Nadeem Walayat Archive |
© 2005-2022 http://www.MarketOracle.co.uk - The Market Oracle is a FREE Daily Financial Markets Analysis & Forecasting online publication.