


Stock Market Completes Phase Transition, US Real Estate Stocks - Housing Market Part1
Stock-Markets / Stock Market 2023 Mar 21, 2023 - 10:15 PM GMTBy: Nadeem_Walayat

Virtually everyone was open jawed last week as to why the hell are stock prices soaring on BAD EARNINGS reports and yes regardless of how the headless chickens on the cartoon network (CNBC) were reacting in trying to explain the price action they were BAD EARNINGS reports as flagged by the EGF's which had zero impact on stock prices that instead of plunging soared into the stratosphere, why? It's because earnings reports are looking in the rear view mirror at what has already happened which is why one needs to be aware of current EGF and future EGF as well as current P/E relative to the high-low P/E range for each stock as shown in my AI stocks table. Our perception of time is not linear as we flit from the past (memories) into the future (forecasts, hopes and dreams) and back into the present, in a constant state of flux and so it is for all market participants which is the true nature of the markets, everything, everywhere all at once.

Which is why many get the markets so badly wrong because they get fixated on the past, by analogs of what happened in 1972, or 1982, or 1992 or 2002 and so on just as the analog breaks down, to truly understand the markets then one has to become a time traveler, flitting between the past and future through the present which is why when I hear garbage such as "I don't predict the future when I buy stocks" I shake my head as it is a load of bollox! Of course you are predicting a positive outcome for your trade i.e target price! That IS a PREDICTION! Looking into the future!
This analysis Stock Market Completes Phase Transition, US Real Estate Stocks - Housing Market Part1 was first made available to patrons who support my work.So for immediate first access to ALL of my analysis and trend forecasts then do consider becoming a Patron by supporting my work for just $5 per month. https://www.patreon.com/Nadeem_Walayat.
So become time travelers by understanding that the past and the future only exist in the present! It's how the impossible happens, Brexit, Trump, Russian Invasion, Bull Market.... And the reason why humans ARE time travelers is because of Language, probably the greatest evolutionary leap was to be able to look into the past and future through the use of Language, Language is TIME! Without it we are just hairless Apes, with it we are Time Lords!
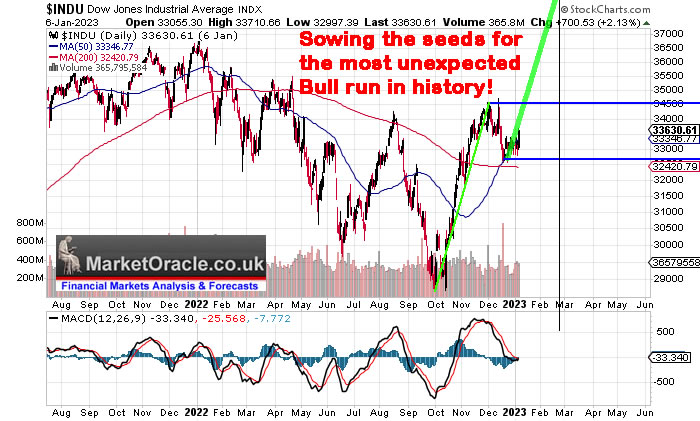
The stock market has effectively completed it's phase transition from Bear to Bull that began going into the June 2022 low, reached it's max critical point during the October sell off that marked the birth of the embryonic bull market that since has continued to set milestone after milestone with each passing month all up until the point of the weeks impossible rally that literally no one was expecting, as I have repeatedly warned was the primary risk to expectations for a correction which IS to the UPSIDE. When looking at the price charts one often forgets that the the prices are the sum of the actions and positions of all market participants who at the time of their actions had a set view on expected market price action that they are then working towards and it is subsequent price action that either reinforces or weakness that view. However systems do not operate smoothly instead have critical points which where the markets are concerned are centered around the likes of the CPI report, FOMC Rate Decision, Fed Chairman's speech and so on. And so it was the case this past week where in reality it did not matter what the Fed did 0.25% or 0.5%, or even if Jerome Powell recited Ba Ba Black Sheep have you any wool, Wednesday's Fed meeting was a criticality point that the markets were centered around, a point at which the SYSTEM TAKES ACTION. This is the true nature of reality folks, all systems are balanced at criticality points waiting to ACT, even the way you think, your brain is a collection of criticality points at which you will decide to act. With the markets it is PANIC BUYING or PANIC SELLING, This week we had PANIC BIUYING, gone out of the window were the 'constructs' that had convinced most of the view to expect new bear market lows, in steps the criticality point of the Fed meeting that prompts ACTION! And so market participants ACTED to send stocks soaring! META up an unheard of 23^% after hours following it's results.
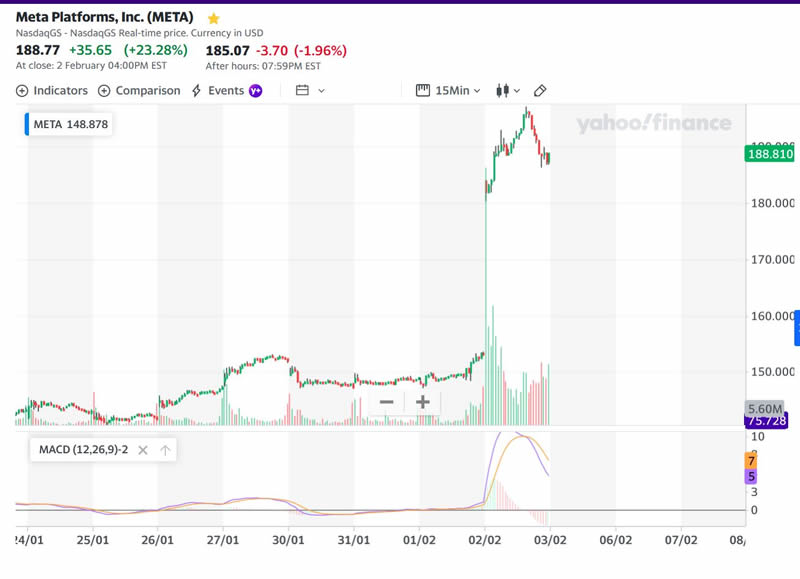
Yes it's easy after the fact to look for reasons why META soared, but it is what it has been for the duration of the bear market, a good stock that was hated by Wall Street because they don't get the METAverse as they invested in a social media stock but instead find Zuckerberg rambling on about something few actually understand the nature of. I do use the Quest headset but not any of META's products such as Horizon world, I use it more in terms of developmental work that will probably never actually pan out into a revenue stream but what it does do is give me knowledge of what the metaverse actually is and what it is set to become, the go to place for running simulations, the Star Trek holodec! It will be as big a change as what the internet and Google Search were! Currently Google is the go to place for answers to questions, despite GPT noise. The Metaverse will be the go to place to run simulations before one acts in the real world, in fact it's already happening in many industries and there will be many flavours of the Metaverse such as Nvidia's Omniverse. In fact META has just done what it does best which is to BUY other companies and then capitalise on them, because basically META sucks at innovation but is good at spotting other companies with potential and buy them as it just did by buying a $400 million VR company.
The bottom line is META WILL trade to new all time highs and many will look back and wonder why they did not buy when the stock was trading down to UNDER $100! It is because it is not easy to buy stocks when they are dirt cheap unless one has a plan, already has a list of target stocks to buy and BUY THEM WHEN CHEAP! BUY THEM WHEN BLOOD IS POURING OUT OF ONES EYES at the draw downs they are generating! BUY THEM when MSM are SAYIING they are now DEAD stocks! As clown Cramer was saying during October, DO NOT BUY TECH STOCKS this clown was spouting as I and hopefully many patrons were catching the many falling knives during Octobers bloodbath, Clown Cramer on the CNBC Cartoon network was stating that the tech stocks were finished, META was finished at $100 per share! When it WAS the mother of all buying opps! CNBC IS the CARTOON NETWORK!
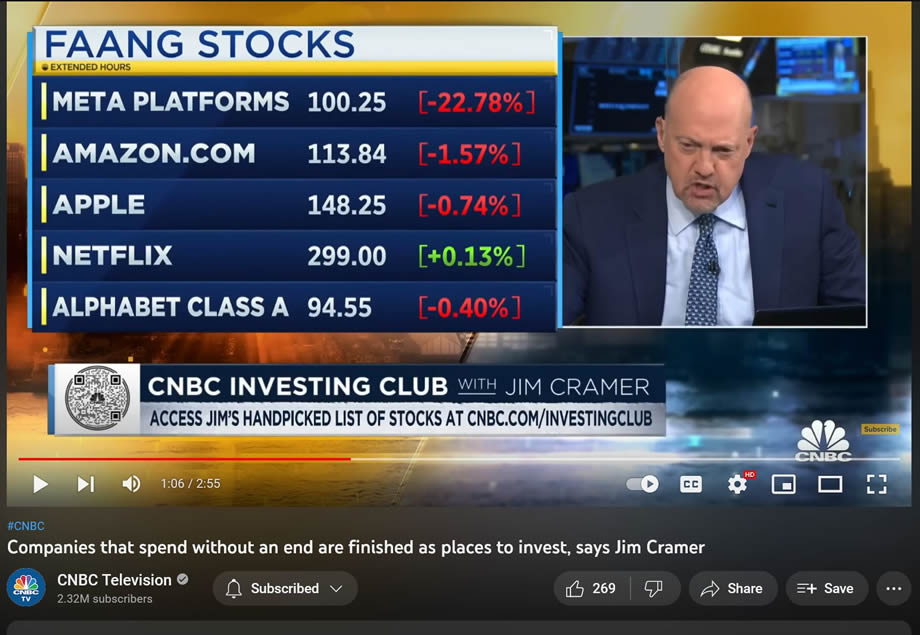
Watch the clown - https://youtu.be/ZUDoDjhuvFU?t=61
And for the life of my I do not understand why so many obsess over Bury and his tweets for if actually they followed this one trick pony then they would ALL be broke by now!
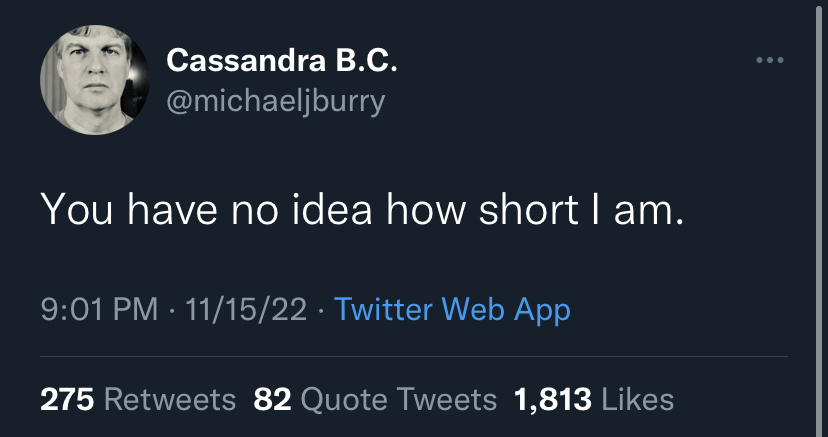
That was like S&P 300 points ago, so I guess Burry's next tweet should be "You have no idea how broke I am."
Current State of the Bull Market
The Dow closed Friday at 33,929 vs the trend forecast road map of 32,000, so the Dow continues to show a strong positive deviation against the forecast that confirms 2023 is going to be an epic year for stocks.
- Stocks Bear Market Max PAIN - Trend Forecast Analysis to Dec 2023 - Part1
- Stock Market Analysis and Trend Forecast Oct 2022 to Dec 2023
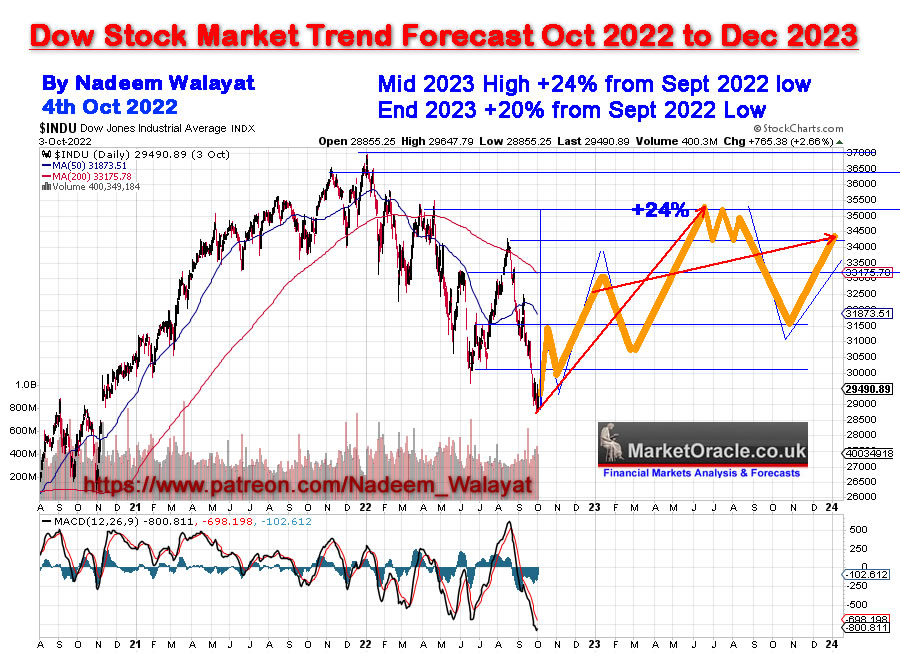
Stocks Bull Market milestones SINCE my forecast road map was posted early October -
1. Higher high above 34,300 - check
2. Santa rally - check
3. Up first 5 days of January - check
4. 50day SMA cross above 200 day - check
5. January Up Close - Check
6. Higher High - Check 34.7k
7. Higher low - pending.
8. 200 Day SMA Turning UP - Pending
9. .....
So the Dow so far continues to confirm my trend forecast that expects the pre-election year of the Presidential cycle to deliver a strong bull run which given the positive deviation could even see the Dow trade to a new all time high this year!
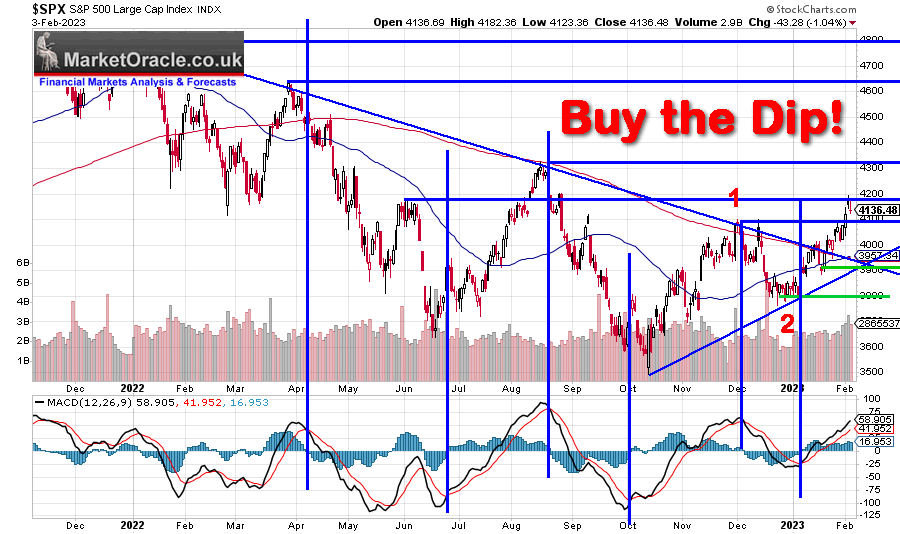
S&P Bull Market MIlestones
1. Higher high above 4100 - check
2. Santa rally - check
3. Up first 5 days of January - check
4. 50day SMA cross above 200 day - check
5. January Up Close - Check
6. Higher Major Low - Check 3765
7. 200 Day SMA Turning UP - Pending
(Charts courtesy of stockcharts.com)
The S&P and Dow have now switched places for a much stronger S&P then the Dow as I warned would happen that the S&P would play catchup, as now both have 6 bull market milestones under their belt and I expect the S&P to continue to outperform the Dow. Yet the perma clueless continue to cling onto fantasy expectations that the S&P will somehow magically drop to 3200 so they can buy at the low despite the fact that the gravy trains have long since departed station!

Take a closer look at the S&P chart, notice that the current rally is not off a BEAR MARKET LOW thus Check mark number 6. How many check marks do people need to see that we are in a BULL MARKET, 1,2,3,4,5,6,? Given the move whilst the bear herd clings onto hopes of S&P 3400 and lower then I think these fools will see 7,8,9,10 NEW ALL TIME HIGHS and STILL REMAIN BEARISH as they seek any snippet of MSM noise to suggest lower prices are coming "S&P new all time high now makes the market ripe for a HUGE CRASH" yadayadayada.
The current state of play is that we await the correction proper to commence, technically the market is overbought, though as the 15 month chart illustrates the sell signals that might look huge on the hourly chart are invisible on the daily chart. Stock market short-term is overbought and should correct, I AM positioned for a correction via OPTIONS! Too cowardly to short the bull with futures as if I had I would have been stopped out by now! So if one wants to play the correction then it has to be PUT options, at least with options one has a fighting chance to ride out the FOMO as I have been warning since the start of the year that the risks are to the UPSIDE.
"What about the risks to this scenario? We are in a BULL MARKET so the risks are to the UPSIDE, one of an explosive rally as fund managers who have badly gotten the market wrong panic buy propelling the Stock market driven by FOMO rather than reasoned analysis to far higher than the likes of TA can conjure through lines on a chart as I warned in my last article."
The bottom line is we are now well into the window for a correction. where the intraday charts have triggered a minor sell Friday. in terms of targets for the 'correction', first 3900 and then 3820, which is pretty much the same as my last article (3800), so we should at least see 3900 by which time there will be enough price action to confirm if the correction can manage to follow through to its target of 3800 or not which remains my base case.
AI Stocks Portfolio Earnings Season - Buy the Rumour Sell the News Week 2
AI stocks soared into the stratosphere despite BAD earnings reports as I flagged ahead of time by the EGF's which proved accurate even if the stock prices ignored the reports for a few days at least as panic stop loss buying gripped the market killing the bears on Thursdays Open. Looking at the fundamentals then most stocks having become expensive courtesy of the FOMO rally and contracting earnings, for instanced Google and AMD are back trading in the PE mid 20's so definitely not what one would class as being cheap. Updated EGF's paint a picture for another negative quarter ahead. However beyond that blue sky's appear to be forming, so Q3 and Q4 could deliver upside earnings surprises. Looking at all of the stocks the only one that sticks out as a BUY is Broadcom with it's low PE and positive EGF's, everything else carries a downside risk to varying degree though ASML, Microsoft, Apple and AMAT are well supported, whilst the rest are going to be very volatile. So expect 1 more quarter of bad earnings before the worst of the earnings pain is behind us. However don't take this as a cue to expect a sharp drop in stock prices as the current earnings season illustrates that markets can IGNORE bad earnings reports as being OLD NEWS and look to future quarters which are positive for most stocks.
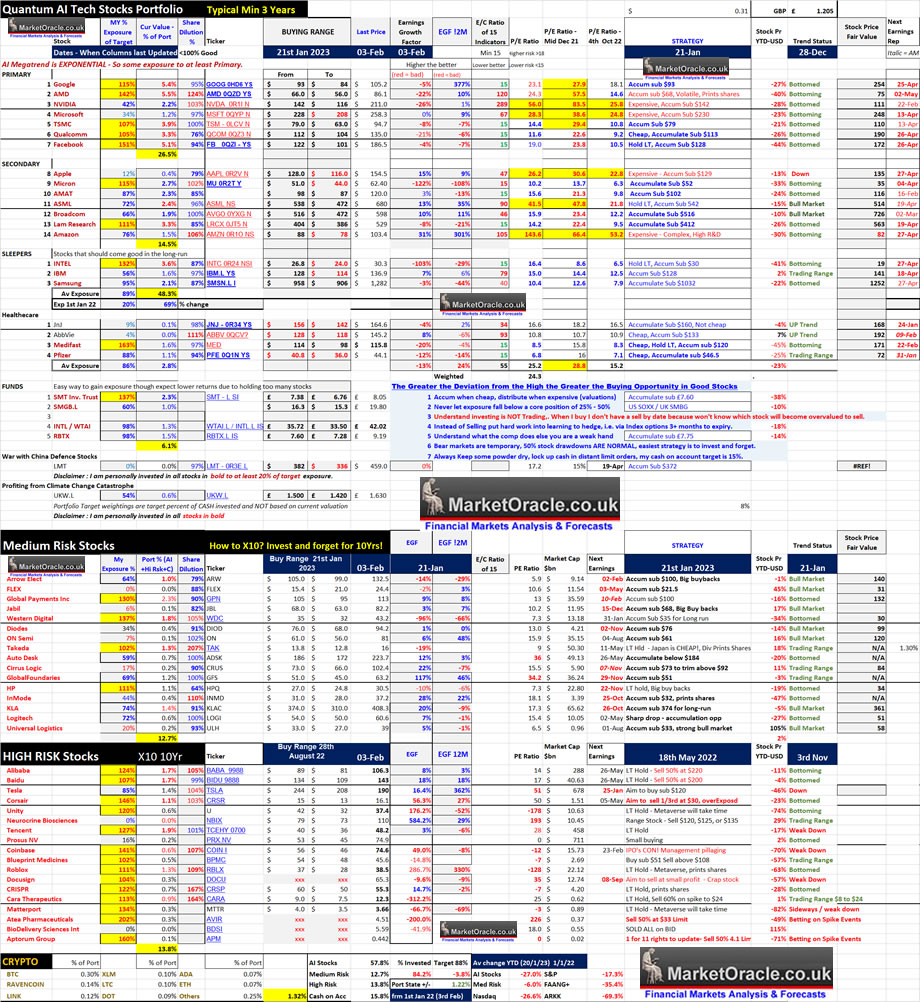
Table Big Image - https://www.marketoracle.co.uk/images/2023/Feb/AI-stocks-3-big.jpg
After heavy across the board trimming going into the FOMO highs my portfolio currently stands at 84.2% invested, 15.8% cash, Higher risk stocks heavily trimmed were Arrow, Jabil, ADSK, CRUS and KLA, and I halved my position in Tesla, so I am content either way if it continues to rocket higher towards $300 for more trimming or plunges back towards $130 to reaccumulate where I see a trend towards $130 as being more probable.
Whilst I am most eager to re accumulate into Broadcom and ASML. Also IBM will perk my interest sub $128 as well as reaccumulating into the higher risk stocks should they plunge. On the buy front I have been accumulating Pfizer on it's covid vaccines bad news plunge where my position has now doubled to 88% invested, and in US housing stocks to a limited extent.
AI stocks Table explained
The fundamentals for stocks CHANGE to varying degree following each earnings report, hence volatile price action around earnings reports so one needs to keep upto speed on both the direction of travel and changes in the companies fundamentals.
P/E Ratio - The starting point is the the P/E ratio which is calculated by dividing the share price by the sum of the last 4 reported quarterly earnings per share which is readily available, though different sites use GAAP or non GAAP EPS, my preference is for non GAAP. Higher the PE the more expensive a stock, so the simple aim is to buy stocks for as low a PE as possible, but on it's own the PE is very limited.
Buying Range - High probability range for stocks to trade within to accumulate, where what one buys at what level is determined by ones existing exposure i.e. if one has no exposure then one would accumulate towards the top of the range and then scale in should prices continue to decline down towards the bottom of the range.
Earnings Growth Factor (EGF) - Gives an indication of the direction of travel of earnings where the higher the positive percentage the better. Whilst a negative EGF warns of contracting earnings which should command a LOW P/E ratio to justify accumulation. EGF is calculated by dividing share price by latest EPS X4 then divided by current P/E ratio -1 for example (1X4)=4, 100/4 = 25, if current P/E 30, thus 30/25-1 = EGF +20%.
E/C Ratio - A formulae encompassing 15 inputs such as Price to Book, Price to Sales, P/E etc to better determine which stocks are cheap or expensive in relative terms where 15 is the minimum reading.
EGF12M - Similar to the EGF, however instead of the current quarter EPS X4 I am,using my own estimated EPS for the next 12 months to arrive at the EGF12M percent, as an indication of how strongly a stocks earnings could grow over the next 12 months.
Stock Price Fair Value - Based on the current PE ratio divided by the fair value PE ./ Ratio which is usually 18 for most stocks that is adjusted by the 12M EGF. So one wants to buy a stock for as below fair value as possible, whilst buying above the fair value one is over paying to some degree for exposure to a stock. Note it is not a price target but an indicator of how cheap a stock price is compared to future earnings expectations.
MY % Exposure - Is how much I have invested in a stock as percent of the target amount i.e. if my target for a stock is £10k, and I have invested £5k then the exposure is 50%.
Port % (AI +Hi Risk+Cash) - My holding in each stock as a percent of AI stocks + High + Med Risk stocks + Cash on account. So basically my public portfolio.
Share Dilution - the degree to which a company either prints shares (over 100%) or buy backs shares (under 100%). This metric is more important when the EGF is low or negative, i.e. AMD is weak because of negative EGF and high share dilution.
Trimming - Reducing exposure on rallies when stocks reach an overbought state i.e. cashing in profits, with a view to reaccumulating on the next dip which acts to drive the average price paid per share down. The degree of trimming depends on ones exposure and the degree to which a stock has become over valued. However the primary goal remains to retain adequate exposure so as to capitalise on the AI mega-trend over the long-run, thus in most cases trimming should prove to be a marginal exercise. The aim is to have ones portfolio balanced in such a state where one is content with the stock prices either soaring for trimming or plunging for further accumulation.
US Housing Stocks - US Housing Market Analysis PART 1
The only way I am going to be able to get the US housing market mega analysis done and dusted is if I break it up into digestible chunks, hence it will be delivered in 3 parts -
1. US Housing Stocks and Implications for House Prices
2. US Economy Implications for House Prices.
3. US House Prices Analysis and concluding 3 year trend forecast.
Why housing stocks first and not last?
Because stocks tend to move ahead of house prices, first to fall and first to rise, that and I need to have some skin in the game else inability to focus on the US housing market to the extent required to give it my best so as to ensure I MAKE money rather than LOSE money, and so US housing stocks come FIRST.
US House Prices Current State
My interim view as of early July 2022 based mainly on my stock market, economy and UK housing market analysis at the time (Stocks Bear Market Rally Last Gasp Before Earnings Season, US House Prices 3 Year Probability Range) concluded in an rough expectation for US house prices to target a gain of between 20% and 30% over the next 3 years that would be punctuated by a correction during 2023.
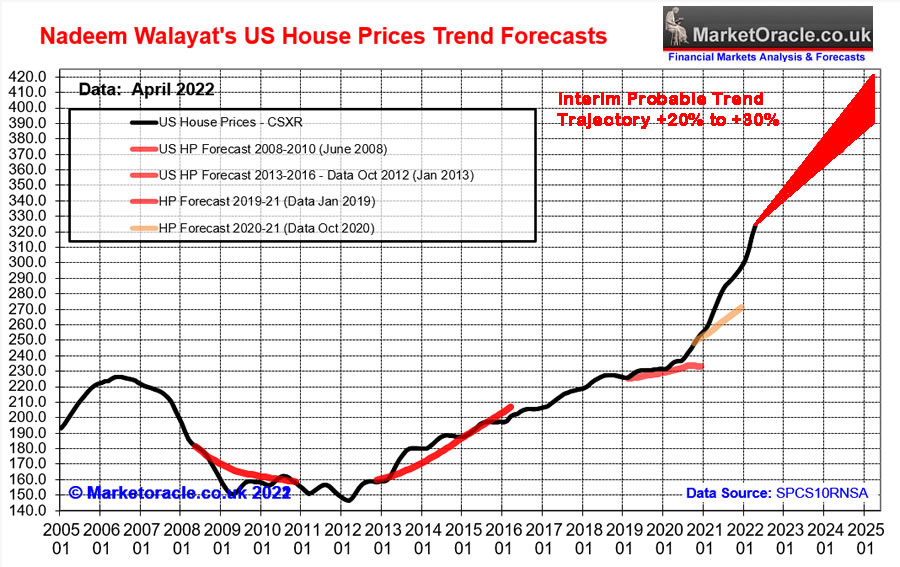
The latest Case Shiller 10 city index for November 2022 is 313, down form a peak of 330 in June 2022 (remember there is a 2 month lag in reporting of data). Thus US house prices have corrected by 5% from their highs though still positive on an 12 month basis at +6.3% which isn't anywhere near the shrill cries of the doom merchants such as Michael Burry of Mid 2022.
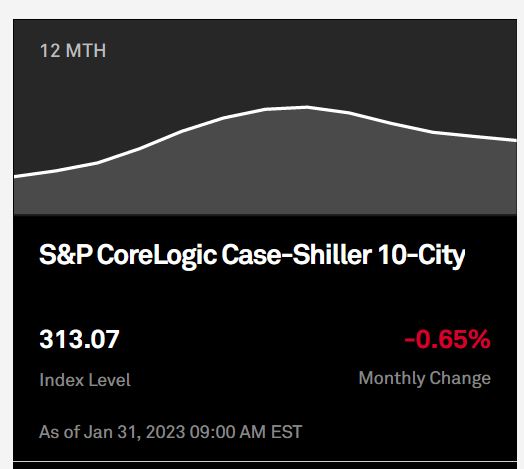
And given the background of soaring mortgage interest rates and contracting corporate earnings coupled with the inflationary cost of living crisis then +6.4% over the past 12 months is a sign of relative strength that suggests that yes US house prices whilst weak during 2023 are not going to fall off a cliff as many prospective buyers hope they will, after all the so called recession saw the US economy add 517,000 jobs last month, more than double market expectations! Thus the correction looks set to mild and prove temporary with prices set to resume their bull and likely to trade at new all time highs during 2024.
US Housing Stocks Mini Portfolio
Where housing stocks are concerned the more bad news the better which is the mistake most investors make when seeking good news to buy, countless times I get asked why am I buying x,y,z, stock when the news is so bad! We'll how else do you think you are going to get the stocks to trade down to a cheap prices? Not when the news is GOOD! You want the news to be BAD, DIRE, disastrous even because that is when one gets the greatest buying opps! It's why during October I looked like a porcupine given all the falling knives that I had tried to catch, which included a few US housing stocks though to very limited extent, pinprick exposures so as to get give me some skin in the game towards focusing on the US housing market.
When most consider investing in US housing stocks then the go to stock at the top of every list is D R Horton which despite it's bull run trades on a PE of just 6.1 so not expensive even if earnings contract over the coming quarters.
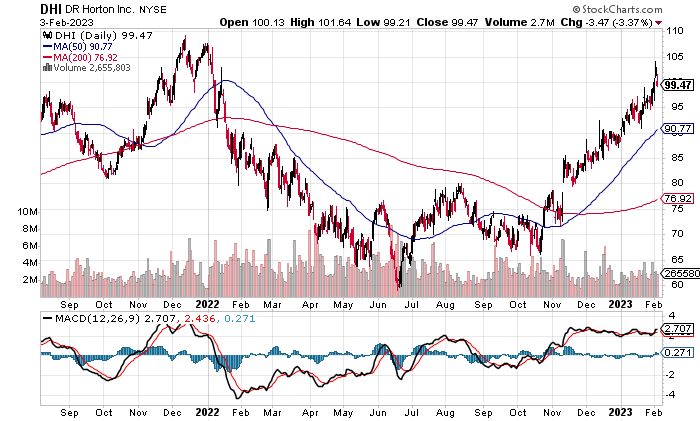
Clearly DR Horton is in a bull market, it's definitely not a 2007-2008 style housing collapse! In fact the exact opposite is true!
In terms of investing this ship has largely sailed, the time to invest would have been when I first posted my preliminary view on the US housing market when the stock was trading at around $65, $99 is a 50% advance which puts the stock about 10% away from it's all time high, it's too late! But don't worry there are plenty more opps out there that have yet to set sail.
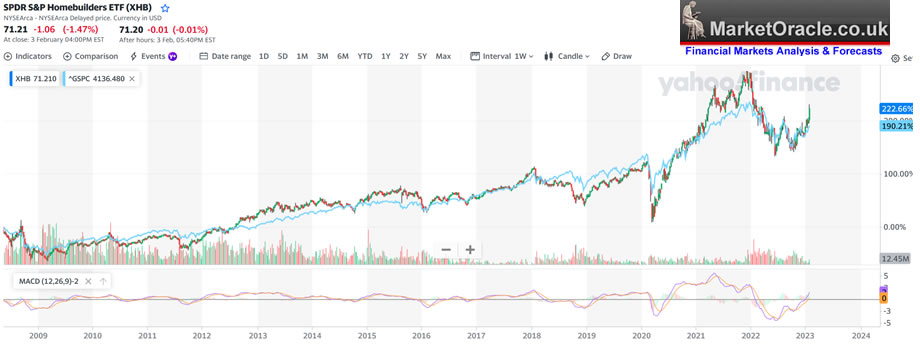
XHB - SPDR S&P Homebuilders ETF
Most investors play it safe with likes of the XHB SPDR Home Builders ETF that includes the likes of DR Horton (4%). Even though such funds are not my cup of tea, i.e. you have no chance of X10'ng with XHB, nevertheless promises to deliver exposure to the US housing market. Unfortunately in terms of trend looks like an S&P tracker. So I will also give XHB a miss as I don't see the point of investing in an ETF that basically tracks the S&P.
Now for stocks that I actually am investing in that are NOT going to track the S&P.
REDFIN - RDFN
Redfin a former darling the US housing market that has been crushed like a bug in the rug, though which has stood the test of time, i.e. is not a recent IPO that could go bust but has gone through several housing booms and busts. The stock chart says it all! A high of 100 and recent low of just $5. Yes it is high risk, very high risk, but IF the probability of going bust is low then like many of the high risk stocks on my list such as Inmode then there is a good chance that post rate rise, recession expectations blues when the FOMO once more starts to build in the US housing market then stocks such as RedFin will be right at the front of that speeding GRAVY TRAIN, soaring to levels that will long since have shaken most early investors off, i.e. cashing in for peanut gains and then forever waiting for a dip to rebuy!
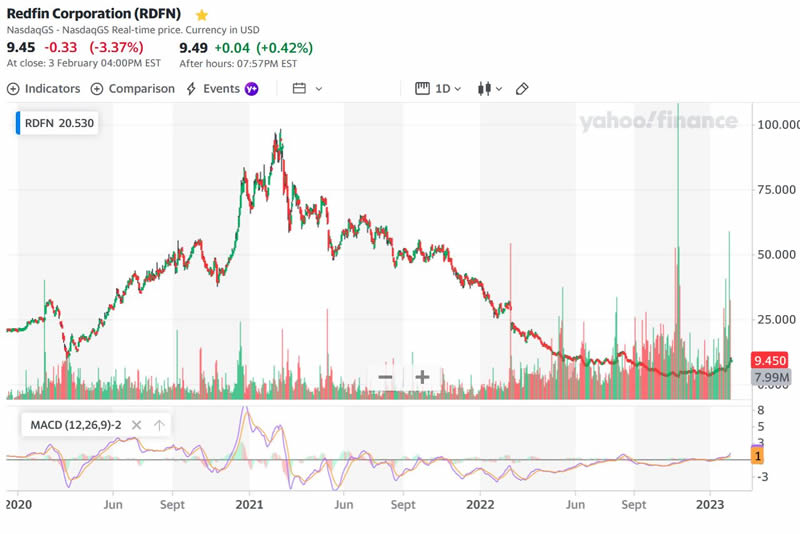
However to see if there are any signs of bull market life one needs to zoom in where what stands out is the heavy volume on it's decline below $7.50 where whilst the weak hands were throwing in the towel the smart money was buying hence Redfin put in a bottom and since rose a wall of worry, I actually did buy a sliver of exposure during October as one of the many falling knives I was getting stabbed with. The stock is attempting to breakout higher above its $13 high. Given that the broad market should correct and that Redfin is retreating from resistance, we should get a chance to accumulate at between $9.5 and $5.5. Yes it could be that volatile but I won't be getting greedy, I'll take whatever opportunity this crushed like a bug high risk stock gives to add to this potential X10 rocket.
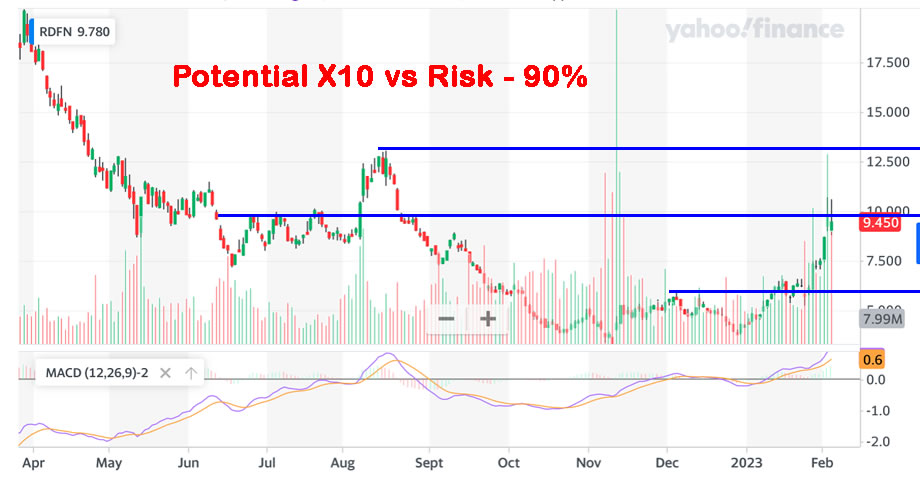
Redfin could turn out to be one of the best US real estate investments for the next 5 years, 10X, 20X, could even 100X! given it's tiny market cap for all those who manage to stay on board this gravy train! Of course such potential huge returns carries with it the ultimate risk of LOSING IT ALL! A Hero or Zero Stock, so definitely not one for weak stomach investors because the fundamentals are BAD, the company is losing money quarter over quarter which is why it is trading at $9 bucks per share instead of $100! Bad news equals LOW prices, cannot get one without the other! Maximum doom and gloom is what yields the greatest opportunities. So yes the corporate news is bad, earnings are bad (has losses not earnings), balance sheet is bad, everything is BAD but that is why the stock is trading at $9. Redfin as Cathy Wood would say is a disrupter, disrupting the buyer / seller commission structure of the US housing market, it has a loyal customer base and is said to have a good app.
IIPR - Innovative Industrial Properties Inc
The first REIT on my list that currently yields 7.7%, But unlike the usual suspects such as O, offers enough volatility to give one at least the chance of making X times ones investment whilst also receiving a high dividend. So how does IIPR achieve this minor miracle? By getting HIGH! IIPR rents out 'Medical' properties that are leased to Cannabis growers! So one gets access to the Cannabis sector without actually investing in Cannabis stocks that have proven very problematic when trying to invest in such stocks. For instance I was recently forced to sell all of my Jazz Pharma holdings Because Crest were set to cease trading in the stock due to it's Cannabis exposure, this despite the stock being listed on the Nasdaq. So IIPR kills 2 birds with one stone, exposure to US housing and exposure to Cannabis!
This is the kind of chart you want to see when gearing upto accumulate, the stock price PLUNGED on bad news, a falling knife that did a dead cat bounce. I don't see much more downside to this stock which looks set to retest the $82 low, this is what an accumulation zone looks like i.e $93 to $82, yes it could go below $82, but we will only know that with the benefit of hindsight, but one cannot buy with the benefit of hindsight. So given where we are I am accumulating IIPR between $92 and $82 with a few limit orders ranging down to $68 on the 'chance' that it breaks to new lows investing for the long-run.
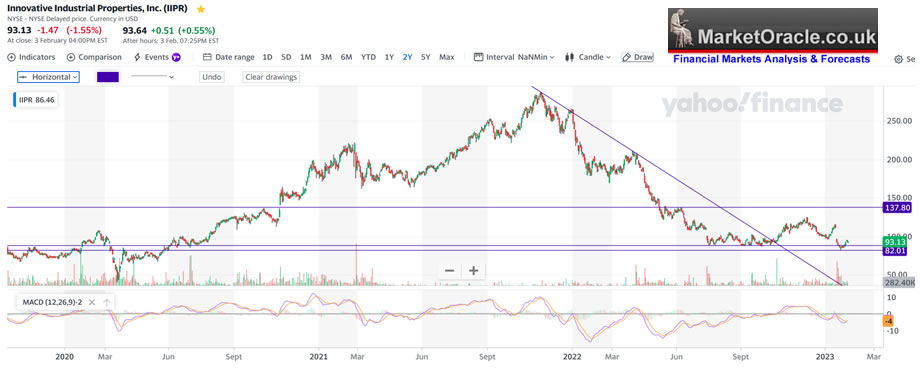
The bottom line, high risk high reward small cap stock with exposure to the GROWING Cannabis Sector and the US housing market and given where the stock price sits barely off it's lows I will definitely be buying over the coming weeks.
MPW - Medical Properties Trust Inc
Owns medical properties such as hospitals so exposed to the US housing market and healthcare sector that currently yields 9%!. Like most REITS it's not a capital grower, it's a dividend income stock. However it does range trade between $24 and $10, where most recent price action has seen the stock price bounce off it's low, so another stock trading at an opportune time which has now made a higher low low and higher high and broken it's downtrend line, so as far as I am concerned the bottom is in so all that remains is to climb on board this range trading gravy train before it fully choo choo's out of the station. The stock is currently correcting it's breakout which could end at any time, It is IN it's buying range of $13.1 down to $11.1, I suspect those who get greedy will be left sat on the bench at the station. Yes, for the time being upside IS limited to $24. However add the eye watering 9% dividend to that and well this as good as it gets in terms of risk vs reward, just invest and forget until $24 whilst collecting the 9% annual dividend at it's current price of $12,8.

The bottom line this was already on my buy the falling knives radar as a range trading stock so I am already invested, and will buy more on the dip, that should result in a yield of at least 10% per annum coupled with the potential to X2.
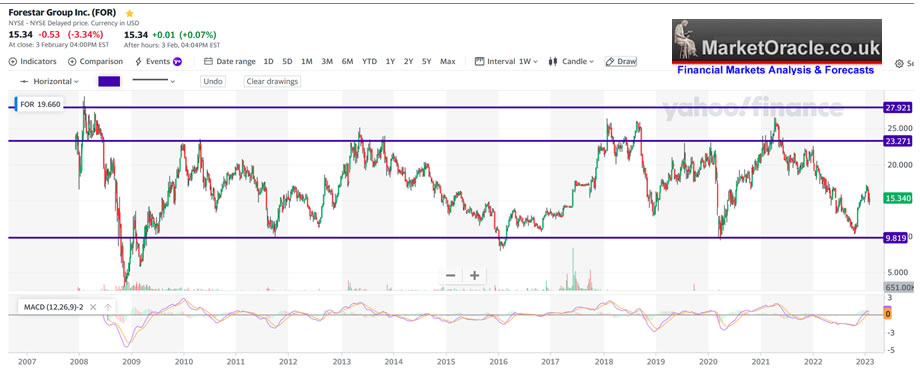
FOR - Forestar Group
Missed the boat with DR Horton well in steps Forestar a majority owned subsidiary of DR Horton. Why buy DR Horton near it's highs when one can buy Forestar near its lows! In fact the stocks fundamentals are marginally better than that for DR Horton. So whilst a downturn in the US housing market will hurt both stocks, Forestar trades on a PE of 4.8 vs DR Horton on 6.1.
The stock trades in a easily defined range of $23 to $10. So accumulate below $11 with a view to selling above $22 for X2, whilst leaving a little on the table in case it blasts off, given it's low market cap of $765mln and low PE .Going into the low this was an easy stock to accumulate into which was followed by a 70% advance currently parking the stock at 38% of it's range. Forestar is now correcting which should see it trade down to at least $14.5, below that would be a lower probability trend towards $13.5, and I don't think we have much of a chance of seeing the stock go below that, not in this cycle. I aim to accumulate in the $14.8 to $13.5 range as the stock has put in it's bear market bottom and is now consolidating it's 70% advance in preparations for the next leg higher. So it's a case of asking oneself does one want to hitch a ride from about $14.5 to $23 for a potential 70% or not?
So those are the four US housing market stocks that I am accumulating and I am on the hunt for a UK property fund trading at an opportune level so watch this space!
What do Real Estate Stocks Say for US House Prices?
Even though house prices have barely dipped, i.e. still up over 6% on the year, US housing stocks leveraged to house prices have already crashed and burned as though the housing market had undergone a mini 2008 moment where all of them are now showing signs of having bottomed and are turning higher which implies that the US hosing market is a lot more robust than the picture one gets from the talking heads on the cartoon network (CNBC). The housing stocks bear market has already ENDED with barely a whisper in terms of actual house price drops! Why? Because 2008 was an anomaly a once in a generation event that is not going to repeat for decades so all those waiting for a repeat are going to be badly disappointed. Therefore housing stocks are pointing towards a resumption of the US house prices bull market during 2023.
Black Swan War 2023
The black swan of 2022 was Russia invading Ukraine that few saw coming, seriously MSM got it badly wrong right upto the day the tanks rolled across the border, so what could be the big black swan of 2023? Taiwan you say? That 80 mile stretch of water demands far more preparation. No the real spark for the next big war during 2023 could be the China / India border which regardless of Ray Dalio's mantra about the rise of China, the reality is that China has already peaked, it's population is falling whilst India's population has overtaken China's for the first time in history when not so long ago China's population was TWICE that of India's, which puts China on the defensive and India on the offensive in terms of their long standing border disputes that ironically could trigger China to act preemptively during 2023.
Given the mega-trend in motion of a declining China vs a rising India, similar in many ways to Russia's preemptive war against in Ukraine, a case of now or never moment because of the exploding demographic TIME BOMBS, China has a FAST ageing population coupled with a low birth rate, whilst India has a YOUNG population coupled with a HIGH birth rate.

Impossible? We'll the last border skirmish was during December 2022, and before that November 2021.
So maybe it's time for Ray Dalio to admit he was wrong about the rise of China and do a new book on the Rise of India.
Pakistan? 230 million population! How the hell did Pakistan get to 230 million, 50 years ago it was about 60 million! A mini India if it can overcome endemic corruption. Pakistan is in no state to join any conflict between China and India as the inflation mega-trend has pushed it's economy to the brink of collapse.
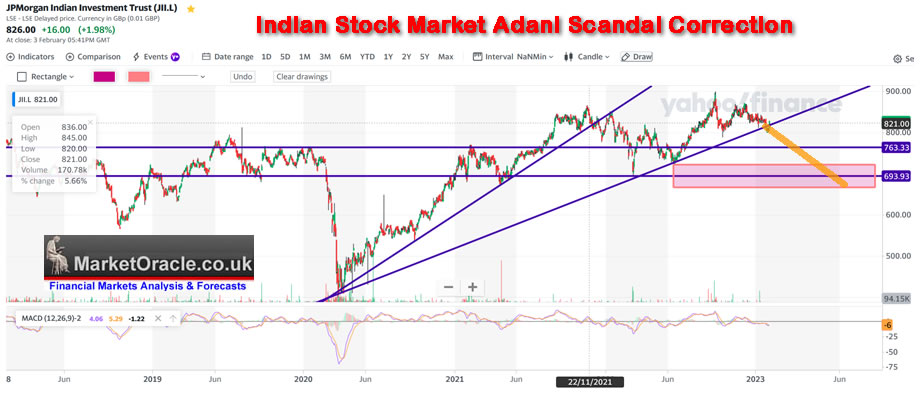
In terms of investing in Indian stocks my interest only extends to JP Morgan's JII investment trust where currently I have no exposure and would seek to accumulate in the £7 to £6 range that the Adani Scandal may make manifest, where the clan inflated their groups stock prices via shell companies to crazy X500 valuations for industrials so that the clan can borrow against stock collateral to further inflate the valuations higher, apparently a ponzi bubble that now appears to be bursting which is the narrative of short selling firm Hindenburg Research that has been pumping the story in the media, Anyway this does look to set to drag the Indian market lower for a potential buying opportunity in the likes of JII.
This analysis Stock Market Completes Phase Transition, US Real Estate Stocks - Housing Market Part1 was first made available to patrons who support my work.So for immediate first access to ALL of my analysis and trend forecasts then do consider becoming a Patron by supporting my work for just $5 per month. https://www.patreon.com/Nadeem_Walayat.
For first access to ahead of the curve analysis as my extensive analysis of the stock market illustrates (Stocks Bear Market Max PAIN - Trend Forecast Analysis to Dec 2023 - Part1), that continues on in the comments section of each posted article, all for just 5 bucks per month which is nothing, if you can't afford 5 bucks for month then what you doing reading this article, 5 bucks is nothing, if someone did what I am doing then I would gladly pay 5 bucks for it! Signup for 1 month for a taste of the depth of analysis that cannot be beat by those charging $100+ per month! I am too cheap! I am keeping my analysis accessible to all, those willing to learn because where investing is concerned the sooner one gets going the better as portfolios compound over time, $5 month is nothing for what you get access to so at least give it a try, read the comments, see the depth of analysis, you won't be sorry because i do do my best by my patrons, go the extra mile.
And gain access to the following most recent analysis -
- SVB Collapse Buying Opportunity Counting Down to Resumption of Stocks Bull Market
- Stock Market Counting Down to Pump and Dump US CPI LIE Inflation Data Release
- Stock Market Completes Phase Transition, US Real Estate Stocks - Housing Market Part1
- S&P500, Gold, Silver and Crypto's Trend Forecasts 2023
- Stocks Bear Market Max PAIN - Trend Forecast Analysis to Dec 2023 - Part1
- Stock Market Analysis and Trend Forecast Oct 2022 to Dec 2023 - Part 2
So for immediate first access to to all of my analysis and trend forecasts then do consider becoming a Patron by supporting my work for just $5 per month. https://www.patreon.com/Nadeem_Walayat.
My Main Analysis Schedule:
- US House Prices Trend Forecast - 50%
- Global Housing / Investing Markets - 50%
- US Dollar / British Pound Trend Forecasts - 0%
- High Risk Stocks Update - Health / Biotech Focus - 0%
- State of the Crypto Markets
- Gold and Silver Analysis - 0%
- How to Get Rich - 75%

And ensure you are subscribed to my ALWAYS FREE newsletter for my next in-depth analysis.
Your ready to buy the dip analyst.
By Nadeem Walayat
Copyright © 2005-2023 Marketoracle.co.uk (Market Oracle Ltd). All rights reserved.
Nadeem Walayat has over 30 years experience of trading derivatives, portfolio management and analysing the financial markets, including one of few who both anticipated and Beat the 1987 Crash. Nadeem's forward looking analysis focuses on UK inflation, economy, interest rates and housing market. He is the author of five ebook's in the The Inflation Mega-Trend and Stocks Stealth Bull Market series that can be downloaded for Free.


 Nadeem is the Editor of The Market Oracle, a FREE Daily Financial Markets Analysis & Forecasting online publication that presents in-depth analysis from over 1000 experienced analysts on a range of views of the probable direction of the financial markets, thus enabling our readers to arrive at an informed opinion on future market direction. http://www.marketoracle.co.uk
Disclaimer: The above is a matter of opinion provided for general information purposes only and is not intended as investment advice. Information and analysis above are derived from sources and utilising methods believed to be reliable, but we cannot accept responsibility for any trading losses you may incur as a result of this analysis. Individuals should consult with their personal financial advisors before engaging in any trading activities.
Nadeem Walayat Archive |
© 2005-2022 http://www.MarketOracle.co.uk - The Market Oracle is a FREE Daily Financial Markets Analysis & Forecasting online publication.