


Stock Market Preps for CPI LIE Inflation PUMP and DUMP
Stock-Markets / Stock Market 2023 Jun 11, 2023 - 06:42 PM GMTBy: Nadeem_Walayat

Dear Reader
Are the FOMO Maniacs about to get rug pulled?
We have CP LIE Tuesday and then the Fed rate meeting Wednesday in advance of which retail investors and many fund managers woke up June 1st to realise that there is a bull market underway and literally PANIC bought like a herd galloping towards the edge of the AI cliff.
Which is the focus of my next analysis due to be posted before Mondays open - https://www.patreon.com/Nadeem_Walayat.
This article Stock Market Preps for CPI LIE Inflation PUMP and DUMP was was first made available to patrons who support my work.So for immediate first access to ALL of my analysis and trend forecasts then do consider becoming a Patron by supporting my work for just $5 per month. https://www.patreon.com/Nadeem_Walayat.
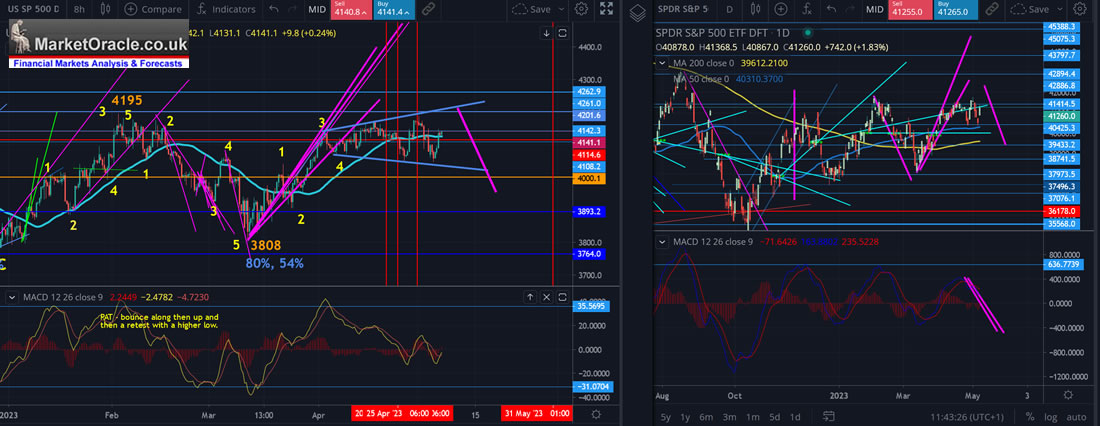
S&P last close 4136, -1.2% from the swing high to date of 4187 that came within 9 points of setting a new bull market high on break of 4195. The S&P currently stands up 8.,6% from the last swing low of 3808 and 4% below the swing target of 4300. The swing is now 14 days beyond the original expected juncture at around 24th April having entered the window for a downswing and thus is living on borrowed time with a break of 4200 remaining tantalising close.
My most recent market brief Friday (6AM UK) concluded -
We now have a lot of overhead barriers to overcome, 4100, 4120, 4140, 4165, 4185. It's going to be like treacle pushing through all of that. And time is not on this rally's side, so a rally back above 4100 could get stuck at around 4140 and given the trend to date that would open the door for the down swing off of the 1st of May 4185 high to trade to sub 4000 due to repeat failures to break higher, at least 5 chances to make a run for 4200!
Subsequent price action closely matched the most probable trend with the S&P topping out at 4148 before closing at 4136 thus suggesting that we are now in downtrend that targets sub 4000 which is the focus of this analysis to determine..
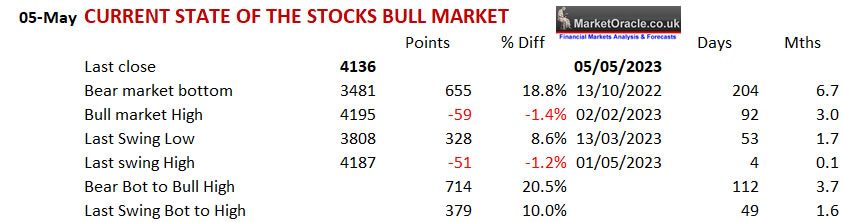
Current State of the Stocks Bull Market
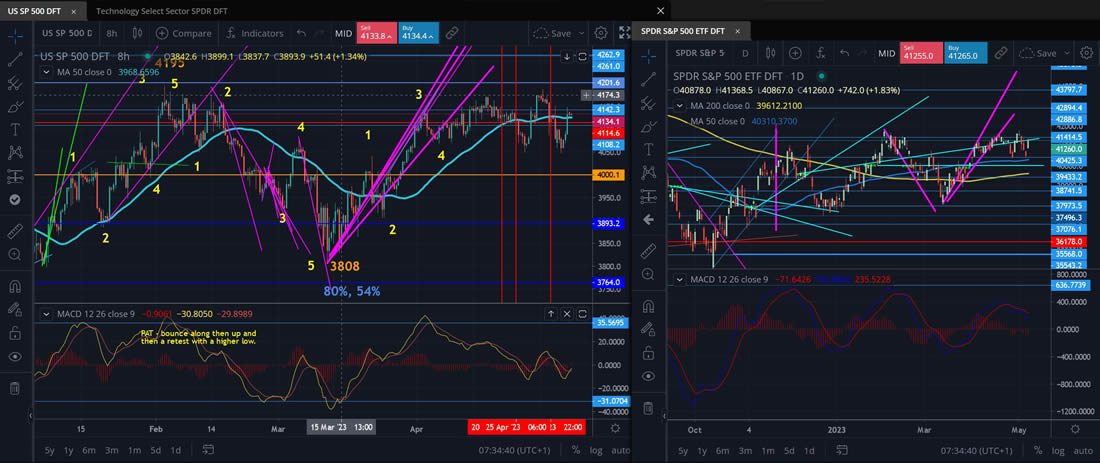
It may not seem like it but we are within a stones throw of the bull market high of 4195, barely 60 points below, but the market has had umpteen chances to break higher, at least 5 and t failed every time, and time is the operative word, it is now 53 days since the last swing low and 4 days since the swing high to date (1st May). so even a cursory look at the current state of play suggests that the direction of travel should be lower rather than higher, probably into the end of My as was my original expectation of how things could play out in advance of the next leg higher as the chart with my original swing projections illustrates that the upswing has now run out of time whilst at the same time the daily MACD crossed flashing a SELL signal on the 24th of April which as per the MACD study suggests we are in a downtrend, despite the S&P at $4136.
The problem is that if the swing terminates here then the S&P will have put in a LOWER high i.e. 4187 vs 4195 which would act to weaken the bull market i.e. make it much harder to achieve the likes of 4500, and more likely o be range bounce oscillating around 4000 for probably the rest of this year.
Thus to continue to maintain a high probability for achieving my trend trend forecast as of October 2022 then Ideally I would like to see the S&P trade above 4195 to make a higher high which translates into a move above 4200 and if 4200 is crossed then that would open then the door to make a run for 4300+ which has been the scenario I have been working towards and positioned for since the March low. So ironically it would not be the correction itself that would worry me as it is expected, it's the fact that it is coming off a lower high, hence why I have remained fixated on the S&P breaking above 4200 so that it can tick off the higher high checkbox and then correct.
- Stocks Bear Market Max PAIN - Trend Forecast Analysis to Dec 2023 - Part1
- Stock Market Analysis and Trend Forecast Oct 2022 to Dec 2023
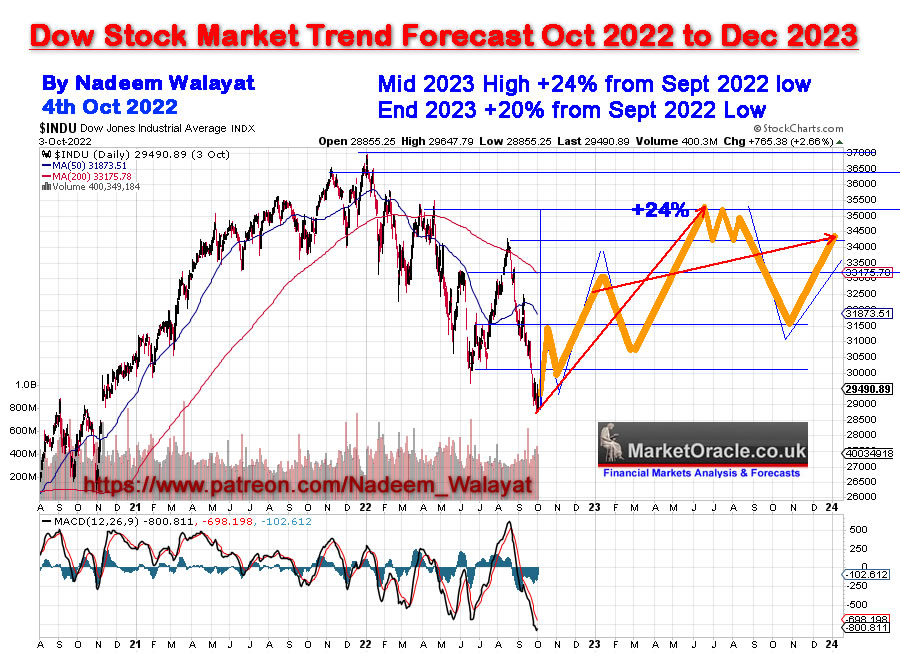
And for the S&P to ultimately target a trend to 4500+ by Mid Summer 2023.
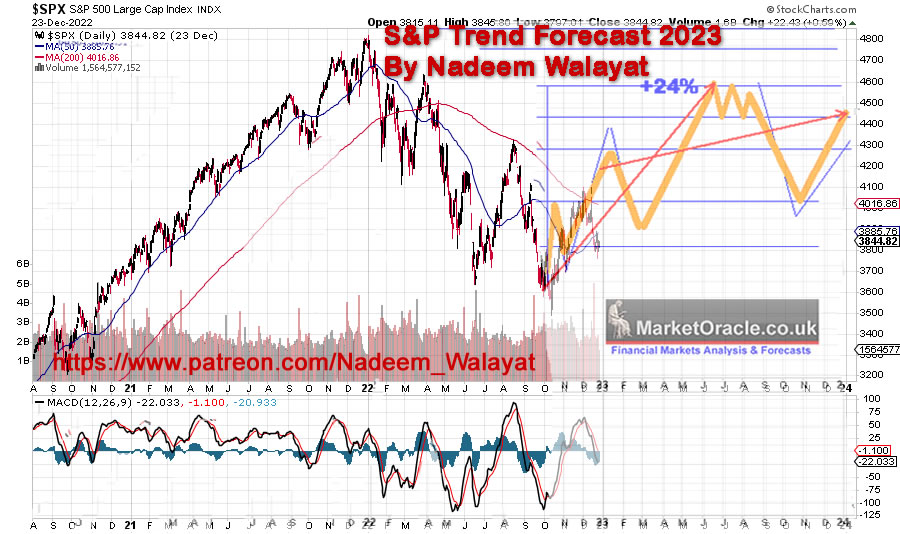
In terms of deviations against the trend forecasts the Dow should now be trading at 33,500 vs actual 33,674 for a +0.5% deviation against trend forecast. Whilst the S&P at 4136 vs 4160 forecast for a -0.5% deviation against forecast which is about as good as one can expect a forecast to be some 7 months later.
Sell in May and Go Away?
Sell 1st May, Buy 1st November as the saying goes. Usually turns out to be a fail. S&P ended April 4170, so say S&P on 1st of November is at 4000, that's 170 points for the Sell in May brigade to proclaim victory! Yelling from the roof tops we told you, you bloody fool to SELL in May and Go Away, see you would be a net 170 points better off now!
Several swings during the 6 months period to capitalise upon, lets simplify as per trend forecast for 4170 to 4400 and back to 3900 upto 4100 and then end October at 4000 for 1030 points. Now do you see why I class Sell and May and Go Away as a fools pattern, yes there is a good chance of it coming good this year given that the S&P closed April near it's bull market high, but I can probably yield more that on the next correction alone, let alone over 6 months and this is without allowing for individual stock trends that tend to do their own thing.,
CP LIE Inflation Wednesday
It's CPI Wednesday! We usually get a fake move on release of CPI data that soon reverses which given that the market looks set to rise into CPI data release then we should be setting up for a reversal lower some time after release of CP LIE which chimes with swings analysis..
My inflation forecasts table covers releases for January to April data, March data released on 12th April showed a sharp drop as expected, which I imagined would send the S&P through 4200, but it was not to be,. so what about Aprils data to be released Wednesday ? STICKY! My expectations were for it to barely budge from March data. Whilst the consensus is for US CPI to remain flat at 5%, however I think we could eek out a small drop.
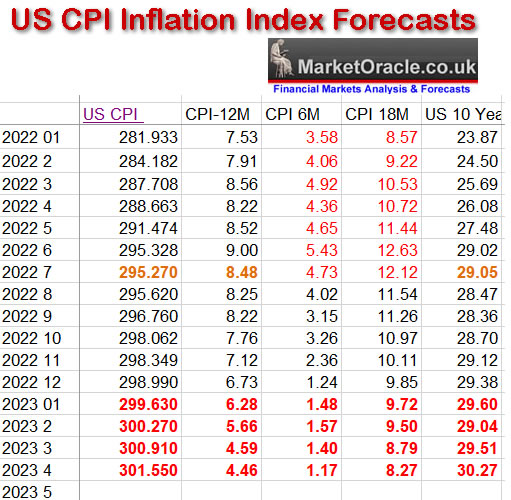
I will update the table with my expectations for the next 4 CPI releases for Mays CPI to be released in June, but if a 1% drop in CPI failed to send the S&P to the moon then what is 0.1% going to do? Probably deliver a FAKE RALLY, unless we get a SURPRISE BIG drop. So I will be viewing a CPI rally as being FAKE to SELL into for a correction..
Apple Stock Price S&P Earnings Analysis
As EGF's flagged Apple delivered an expected earnings beat with the stock popping despite being EXPENSIVE, held aloft not just by the bull market but flight to safety as parts of the banking crime syndicate resume going bust.
Apple Earnings Analysis
As goes the Apple stock price so goes the S&P.
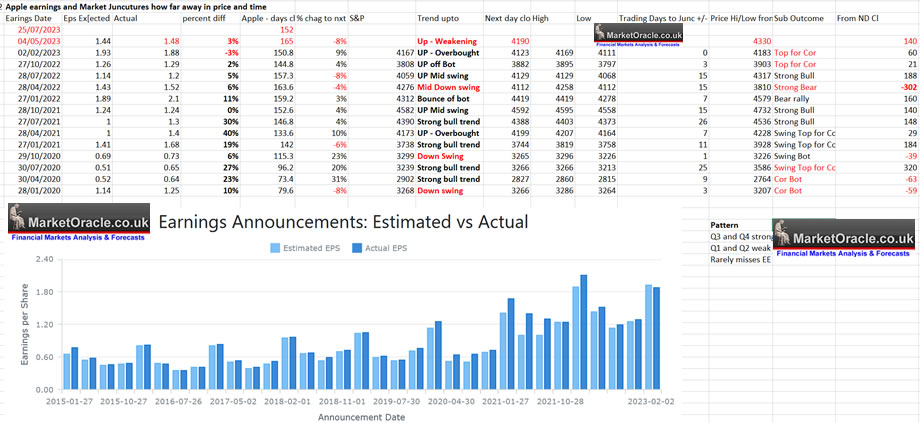
Table big Image - https://www.marketoracle.co.uk/images/2023/Apr/Apple-Earnings-Stock-Market-Trend.jpg
Apple earnings pattern suggests S&P to run 140 to 180 points higher over the next 15 days which points to 4300 by Friday 19th May.
Major Swings Analysis
Major swings analysis continues to suggest an early May top (9th/10th May) given where the S&P currently stands (4136) the chances of achieving 4316 whilst possible does not look probable, thus 4248 is the more probable outcome i.e. a top Wednesday is about as far as this upswing can run, perhaps a couple more days higher beyond before the over due correction begins.
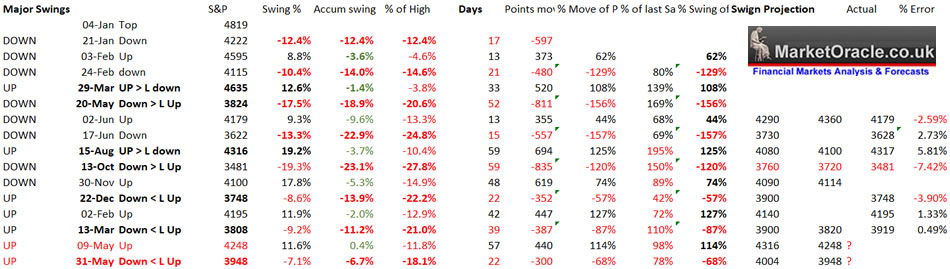
Big Image - http://www.marketoracle.co.uk/images/2023/May/swings-8-big.jpg
Short-term swings also chime with a top on or near 10th May at around 4248.
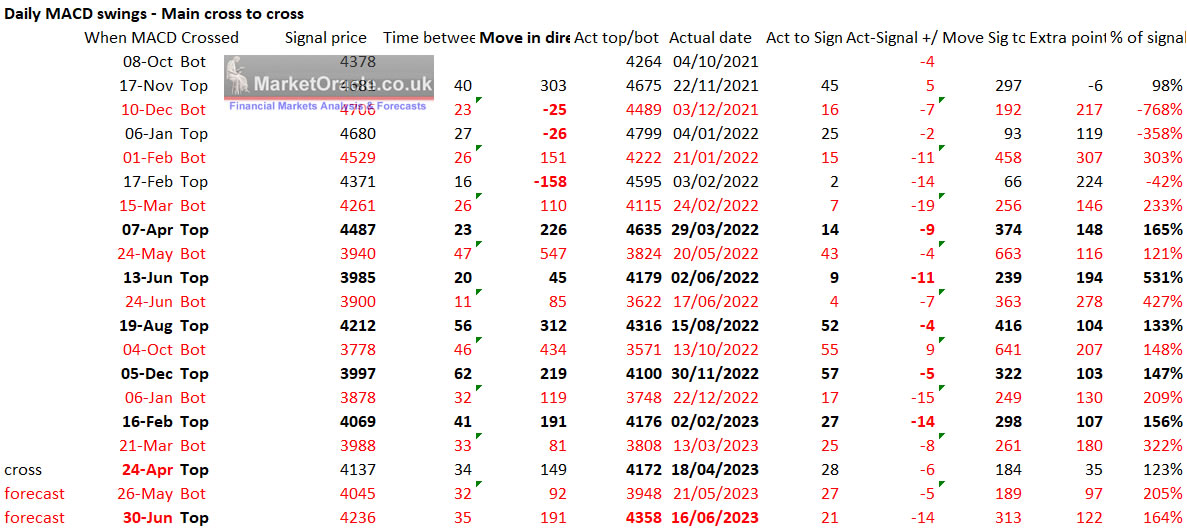
MACD Swings Study
MACD has been on a SELL since 24th of April, correctly calling subsequent weakness, study suggests the next MACD cross will be around the 26th of May therefore the S&P should bottom before the 26th of May, about a week earlier than the MACD to spark the next swing higher to beyond 4300.
Conclusion
Condensing everything down into what is the most probable outcome - I see a FAKE POP higher on CPI release where the only question mark is does the S&P set a new bull market high above 4195 or not., the swings suggest yes to about 4250, topping out and reversing lower to enter into a relatively brief correction that will see the S&P trade below 4000 during May, probably to below 3950 that will set the scene for the next bull run to above 4300.
REMEMBER
1. The greater the deviation from the high then the greater the BUYING opportunity being PRESENTED
2. Draw downs are transitory and usually you'll wish you had bought more when you had the chance to do so.
Big Picture - I would not be surprised if the S&P trades to 6000 within the next 2 years, so that's 2000 points vs fussing over a 200 point correction. This is why most investors miss whole bull markets as they wait for their perfect buying prices to materialise based on voodoo formulae's.
AI Stocks Portfolio
I will be trimming what I can so as to bring % invested down to under 90% from current 91%, roughly aiming to sell about 2% of my portfolio..
Portfolio Google spreadsheet - https://docs.google.com/spreadsheets/d/1-dPfmAcnptFJxJZq3h9caMLzkO0ceSA8VsO4TmU7dQo/edit?usp=sharing
Got lucky with APM as an after hours spike last Wednesday saw me exit 50% via a limit order at $16.5, with the trading high according to Nasdaq being $19.24.
APM is one of 3 stocks that I seek to remove from my portfolio as opportunities arise as being too high risk. Why did the price spike? For whatever reason some one put in a large order to buy after hours when there isn't the volume for this microcap stock hence it spiked which is the primary strategy to disinvest from such stocks i.e. price spikes usually on lab news,
GPN reported good earnings recently, EGF is +3%, +15%, PE 11 Compare that to Paypal's sharply contracting earnings and PE 18.
Inmode reported good earnings recently, EGF now -7%, +14%, PE 13.2
Based on EGF's and PE ratios -
What's expensive
Nvidia, Microsoft, META, AAPL, Micron, Amazon, Intel
What's Fair
Google, AMD, ASML, LRCX, IBM , JNJ, ABBV, MED, PFE
What's Cheap
TSMC, QCOM, AMAT, AVGO, SYNA, MGNI, ULH and Alibaba also looks cheap on X11 earnings and EGF's are positive.
This Weeks Earnings
WDC 8th May - EGF -224% / -124%, PE 10.2
EGFS are horrific so I am not expecting good news, the only good news is that the stock is trading at a 10 year low of $30 so there is support here which should put a floor under WDC as investors discount post recession better times ahead because WDC has been in a recession for a good 6 months so a lot of the bad news has already been priced in the only question mark is will Q1 earnings deliver even worse bad news than most expect?
The bottom line is that the news is bad thus the price is trading at a 10 year low as you don't get one without the other. Whilst I can look at the chart and say a rally from here would X2 to $60. However, if the news is as bad as EGF's suggest then that $30 floor could break. On the plus side there is little risk of WDC going bust so it's a case of waiting for the bounce back that it has done umpteen times before in the past.
Diodes $86 - 9th May - EGFS -14% / -8%, PE 10.8 - Suggest miss, so could fall on earnings..
GFS $59 - 9th MAY - EGFS +25% / -10%, PE 18.7 - Suggests beat so stock should head higher.
CRSR $17.8 - 10th MAY - EGFS R241% / R309%, PE 107 - Earnings will be bad but the stock is trending higher so could break higher.
MGNI $8.6 - 10th MAY - EGFS 50% / 14%, PE 15 - Suggest beat - MGNI could spike higher
U $28 - 10th MAY - EGFS -75% / -219%, PE -68 - Very bad earnings expected but the stock is already scraping the bottom of the barrell so not much downside left.
CRSPR $55 - 10th MAY - EGFS -26% / -25%, PE -6 - Biotech - Rising into earnings so could dump afterwards.
MTTR $2.6 - 9th MAY - EGFS -26% / -25%, PE -6 - Awaits the metaverse and the herd FOMO-ing into loss making growth stocks once more.
CARA $4.4 - 15th May - EGFS -26% / -25%, PE -6 - Bad earnings. Biotech spike and crash not trend, so I await the next spike.
Bursting Burry's Bubble
Back near the bear market's low in June 2022 Michael Burry was tweeting that the bear market was only at about the half way mark.
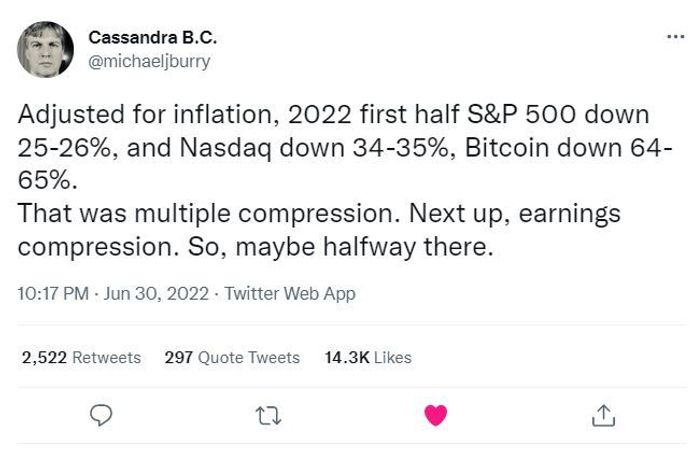
To be clearer
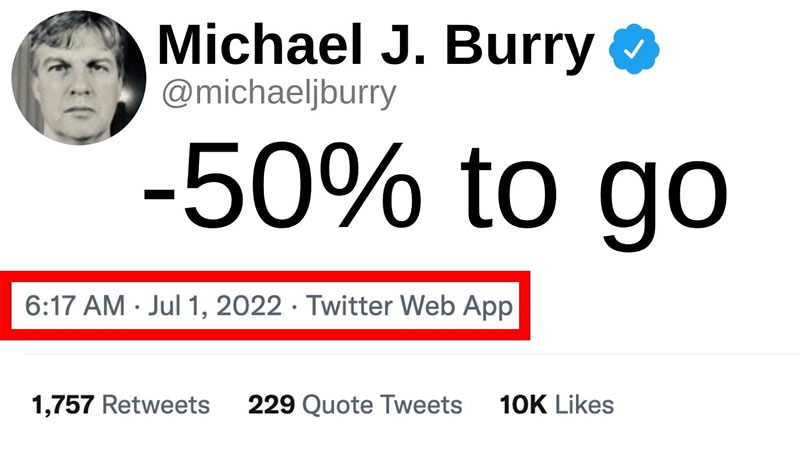
This illustrates -
a. That you should run a mile from ALL fund managers! They make their money by charging Noob investors 2%-4%,
b. Fear sells
c. Why most investors miss not just the bottoms but WHOLE bull markets as they wait for the 50% crash is always coming bottom.
What does Burry's most recent tweet state?
Who cares!
And finally the SEC In response to Cramer's greatest hits such as recently singing the praises of META at $240 whilst at $100 stated META was FINISHED, orders Cramer to dress as a clown when on the Cartoon Network (CNBC) so that investors know not to take that which spews out of his mouth seriously.

Meanwhile Charlie looked bored, I don't think he wants to be king. I can't take the monarchy seriously.

This article Stock Market Preps for CPI LIE Inflation PUMP and DUMP was was first made available to patrons who support my work.So for immediate first access to ALL of my analysis and trend forecasts then do consider becoming a Patron by supporting my work for just $5 per month. https://www.patreon.com/Nadeem_Walayat.
As my extensive analysis of the stock market illustrates (Stocks Bear Market Max PAIN - Trend Forecast Analysis to Dec 2023 - Part1), that continues on in the comments section of each posted article, all for just 5 bucks per month which is nothing, if you can't afford 5 bucks for month then what you doing reading this article, 5 bucks is nothing, if someone did what I am doing then I would gladly pay 5 bucks for it! Signup for 1 month for a taste of the depth of analysis that cannot be beat by those charging $100+ per month! I am too cheap! I am keeping my analysis accessible to all, those willing to learn because where investing is concerned the sooner one gets going the better as portfolios compound over time, $5 month is nothing for what you get access to so at least give it a try, read the comments, see the depth of analysis, you won't be sorry because i do do my best by my patrons, go the extra mile.
S&P

And gain access to the following most recent analysis -
- Current State of the UK Housing Market as Stocks Climb a Wall of Worry
- Can AI Tech Stocks Mania Push the S&P Through 4300?
- Stock Market Fundamentals, Debt Ceiling Smoke and Mirrors Circus
- Stock Market Preps for CPI LIE Inflation PUMP and DUMP
- Stock Market Counting Down to Apple Earnings Trend Acceleration
- SVB Collapse Buying Opportunity Counting Down to Resumption of Stocks Bull Market
- Stock Market Completes Phase Transition, US Real Estate Stocks - Housing Market Part1
- S&P500, Gold, Silver and Crypto's Trend Forecasts 2023
So for immediate first access to to all of my analysis and trend forecasts then do consider becoming a Patron by supporting my work for just $5 per month. https://www.patreon.com/Nadeem_Walayat.
My Main Analysis Schedule:
- How to Get Rich - 85%

- US House Prices Trend Forecast - 50%
- Global Housing / Investing Markets - 50%
- US Dollar / British Pound Trend Forecasts - 0%
- High Risk Stocks Update - Health / Biotech Focus - 0%
- State of the Crypto Markets
- Gold and Silver Analysis - 0%
Again for immediate access to all my work do consider becoming a Patron by supporting my work for just $5 per month. https://www.patreon.com/Nadeem_Walayat.
And ensure you are subscribed to my ALWAYS FREE newsletter for my next in-depth analysis.
Your trimming into the FOMIO rally analyst.
By Nadeem Walayat
Copyright © 2005-2023 Marketoracle.co.uk (Market Oracle Ltd). All rights reserved.
Nadeem Walayat has over 30 years experience of trading derivatives, portfolio management and analysing the financial markets, including one of few who both anticipated and Beat the 1987 Crash. Nadeem's forward looking analysis focuses on UK inflation, economy, interest rates and housing market. He is the author of five ebook's in the The Inflation Mega-Trend and Stocks Stealth Bull Market series that can be downloaded for Free.


 Nadeem is the Editor of The Market Oracle, a FREE Daily Financial Markets Analysis & Forecasting online publication that presents in-depth analysis from over 1000 experienced analysts on a range of views of the probable direction of the financial markets, thus enabling our readers to arrive at an informed opinion on future market direction. http://www.marketoracle.co.uk
Disclaimer: The above is a matter of opinion provided for general information purposes only and is not intended as investment advice. Information and analysis above are derived from sources and utilising methods believed to be reliable, but we cannot accept responsibility for any trading losses you may incur as a result of this analysis. Individuals should consult with their personal financial advisors before engaging in any trading activities.
Nadeem Walayat Archive |
© 2005-2022 http://www.MarketOracle.co.uk - The Market Oracle is a FREE Daily Financial Markets Analysis & Forecasting online publication.