


Why Most investors Underperform the Stocks Indices
Stock-Markets / Stock Market 2023 Jun 22, 2023 - 10:37 PM GMTBy: Nadeem_Walayat

Dear ReaderThe stock market ended the week at S&P 4410 off a new bull market high of 4448 against my expectations for a fuzzy week to deliver a correction this week enroute to the 4500+ final destination by late July to complete the first leg of this bull market and to herald a significant correction into October as illustrated by my original road maps -
Stock Market Analysis and Trend Forecast Oct 2022 to Dec 2023
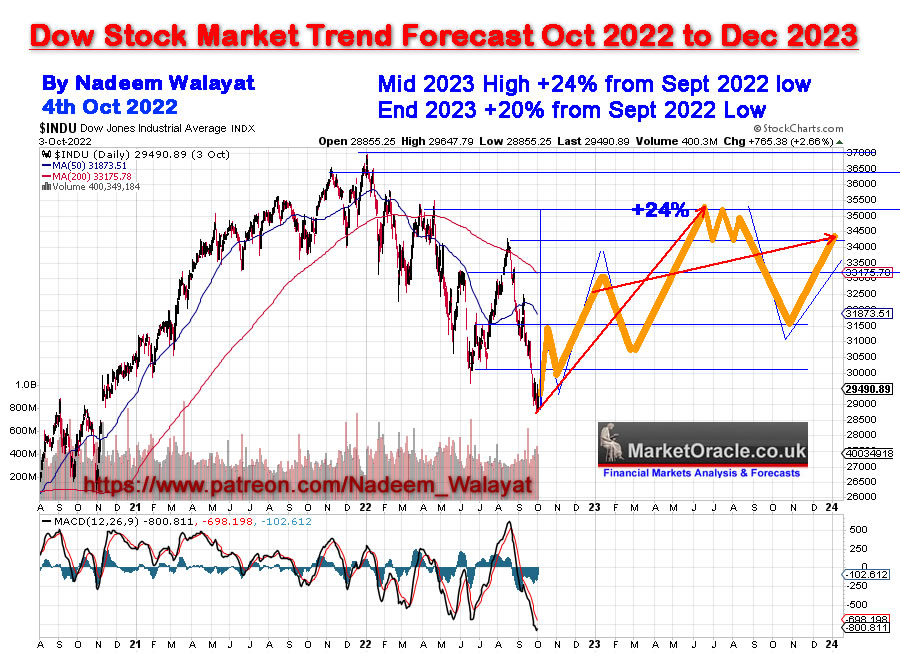
S&P ultimately target a trend to 4500+ by Mid Summer 2023.
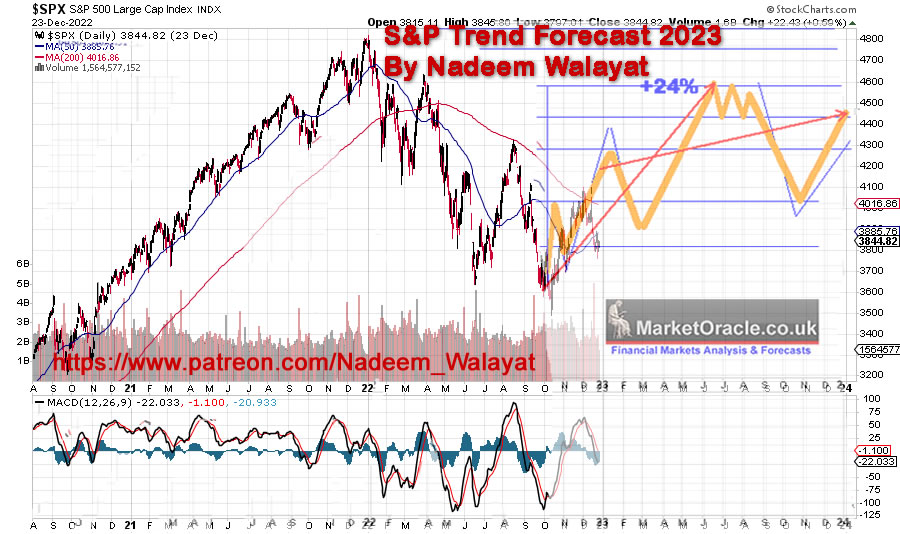
In terms of the current state of the trend forecasts then the indices are now in the window for setting their final highs i.e. the first peak Mid June followed by a correction and then the final second peak by late July. The Dow was forecast to trade to a high of 34,800 by now vs Friday's High of 34,588. Whilst the S&P at 4480 vs Friday's high of 4448, so we are in the end game in terms of further upside price action following this weeks correction it will have another shot at pushing higher where my original forecast concluded that it would fail to do so which following a second failed attempt would usher in the significant correction into October.
Which continues in my latest analysis - Stocks Bull Market Phase One End Game Sector Rotation
This article is part 2 of 2 of my recent analysis on the state of the stocks bull market Stock Market Fundamentals, Debt Ceiling Smoke and Mirrors Circus that was was first made available to patrons who support my work.So for immediate first access to ALL of my analysis and trend forecasts then do consider becoming a Patron by supporting my work for just $5 per month. https://www.patreon.com/Nadeem_Walayat.
Why Most investors Underperform the Indices
Time and time again I hear this mistake in the comments section, S&P is going down down should I sell x,y,z, stock and buy back later. As I often voice the indices such as the S&P are a red herring, ask anyone heavily invested in the likes of Apple, Nvidia or Microsoft and so on, The S&P is definitely not of much use for timing purposes in terms of accumulating and distributing as we saw this past week opps to distribute in the likes of MGNI and accumulate in the likes of Qualcom. So keep things in perspective, the indices are just that indices, a metric to gauge the direction of travel on an average basis and to perhaps swing trade the index but they are not that useful for buying and selling individual stocks, in fact can prove highly dangerous! For instance if the S&P looks toppy and a stock breaks higher then the investor might sell the strong stock. (META) as the index was heading lower. Similar for when the index is going up and a stock starts falling and the investor buys on perception that the stock is now cheaper (SVB).
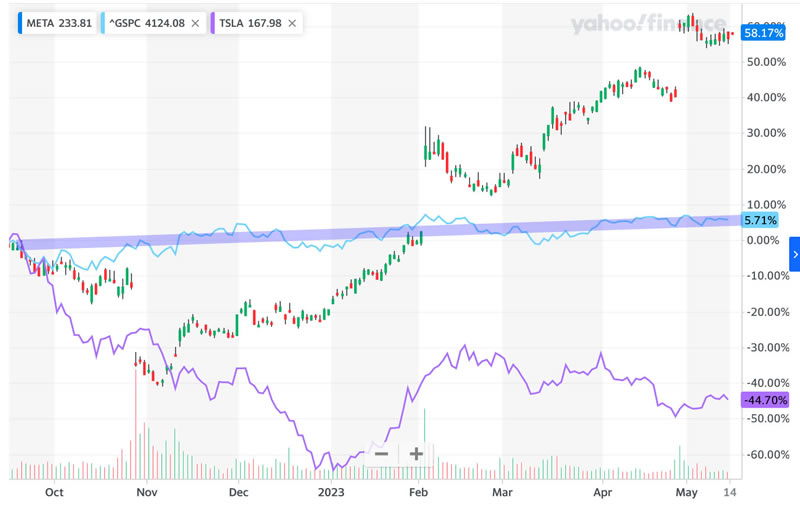
The indices are a RED HERRING! The more ones focuses on them the more one will become one with the herd and always wonder why one failed to buy x,y,z stock when it was dirt cheap or clung on to an expensive stock for far too long eventually giving up most of ones gains, it's because of focusing on the WRONG THING! The indices rather then the actual STOCK! Indices will encourage you to BUY garbage and SELL your best stocks which is why MOST investors UNDERPEFORM the indices!
AI Stocks Portfolio
Current state of my AI stocks portfolio is 89.9% invested, 10,1% cash, objective is to get to about 12% cash, trimming during the week in MGNI, Micron, Tesla, RBLX, Amazon, META, LRCX, Nvidia, Redfn, Google, AMD, Crispr, Logitec whilst I bought IBM, GFS, CRUS, Qualcom and some Bidu
The Q1 earnings numbers have been crunched resulting in EGF updates for most reported stocks where EGF gives the immediate outlook for the next quarter and 12MEGF a rough picture for 12 months from now.
Portfolio Google spreadsheet - https://docs.google.com/spreadsheets/d/1-dPfmAcnptFJxJZq3h9caMLzkO0ceSA8VsO4TmU7dQo/edit?usp=sharing
Looking at the portfolio what stands out are all of the RED EGF scores which suggests economic weakness for Q2 that could translate into a negative Q2 GDP. Look at Micron -400% and -213%! However amongst the deep reds are the bright spots such as Googie, Nvidia, Microsoft, META, ASML, Broadcom even Amazon. But there is economic pain in the pipeline that we will only know the magnitude of with the benefit of hindsight where EGFS specifically point to Micron that could see a new bear market low so at $61 and on any rally to $64 it may be wise to trim if over invested as I have been doing. If earnings fall as EGF suggests than the PE's will rise so I want to see the 12M EGF positive that gives the dark clouds a silver lining that many stocks have, even Intel.
The E/C Ratio column has been replaced with 'Fundamentals' - This does the same job with a 0 to 10 score that now extends to nearly all stocks which currently flags warnings for Nvidia, Micron, AMD and Amazon. Fundamentals is one of the four key metrics that enable one to instantly know where a stock stands relative to others i.e. EGFS, PE, Shares Dilution and Fundamentals. Given these metrics combined you can see why Apple is so strong and he stock with the strongest fundamentals is Broadcom.
Another new row is the EGF scores for the S&P 500, +3% and +17%, which suggests earnings beats for Q1 and a year forward. With 87% reported 77% have had an earnings beat with an aggregate surprise of +7.2%, Yes I know Q1 earnings are nearly over so the real value will come for Q2 which I will calc once Q1 has finished reporting.
And Medifast is GONE from the main portfolio to the Medium Risk portfolio, remember the Medium Risk portfolio is a recent construct. On the topic of Medifast, PE 6, EGF -17%, -35%, F6.1, the stock price is discounting a recession, the actual fundamental state of the company is not as bad as what the stock price implies i.e. I would not be surprised if Medifast X2 from here within a year or so.
GOOGLE ROCKET SHIP HAS LAUNCHED!
Trading to a high of $118 where I warned a few days earlier at $108 that it looked like it was on the verge of breaking higher. It wasn't that long ago I was getting asked if Google was finished and if one should sell at about $90, which illustrates why investors don't buy good stocks when they are cheap because instead of buying most actually were contemplating SELLING!
The stock price looks set to break above the previous high of $123 that will likely have accumulated a lot of stops above since the August 2022 high, which would likely propel Google towards $130, so I would consider $125 t $130 as a good trimming range and thus Google will be one of the first stocks to achieve my target high by Mid July 2023 ($122). in fact Microsoft has achieved it's target of $313 with Nvidia having come close to it's target of $313.
EGF Calc's on some patron mentioned stocks
SNOW $170, PE 630, +107%, +206%, Fundamentals 3.6
Looks like it's bottomed but I suspect it's going to fall hard 24th May earnings.
DDOG $87, PE 75, +11%, +24%, Fundamentals 3.3
Bottomed at %64, near top of range at $90
Palantir $9.5, PE 105, EGF +122%, +156%, Fundamentals 4.9
Put in a bear market low at $6, trading sideways since. High PE coupled with strong growth, still a big share printer though.
A potential future add to high risk portfolio, I am contemplating accumulating a small position below $7.75.
S&P Stock Market Trend
The S&P (4124) is following the down swing projection as of my last article as illustrated by the graph. An S&P pop over 4200 would have been nice to help trigger some trim limit orders but it never came close to breaking above resistance. Best case is if we get an early week rally on the back of tech stocks such as Google breaking higher to around 4150 that soon resolves in a swift decline into the end of the week to below 4000, targeting sub 3950 to put in a higher low and then prep for the next run higher that would take the S&P above 4200 during June. However, failure to make a higher high before this downswing has technically weakened the bull market which implies to expect a messy trend bumping around 4000 just as we saw take place near the swing top during the whole of April and into Mid May. The last swing low was 3808 I am not expecting this downswing to go anywhere near breaking that low.
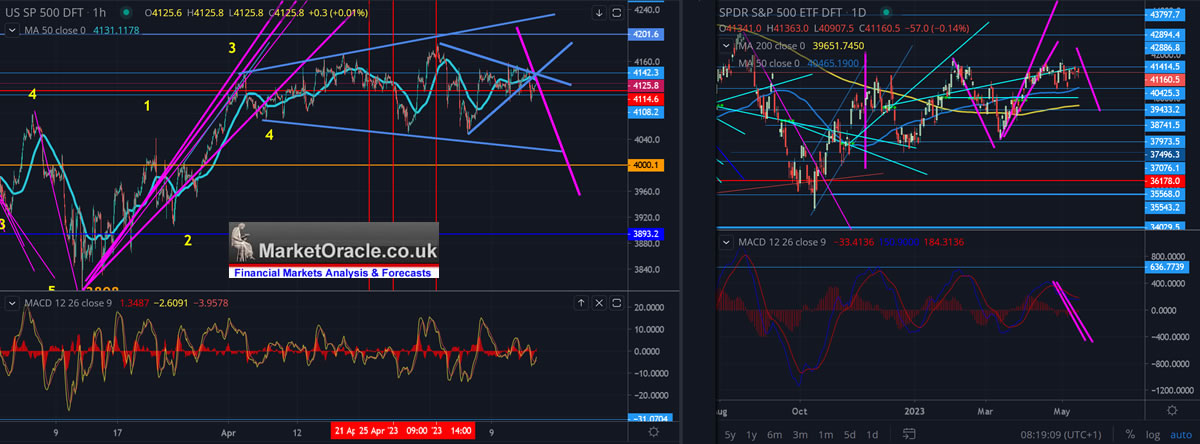
So in summary, a brief early week rally resolving in a break below 4050 to target a brief trade below 3950 before the market bases for the next swing higher to target a break of 4200. I suspect the market won't spend much time trading below 4000, i.e. spike below to run the long stops and to encourage the bears to place their bets.
So I will continue trimming, I especially I want to reduce exposure to AMD and Micron.
AI will first KILL us then SAVE us.

How to Get Rich Guide Plan for May.
1, The AI-Mega-trend Going Parabolic Video - Excerpt - https://youtu.be/3AqNebKQSR0

2. The Guide - Before the end of May.
Meanwhile in an Alt Universe buddy can you spare a dime?

I keep telling youngsters to do a science degree but for some unfathomable reason many still go and do stuff like law degrees. GPT just all but killed that 'profession' and the businesses that used to employ them amongst many others.
This article is part 2 of 2 of my recent analysis on the state of the stocks bull market Stock Market Fundamentals, Debt Ceiling Smoke and Mirrors Circus that was was first made available to patrons who support my work.So for immediate first access to ALL of my analysis and trend forecasts then do consider becoming a Patron by supporting my work for just $5 per month. https://www.patreon.com/Nadeem_Walayat.
As my extensive analysis of the stock market illustrates (Stocks Bear Market Max PAIN - Trend Forecast Analysis to Dec 2023 - Part1), that continues on in the comments section of each posted article, all for just 5 bucks per month which is nothing, if you can't afford 5 bucks for month then what you doing reading this article, 5 bucks is nothing, if someone did what I am doing then I would gladly pay 5 bucks for it! Signup for 1 month for a taste of the depth of analysis that cannot be beat by those charging $100+ per month! I am too cheap! I am keeping my analysis accessible to all, those willing to learn because where investing is concerned the sooner one gets going the better as portfolios compound over time, $5 month is nothing for what you get access to so at least give it a try, read the comments, see the depth of analysis, you won't be sorry because i do do my best by my patrons, go the extra mile.
S&P

And gain access to the following most recent analysis -
- Stocks Bull Market Phase One End Game Sector Rotation
- Stock Market FOMO Maniacs Rug Pull Imminent? US House Prices Trend Current State
- Current State of the UK Housing Market as Stocks Climb a Wall of Worry
- Can AI Tech Stocks Mania Push the S&P Through 4300?
- Stock Market Fundamentals, Debt Ceiling Smoke and Mirrors Circus
- Stock Market Counting Down to Apple Earnings Trend Acceleration
- Stock Market S&P Swings Analysis Going into Earnings Season
- SVB Collapse Buying Opportunity Counting Down to Resumption of Stocks Bull Market
- Stock Market Counting Down to Pump and Dump US CPI LIE Inflation Data Release
- Stock Market Completes Phase Transition, US Real Estate Stocks - Housing Market Part1
- S&P500, Gold, Silver and Crypto's Trend Forecasts 2023
So for immediate first access to to all of my analysis and trend forecasts then do consider becoming a Patron by supporting my work for just $5 per month. https://www.patreon.com/Nadeem_Walayat.
My Main Analysis Schedule:
- How to Get Rich - 85%

- US House Prices Trend Forecast - 50%
- Global Housing / Investing Markets - 50%
- US Dollar / British Pound Trend Forecasts - 0%
- High Risk Stocks Update - Health / Biotech Focus - 0%
- State of the Crypto Markets
- Gold and Silver Analysis - 0%
Again for immediate access to all my work do consider becoming a Patron by supporting my work for just $5 per month. https://www.patreon.com/Nadeem_Walayat.
And ensure you are subscribed to my ALWAYS FREE newsletter for my next in-depth analysis.
Your trimming into the FOMIO rally analyst.
By Nadeem Walayat
Copyright © 2005-2023 Marketoracle.co.uk (Market Oracle Ltd). All rights reserved.
Nadeem Walayat has over 30 years experience of trading derivatives, portfolio management and analysing the financial markets, including one of few who both anticipated and Beat the 1987 Crash. Nadeem's forward looking analysis focuses on UK inflation, economy, interest rates and housing market. He is the author of five ebook's in the The Inflation Mega-Trend and Stocks Stealth Bull Market series that can be downloaded for Free.


 Nadeem is the Editor of The Market Oracle, a FREE Daily Financial Markets Analysis & Forecasting online publication that presents in-depth analysis from over 1000 experienced analysts on a range of views of the probable direction of the financial markets, thus enabling our readers to arrive at an informed opinion on future market direction. http://www.marketoracle.co.uk
Disclaimer: The above is a matter of opinion provided for general information purposes only and is not intended as investment advice. Information and analysis above are derived from sources and utilising methods believed to be reliable, but we cannot accept responsibility for any trading losses you may incur as a result of this analysis. Individuals should consult with their personal financial advisors before engaging in any trading activities.
Nadeem Walayat Archive |
© 2005-2022 http://www.MarketOracle.co.uk - The Market Oracle is a FREE Daily Financial Markets Analysis & Forecasting online publication.