


U.S. Dollar Index the Key to Financial Market Dynamics
Currencies / US Dollar Aug 10, 2009 - 11:34 AM GMTBy: Guy_Lerner

 Over the next couple of weeks, I will attempt to put together an asset class road map that should help navigate the weeks and months ahead. In a nutshell, I would have to state that I like commodities over long term Treasury yields and equities, and the key driver will be the falling US Dollar Index.
Ever since I wrote the article "Very Dangerous Time For Dollar Index" on June 19, 2009, I have gotten several questions from readers about how I could be bearish on equities while maintaining bearishness on the Dollar. It seems to be a given that Dollar devaluation only leads to higher stock prices. While currency devaluation does lead to asset inflation, this can be too much of a good thing as inflationary pressures (real or perceived) will eventually begin to become a headwind for higher equity prices.
And this is what we saw in late June and early July, 2009. Inflationary pressures as measured by trends in commodities, gold, and yields on the 10 year Treasury bond remained strong and the market almost rolled over. Once these trends lost momentum, stocks reversed strongly to the upside over the past month. This pattern was pretty much repeated over and over again in the prior bull market for equities.
But I am ahead of myself. So let's first look at weekly chart of the Dollar Index (black line) versus S&P500 (blue line). See figure 1. For much of the late 1990's, stocks and the Dollar Index traveled together. These where the days when a strong Dollar and a strong economy and a strong stock market went hand and hand. This was prior to point 1 on the chart. At point 1, the historic multi-decade bull run for equities was over, and several years later at point 2 the US Dollar Index topped out as well. Both asset classes fell together and then equities bottomed at point 3. The Dollar Index continued lower for another 2 years finding a bottom at point 4. From the bottom in equities at point 3 in October, 2002 to the bottom in the Dollar at point 3 in December, 2004, the S&P500 gained 50%!!
Figure 1. Dollar v. S&P500/ weekly
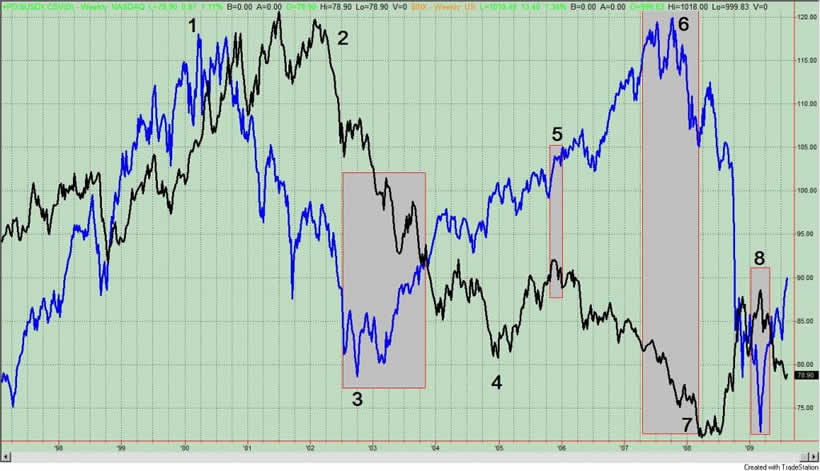
After a wide trading range with an upward bias (for over a year), US equities sprinted higher starting in November, 2005. This is at point 5, and it also marked the highs for the US Dollar, which went on a downward path for over 2 years. In October, 2007 at point 6, the S&P500 topped out, and within 6 months the US Dollar Index found a bottom at point 7. At point 8, the Dollar Index peaked, and lo and behold, the equity markets found their footing putting in the March, 2009 bottom.
Since 2000, the movements in the US equity markets can be explained (for the most part) by the movements in the US Dollar. A weaker Dollar has been kind to equities even if the fundamental foundation for such a relationship is wrong on two accounts. One, no country has ever devalued its way to prosperity. Two, the foundation for such asset growth -too much money chasing too few assets - is not sound. It leads to economic and financial instability once these excesses are unwound. This is not organic growth, and it provides a false sense of prosperity. But enough of the moral ground.
So let's get back to the Dollar Index. In the June 19 article, I presented a very simple trading system, which warned that the Dollar had a high likelihood of unraveling. See figure 2 a weekly chart of the US Dollar Index (symbol: $DXY). The premise of the strategy was this: 1) short the Dollar Index on a weekly close below 3 pivot low points; and 2) cover the position on a weekly close greater than the 40 week moving average. There were no other filters involved in this strategy. The strategy triggered a signal to short the Dollar 2 weeks ago.
Figure 2. Dollar Index/ weekly
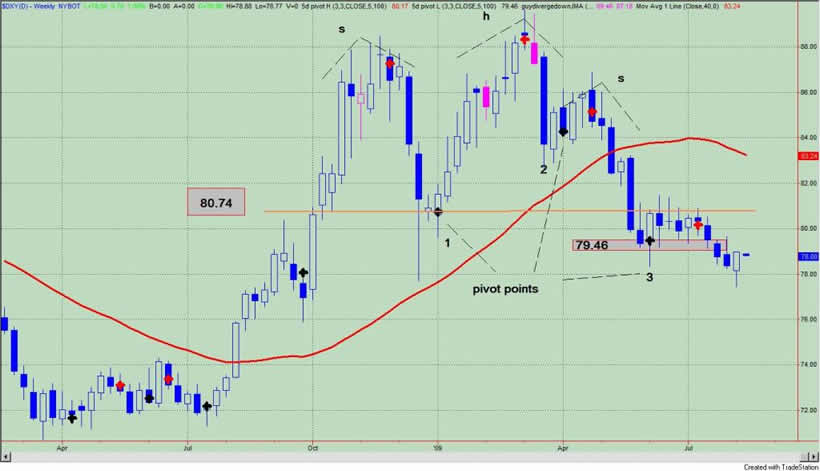
Such a strategy produced 19 trades since 1975. There were 42% winners; no single trade lost more than 5%; 5 of the trades had gains greater than 14%. These parameters - lots of small losers with several big winners - are consistent with a trend following strategy.
To look at each trade, I introduced a concept called Maximum Favorable Excursion or MFE. MFE measures in percentage terms how far a trade can go in your favor before it is closed out for a loss or a win. For example, look at the MFE graph from our "close below 3 pivot points strategy" in the Dollar Index. Remember we are shorting the Dollar Index here. See figure 3. The green caret within the blue box represents one trade. This trade ran up about 9% (x-axis) and was closed out for a 2% gain (y-axis). We know this trade was a winner because it is a green caret.
Figure 3. MFE
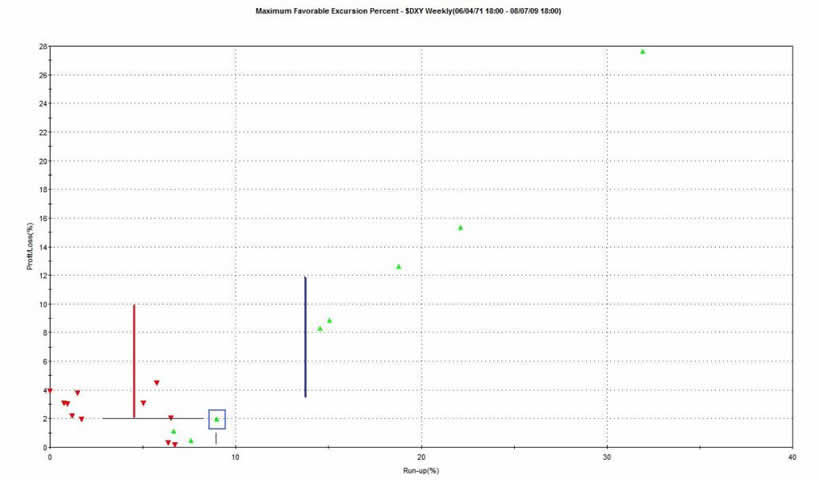
Looking at the graph, we see that 5 of the 14 short trades ran up greater than 14% before being closed out; these are the carets to the right of the blue vertical line. So think about that for a second. You short the Dollar Index based upon this pattern, and you have a 26% chance (5/19) of seeing prices fall significantly.
Taking it one step further, we see that 13 out of the 19 trades had an MFE greater than 5%; this is to the right of the red line. In other words, if there is a close below the 3 pivots, then there is an 68% chance (13/19) that the Dollar Index should fall at least 5%.
So when I state that the Dollar Index (symbol: $DXY) has a very high likelihood of embarking on a major down swing in the coming weeks I am basing this comment on these observations. But here is the real kicker in all this: 1) the average of all trades from this strategy lasts 37 weeks; 2) a losing trade will last on average 17 weeks; 3) a winning trade will last on average 65 weeks. We are only two weeks from the current sell signal.
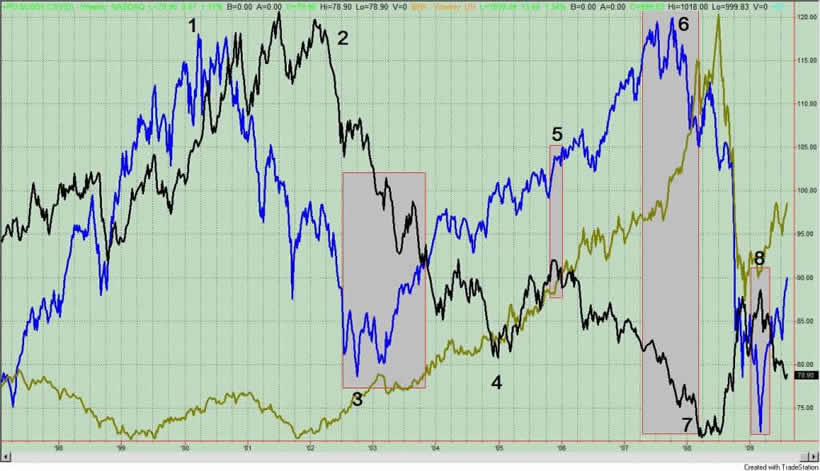
So think about this for a minute: if the Dollar continues in a down trend, there is a high likelihood of large losses and these losses should occur over the next year. This will likely keep a bid under equities for longer than most of us are expecting. Commodities will also be strong and should outperform equities. Let's add a third symbol to figure 1, and this is the CRB Futures Index (gold line). What we see and what we know is that in a falling Dollar environment, commodities will outperform. See figure 4. Equities will be hampered by real or perceived inflationary pressures as trends in commodities and long term Treasury yields rise. Equities will move higher in a falling Dollar environment, but their ascent should be a lot choppier. Furthermore, without real organic growth -marked by job creation and wage inflation and consumer spending outside of government subsidies- any economic recovery will always be questioned for its sustainability.
Figure 4. Commodity v. S&P500 v. Dollar Index
For now, the falling Dollar is the key asset class that is driving gains in commodities and equities. A lower Dollar will also benefit longer term Treasury yields. Over the next couple of weeks, I will update my thoughts on commodities and gold and long term Treasury yields. And I need to provide you with the information as to why equities will under perform commodities.
By Guy Lerner
http://thetechnicaltakedotcom.blogspot.com/
Guy M. Lerner, MD is the founder of ARL Advisers, LLC and managing partner of ARL Investment Partners, L.P. Dr. Lerner utilizes a research driven approach to determine those factors which lead to sustainable moves in the markets. He has developed many proprietary tools and trading models in his quest to outperform. Over the past four years, Lerner has shared his innovative approach with the readers of RealMoney.com and TheStreet.com as a featured columnist. He has been a regular guest on the Money Man Radio Show, DEX-TV, routinely published in the some of the most widely-read financial publications and has been a marquee speaker at financial seminars around the world.
© 2009 Copyright Guy Lerner - All Rights Reserved
Disclaimer: The above is a matter of opinion provided for general information purposes only and is not intended as investment advice. Information and analysis above are derived from sources and utilising methods believed to be reliable, but we cannot accept responsibility for any losses you may incur as a result of this analysis. Individuals should consult with their personal financial advisors.
Guy Lerner Archive |
© 2005-2022 http://www.MarketOracle.co.uk - The Market Oracle is a FREE Daily Financial Markets Analysis & Forecasting online publication.