Stocks Bear Market Pattern and the Battle for Financial Sphere Hegemony
Stock-Markets / Stocks Bear Market Sep 23, 2009 - 10:53 PM GMTBy: Joseph_Russo
 PROPHECY -
Or plausible consideration of cyclical relationships, and fractal repetition
If one embraces the notion that cycles exist within economies and financial markets, and that, progressions within cycles are fractal and of various size and degree, one must then conclude there is a dynamic level of general repetition continuously occurring across various timeframes. The footprints of such fractal repetitions record themselves continuously via data points plotted across the axis of price and time. They do so through recorded price chart data gathered throughout the course of history.
Furthermore, if one successfully employs and relies upon the use of price chart data to detect various trends in current market behavior, one is also likely to consider the utility in comparing similar relationships of past price pattern behavior with those of the present. Such endeavor provides a useful means by which to anticipate or narrow down a host of plausible future outcomes.
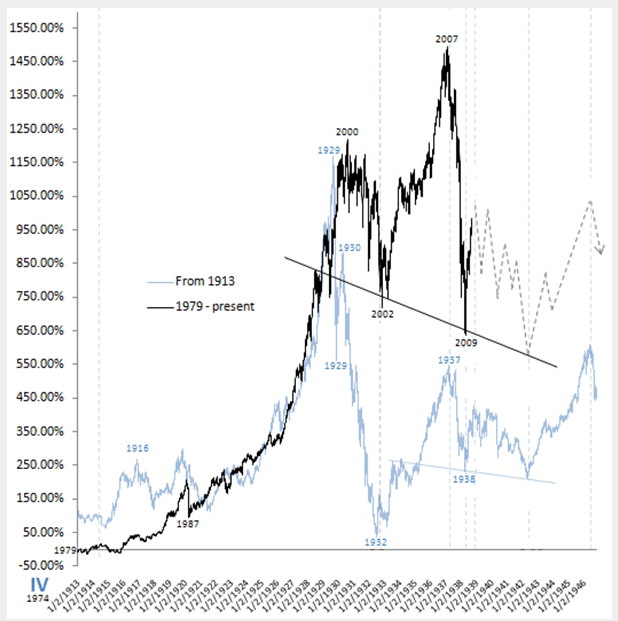
One such method is to employ the use of chart analogs that compare price behaviors of the past, which correspond best to those in the present. Analog an*a*log (noun) U.S CHEMISTRY A chemical with a similar structure to another but differing slightly in composition. Below is one such analog study of the Dow Jones Industrial Average.

The proprietary analog chart above correlates structure of the Dow Jones Industrial Average in relative percentage terms and price pattern behaviors from 1979 to present with those that had occurred in the 1913 through 1938 period.
One of the most compelling reasons for selecting the above data sets for analog comparison is the striking similarities in the parabolic 13-year advance from 1987 through 2000 when correlated with the eight-year parabola occurring in the 1921 through 1929 period.
Additional structures of confluence are the timing of near identical troughs occurring in 2002 and 1932, and the twin peaks taking place in 2007 and 1937. Lastly, we have compelling evidence of a correlating low in 2009 aligning itself with equal precision to the trough experienced in 1938. Given each of the data sets relative properties, it is clear that each contains similar structures but differ slightly in their composition.
Specific Turn-Months and Wave Count Analogs
Rather than just the “years” in which such turns occurred in the past relative to the present, subscribers to our premium advisory services have access to the specific point-to-point turn-months currently under observation within our active analogs. These proprietary analog charts zoom in from the key turn pivot at the March 2009 low, and compare the historical wave counts with modern-day counts, as the present thus far rhymes with the past in real time.
Does the above or any similar analog imply that peaks and troughs will continue to occur like clockwork going forward? NO. To prove this conclusively, all one need do is attempt to account for the five-years of difference between the 1987-2000 affair, with that of the 1921-1929 affair. In the grand scheme of things, these two parabolic spikes in price are strikingly similar but differ slightly in composition, and also by a factor of five years.
Further demonstrating structural similarities vs. any precision of exact repetition, is that despite sharing similar preceding structures, the rally from 2002 through 2007 registered a new all-time-high, while the broad rally from 1932 through 1937 did not. Nonetheless, we perceive there to be critical value in observing cyclical outcomes of the past relative to those of similar construct occurring in the present.
A 2009 / 1929 Analog would warn of potential DISASTER Dead Ahead
We discussed this in a previous brief titled “Plausible Reality”. If one were to align the initial 47% decline and subsequent 52% rally that took place in the 1929-1930 Dow with that of today’s similar 54%-decline and current Dow rally, which as of 22-September also rests 52% from its lows, one would then be prepared for a plausible WIPEOUT of approximately 89% in the next couple of years. Again, our subscribers are privy to unfolding wave counts and the precise turn-month correlations residing in each of our proprietary analogs.
Artificially Restrained From Natural Cleansing
A deep and thorough cleansing to the tune of 90% has been long overdue. Our statist shepherds of illusion have continually intervened (at any cost) over past decades to avoid such healthy cleansings. The further along they push the envelope of hubris, the higher the stakes become. They are now well past the point of no return, and have in essence bet the entire sovereignty of the U.S on their ability to maintain US-centric monopoly control of the entire global financial sphere. As matters continue to unwind in the fragile global rebalancing act forced upon them, they risk engendering a major revolution of one sort or another as a plausible outcome in the years and decades ahead.
The Grand Battle for Global Hegemony
In simplifying the grand scheme of things, the past 96-years of US-centric fiat dollar denominated global financial-sphere hegemony is duly under assault, and quite plausibly ending. In viewing final segments of the parabola from the 1987 crash low, one can observe three battles for maintaining such control growing larger in scope as the 21st century dawns. The first is barely visible occurring in 1998 with the LTCM collapse and Asian Currency Crisis. The statists won that battle as evidenced by the run to fresh highs in 2000. The second battle began following a more protracted threat after the dot.com crash and 911 attacks. A bigger threat required a bigger response, and that is exactly what the statists delivered. Centralized monetary authorities were again invincibly successful as evidenced in the recovery to fresh all time highs in October of 2007.
The panic of 2008 is the third and perhaps most devastating threat confronting the elite statist powers of the global financial sphere. By all measure and account, their artificial ponzi-credit financial system of monopoly control failed completely. Had they failed in executing the largest financial coupe in history to save their monopoly powers, the long overdue and much needed 90% percent cleansing was all but assured to unfold. Following a most egregious bailout coupe, the central authorities and their brethren are thus far back in control of their legacy monopolies.
In our view, they are now in the midst of an epic battle for their very survival and continued domination over the global financial sphere. Invincible and resilient as their triumphs attest over the past 75-years, they are now ALL-IN on an all-or-nothing bet that they would prevail once again in maintaining legacy control of their inordinate monopolies of money and credit creation.
Only time will tell, and there is plenty of time ahead from which this epic battle will no doubt continue until its ultimate resolution. We suspect that heightened conflicts and inflection points may occur into the 2012(13), 2021, and 2034 timeframes.
At such future junctures, it is likely that the charts will reveal the level of success and/or failure that the current statist powers are able to impose upon the globe. It is our hope that the ultimate prevailing outcome will adopt and enforce a free-market driven solution to replace the existing highly corrupt regime of elitist dominion over the global financial sphere.
Are you prepared to invest or trade amid such a potentially tumultuous long-term environment? Rest assured that we are, so join us in our ongoing quest to journal, forecast, and trade the greatest events in financial history yet to unfold.
For those who wish to obtain a visually graphic, easy to understand actionable guide to the various disciplines and real-time actions needed to achieve a broad array of objectives at every level of market engagement, look no further than Elliott Wave Technology’s PLATINUM publication. Those with a more narrow focus may select from the below list of PLATINUM’S three subsidiary sister publications.

Three More Options: GET ONE TODAY
1. The express focus of Elliott Wave Technology’s Near Term Outlook is to provide equity index traders with actionable guidance over the near and medium term.
2. Our Position Traders Perspective provides actionable guidance for longer-term time horizons.
3. EWT’s Day Traders Perspective assists short-term traders in executing proprietary methodology for capturing price moves of shorter duration.
Elliott Wave Technology’s PLATINUM 500 CHALLENGE:
In our effort to serve and empower as many individuals to trade profitably amid the sharks on the street, we will soon be announcing the availability of $500 PLATINUM service coupons. We shall award these incredibly generous service coupons to select individuals who apply and qualify for entry. We will let those interested know when entry applications for the challenge become available, and shall announce further details of the PLATINUM 500 CHALLENGE as they develop, so stay tuned. If you are interested in pre-qualifying, send us an email containing “PLATINUM 500 CHALLENGE” somewhere in the subject line or body of the email. We will place your email address on our secure list of PLATINUM-500 applicants, and keep you apprised of further developments and qualification criteria.
Until then,
Trade Better / Invest Smarter...
By Joseph Russo
Chief Editor and Technical Analyst
Elliott Wave Technology
Email Author
Copyright © 2009 Elliott Wave Technology. All Rights Reserved.
Joseph Russo, presently the Publisher and Chief Market analyst for Elliott Wave Technology, has been studying Elliott Wave Theory, and the Technical Analysis of Financial Markets since 1991 and currently maintains active member status in the "Market Technicians Association." Joe continues to expand his body of knowledge through the MTA's accredited CMT program.
Joseph Russo Archive |
© 2005-2022 http://www.MarketOracle.co.uk - The Market Oracle is a FREE Daily Financial Markets Analysis & Forecasting online publication.


