


Gold, Crude and Copper – Tis the Seasonal to be Checking
Commodities / Commodities Trading Oct 09, 2009 - 01:09 PM GMTBy: John_Winston

 As we move into another quarter it is always good to review the seasonal aspects of the market so as to have an idea what (on average) usually happens. The hard assets (and the paper ones too) have amassed quite a rally over the year.
Crude Oil Seasonal Trading
Crude Oil Seasonal Trading Contract
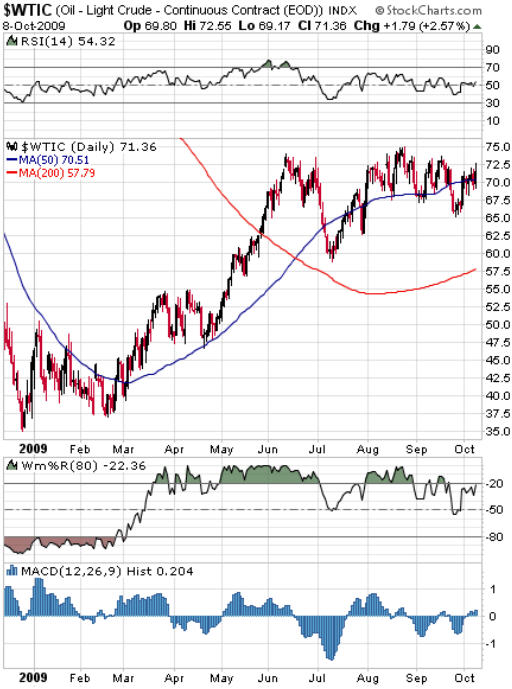
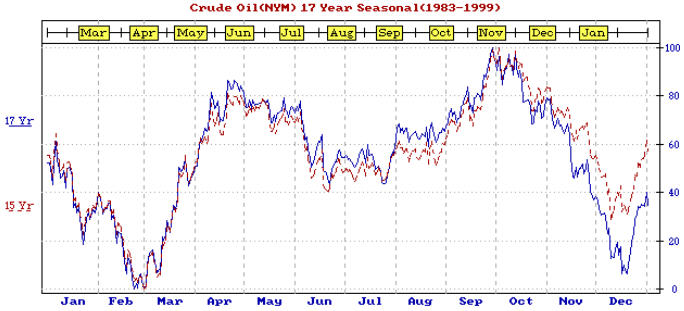
The top chart is the 17 year seasonal average for Crude Oil. And right below it, we have the Light Crude Continuous Contract. As we can see, on average, Crude usually bottoms in the middle to end of February. When we look at the chart, we can see that while crude made its low at the beginning of the year, it remained in a consolidation until the end of February and then Bottomed. Coinciding with that bottom, we can see that the % R oscillator finally came out of oversold area, and the MACD histogram began to register bars above the zero line. By the beginning of March, oil had turned up, the 50 day moving average was overcome, and the seasonal low was in place.
Next we look at the seasonal and see that April is the next peak, but that price moves only sideways to a bit lower until May, where a correction begins and last into July.
On the Crude chart, we can see that the rally did in fact PEAK in APRIL and it moved sideways into May. But instead of continuing lower into June and July, a COUNTER SEASONAL rally developed and when MARKETS don’t do what they are supposed to, a strong rally catches the crowd on the wrong side of the market (like stocks this year).
However, we see that a selloff into the JULY period did indeed happen……..albeit from a higher level. The point is the seasonal pull still produced a July low and that selloff was a decent one.
Now if we go back to the seasonal, we see that a PEAK IN PRICE IS DUE HERE. (The bottom of the chart is time; the top yellow months are CONTRACT months) We can see that the most likely time for Crude to develop a correction is this time of the year. We can see that PRICE is being influenced by this seasonal as crude has been going sideways most of the month and seasonally is ready for a good pullback.
A normal pullback would see Crude at the 47 to 54 area sometime this winter. AS LONG AS MACD histogram keeps rising and %R is above 80, and RSI moves above the 50 area, the rally can continue. %R recently came out of 80, and MACD is barely above the zero area. Combine that with RSI right at 50 and the odds suggest this market is about to make its move in the next two weeks one way or another.
Here’s what to look for. If Crude remains strong (weak US DOLLAR) instead of turning down here, Crude would break the old highs and start another leg, probably into November. I believe it will have a lot to do with what the Dollar does, but there are so many other wild cards (Iran) that projections can be difficult. And I think the sideways action speaks to that.
Should crude hurdle above 77, odds will favor a seasonal delay. On the other hand, if crude were to break below the 50 day average, then the lows of September, then the odds would favor the seasonal being underway.
Next up we will look at the copper market as it is so important to the global growth of the world although not a precious metal, it is good to keep an eye on it.
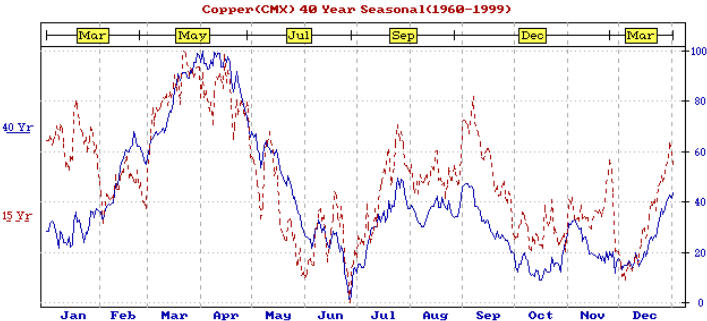
We can see by the seasonal chart below that copper also is a September candidate for a pullback into the October area, then an end of month blip to November and finally a December low.
Copper Seasonal Trading
Copper Seasonal Trading Contract
The seasonal chart shows that like Crude, copper has a high point in April and a pullback to the July period. Copper is much more PRONOUNCED but the timeframes are similar.
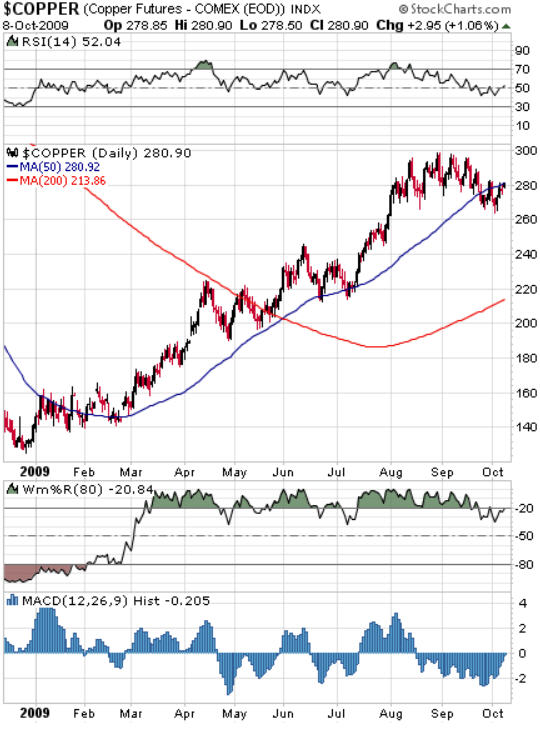
Like crude, copper peaked in April and ran sideways until the May period, pulled a June high, and a July low. And just like crude, copper ran up into September, and has gone sideways. And just like crude was stronger than expected, so was copper. But each has followed the seasonal ebb and tide that its average has established over the years. Coppers technical picture also shows a %R reading that has just dropped out of the 80 range, and MACD histogram is right at the zero line. For the first time in quite a while, RSI has dropped below 50 and has recently made its way back to 50.
It would seem that copper is at a turning point too and the direction should be established within the next few weeks. Above 310 and copper too could be heading higher one more time before the fall correction begins. Below the 260 area and the correction should be in full bloom. We suspect that both commodities will follow each other.
Now let’s look at the gold seasonal. First the gold chart, then the seasonal.
Gold Seasonal Trading
Gold Seasonal Trading
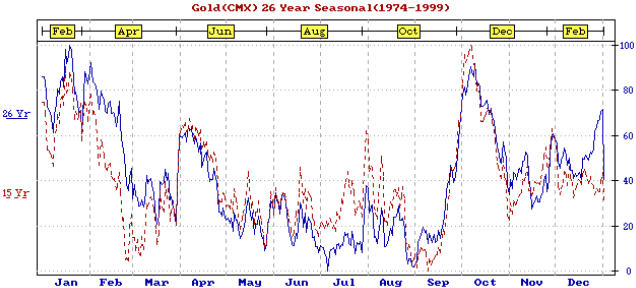
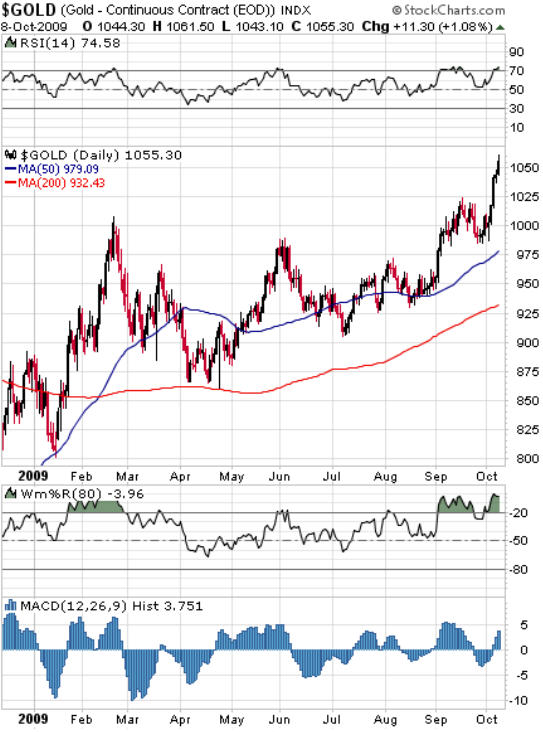
Gold has followed the seasonal pattern very close this year. We can see that a major price peak occurred in mid February right on time, and that a late March bounce to April and a correction to May took place. LIKE crude and copper, the May to JUNE period was a much stronger seasonal upward bias as is the average. We can see by the chart that the gold market usually explodes in September and then has a peak in early October and a sizeable correction into the November or December time frame. Price is usually choppy until December.
Unlike the other commodities, gold’s technical condition is still in BULLISH mode……..although one can make a case that RSI is flashing OVERBOUGHT. We would agree, but we think that %R must drop below 80 and the MACD histogram bars need to stop RISING first.
These commodities have pretty much followed themselves from an ebb and flow standpoint. Copper seems to have been the most persistent rise.
These markets have pretty much followed each other this year and the time has come when all of the seasonal trends seem to favor the downside. Not that they will, but the odds favor a correction to begin sometime between now and November. The stronger the commodities are, the longer before the correction starts. Oil and Copper have already turned over and seem to be waiting for gold to complete its up move. Ok, one more chart.
USD Dollar Seasonal Trading
USD Dollar Seasonal Trading Contract
Yes………it’s the US DOLLAR.
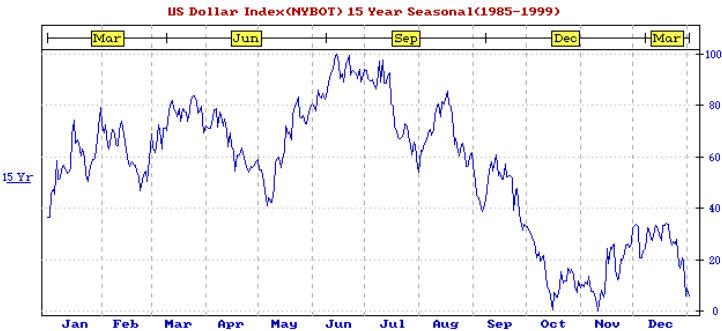
We can see that the year started out right. The dollar made a strong seasonal high in March right on its seasonal schedule. And that is when things turned. The stock market bottomed, and so did crude oil a few weeks before that.
We can see a CONTRA SEASONAL that began in mid April. Instead of moving higher to June the US Dollar collapsed. As stated earlier, this is usually what happens when a contra seasonal appears. The trend becomes strong as market participants are not positioned as they usually are.
It’s been pretty much down since then for the US Dollar.
Conclusions:
If you’ve been having difficulty understanding market behavior lately, these charts suggest to me that the analysis is already what we all know. ALL MARKETS RUN COUNTER TO FUNNY MONEY. Can you imagine calling the US Dollar funny money? That is what it has become. Actually, it’s become UNFUNNY money as the situation is serious.
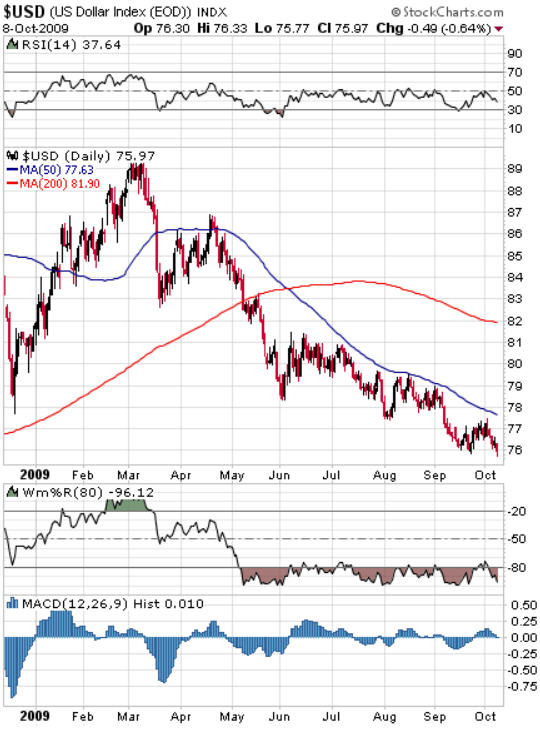
Look at how long it has stayed OVERSOLD as % R just can’t come out of bearish mode. If you’re saying to yourself, hey, this looks like an EKG of someone who has died your close.
So while the dollar trend is clearly down, there will be at the very least a dead cat bounce. Therefore, we should expect a 4-6 week reprise in the dollar as the seasonal chart suggests. Seeing that the first October period in the dollar seems completed with that little October bounce, odds favor that the commodities correction in gold and even in crude or copper might not arrive until the mid November time frame.
Whenever the time frame arrives we should see the US dollars technical condition show %R come out of oversold, RSI begin to rise again (NOTICE THE HUGE DIVERGENCE THERE as RSI has not made a new low with price) and for MACD histogram to hold the zero level and put in a higher bar. At that point in time, the gold, crude and copper market should begin their autumn correction for a brief time before the next leg down of the dollar begins. Keep an eye on these subtle clues and when you see them it will give you a clue that a short term bounce of 4-6 weeks and a subsequent commodities pullback is probably near.
If things play out, these commodities will take a breather and then resume their trend near year end.
If you would like to receive Free Gold Analysis please visit my site: www.TechnicalCommodityTrader.com
By John Winston
John Winston is the technical commodity trader analyst. He provides detailed technical analysis for popular commodities like gold, silver, copper, oil, and natural gas. By focusing strictly on these commodity price movements trading become strictly technical and simple to trade. His free trading reports are available at his website: www.TechnicalCommodityTrader.com
Contact John at: Info [@] TechnicalCommodityTrader.com
© Copyright John Winston 2009
Disclaimer: The above is a matter of opinion provided for general information purposes only and is not intended as investment advice. Information and analysis above are derived from sources and utilising methods believed to be reliable, but we cannot accept responsibility for any losses you may incur as a result of this analysis. Individuals should consult with their personal financial advisors.
© 2005-2022 http://www.MarketOracle.co.uk - The Market Oracle is a FREE Daily Financial Markets Analysis & Forecasting online publication.