


Stock Market Indicators Are Screaming SELL, But...
Stock-Markets / Stock Index Trading Oct 25, 2009 - 03:51 PM GMTBy: Andre_Gratian

 Current Position of the Market
SPX: Long-term trend - Down! The very-long-term cycles have taken over and if they make their lows when expected, the bear market which started in October 2007 should continue until 2014. This would imply that much lower prices lie ahead. This will not be a straight-down decline, but will consist of a series of intermediate-term rallies and declines until we have reached the low point.
SPX: Intermediate trend - "The intermediate move which started in March may be coming to an end, but signals are mixed. It is possible that we will end up with just a correction in an uptrend." That was in the last newsletter! Since then, we have gone fractionally higher and technical conditions have deteriorated a little more, but perhaps not enough to bring us to a top of intermediate nature just yet.
Analysis of the short-term trend is done on a daily basis with the help of hourly charts. It is an important adjunct to the analysis of daily and weekly charts which determines the course of longer market trends.
Daily market analysis of the short term trend is reserved for subscribers. If you would like to sign up for a FREE 4-week trial period of daily comments, please let me know at ajg@cybertrails.com .
Overview:
The yellow flags that have been flying for a while are turning red. Some components for an intermediate top are still missing, but there are plenty of negatives that must be acknowledged. A loss of upside momentum is quite evident, especially in the breadth indicators. Also, with a high of 1101, we have essentially reached the target of 1109 that had been projected for this phase.
An inversion of the 22-wk cycle which was due on 10/13 initially looked like a good date for the top but, with favorable key earnings reported a few days afterwards, the rally extended to the next turn of the Bradley Siderograph which was projected for 10/21-10/23. We made a high on the 21st at 1101.36 which was tested on the 22nd, and reversed again on the 23rd.
Although we have no conclusive sell signal, considering the state of the indicators and the cyclical configuration into early to mid-November, it looks as if we are on the verge of one.
A decline to 1050 may be low enough to get our daily indicators back into a buy position, but if we continue and go beyond 1020, it will be a sign that we have a more significant top in place.
If this turns out to be only a another short-term top, there are some indications that we could make an intermediate high in December. Any top in this time frame would correspond to the peak of the 4-yr cycle which made its last low in July 2006 and will be due to bottom again in 2010.
One of the reasons this makes sense is because the final bear market low is estimated to be 2014, in conjunction with the 120-year cycle low, and another 4 years from next year's low.
What's ahead?
Chart Pattern and Momentum
The Weekly chart continues to make progress within its wedge pattern, still looking for a "C" wave top which might have been found last week. It has crawled steadily up along the top trend line (red) but now, the bottom indicator is having trouble keeping up and is beginning to show some signs of divergence. The top indicator is getting ready to cross lines while the histogram goes in the red.
There is no question that we are losing momentum and, by next week, we may be able to remove the question mark next to the "C". However, I would not be surprised if this pattern evolved into an A-B-C-D-E formation. I still don't see all the signs that I need for an intermediate top.
On the Daily chart (below) the divergence is more apparent. The three indicators have turned down after making lower highs while the price chart has made a new high. The negative divergence could not be more obvious, and since the indicators are still in a downtrend, we have to suspect that there is more to go.
Note that we are still trading above the primary trend line (green) as well as the 34 and 50-day MAs. If we are making a significant top, we should break below all of these as the decline progresses. It would become an even more important correction if we were to break below the 1020 level, and setting us up for an initial target to 981, a 50% retracement of the move from the July 869 low.
The preferred time target for a low is about 11/16, the next low of the 30-day cycle.
The Hourly chart (above) is full of gaps which do not exist in reality. This is due to faulty transmission by the data provider and may not be fixed for some time, so I have to use it as is, but it should not hamper our analysis.
It shows a little double-top followed by a penetration of the last low, and a failed attempt to get back into an uptrend followed by another decline to a slightly new low.
The index has come out of its channel and has now made a lower low, followed by a lower high and another lower low. It has also broken and closed below its three moving averages. This should be enough to signal the start of a declining trend, but we need to move below the daily MAs and the main trend line for a confirmed sell.
Cycles
An 8-day cycle bottomed near the close of Friday and caused a little bounce. Another short-term cycle is due in the early part of the day on Monday, and should bring us back down, then another bounce. The 13-day cycle bottoms on Wednesday, and should keep the decline going. But the main cycle which should be pulling us down at this time is the 30-day cycle which has apparently topped and should keep prices moving to the downside until about November 14, providing the next short-term low.
Projections:
There was a valid upside projection to 1109, but we could not reach that level and have apparently topped at 1101.
Gaps are price attractors, and the gap created between 1074 and 1078 on 10/14 was finally filled this past Friday, and this may have put the index into a downtrend. If so, the next projection is about 1060 and then 1050. If we keep moving down into the 30-day cycle and break below 1020, we can reach 981 before we are ready for a reversal.
Breadth
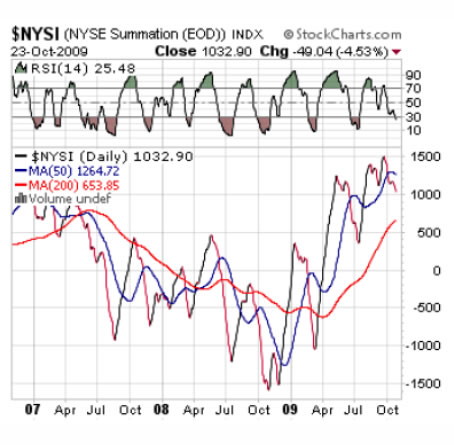
The NYSE Summation index (courtesy of StockCharts) has weakened significantly in the past two weeks, and it has started a downtrend by breaking below its former low. Note that this is the first time that it has done this since the beginning of its uptrend, and it should be a concern for the health of the current price uptrend from the March low.
Market Leaders and Sentiment
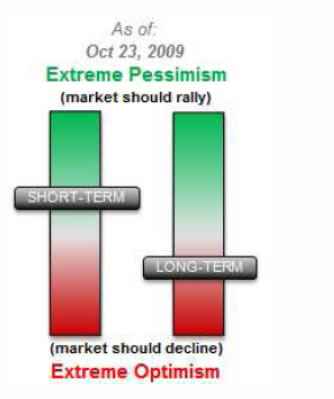
The sentiment indicator (courtesy of Sentimentrader) is one reason that I cannot get too bearish, just now. It seems to signal an imminent short-term low and not much of a readiness for an intermediate high. Let's let the market speak in the next few days.
This is an interesting chart! Recently, the dollar has been the mirror image of the SPX. It has been trying to bottom for some time, but every time that it approaches the top trend line of its small, last, down channel, it has gotten pushed back. Considering the huge positive divergence and the 5 of 5 structure (?), maybe it won't this time.
Summary
We have the same problem as before! Some indicators are screaming: "Sell!", but the sentiment indicator reading does not convince me of an important high.
Also, there is some credible projection for the QQQQ to move up to 46 before it has finished its move. Perhaps we have a short-term correction followed by a final wave to about 1150 on the SPX.
Let's keep all our options open!
The following are examples of unsolicited subscriber comments:
Awesome calls on the market lately. Thank you. D M
Your daily updates have taken my trading to the next level. D
… your service has been invaluable! It's like having a good technical analyst helping me in my trading. SH
I appreciate your spot on work more than you know! M
But don't take their word for it! Find out for yourself with a FREE 4-week trial. Send an email to ajg@cybertrails.com .
By Andre Gratian
MarketTurningPoints.com
A market advisory service should be evaluated on the basis of its forecasting accuracy and cost. At $25.00 per month, this service is probably the best all-around value. Two areas of analysis that are unmatched anywhere else -- cycles (from 2.5-wk to 18-years and longer) and accurate, coordinated Point & Figure and Fibonacci projections -- are combined with other methodologies to bring you weekly reports and frequent daily updates.
“By the Law of Periodical Repetition, everything which has happened once must happen again, and again, and again -- and not capriciously, but at regular periods, and each thing in its own period, not another’s, and each obeying its own law … The same Nature which delights in periodical repetition in the sky is the Nature which orders the affairs of the earth. Let us not underrate the value of that hint.” -- Mark Twain
You may also want to visit the Market Turning Points website to familiarize yourself with my philosophy and strategy.www.marketurningpoints.com
Disclaimer - The above comments about the financial markets are based purely on what I consider to be sound technical analysis principles uncompromised by fundamental considerations. They represent my own opinion and are not meant to be construed as trading or investment advice, but are offered as an analytical point of view which might be of interest to those who follow stock market cycles and technical analysis.
Andre Gratian Archive |
© 2005-2022 http://www.MarketOracle.co.uk - The Market Oracle is a FREE Daily Financial Markets Analysis & Forecasting online publication.