


Weekly Gold and Silver Technical Analysis Report - 29th July 2007 - Technically Precious with Merv
Commodities / Gold & Silver Jul 29, 2007 - 11:44 AM GMTBy: Merv_Burak

So, this is what it looks like when you go over the cliff. Danger, professionals at work, do not try this on your own. With a future's volume of over 253,000 on Thursday (the highest daily volume in my 20 years of data), these must be the “professionals” all following the leader like lemmings.
Who's the Boss?
No sooner does one revert back to the bullish side (as I did last week) but the market slaps him on the fingers and shows him who's the boss. The market is just not listening to those of us who would like to see higher gold prices.
GOLD : LONG TERM
The long term P&F chart is still in a bullish mode and with the X 's and O 's from the latest action providing more volatility to the chart we now need only to go to the $630 level to reverse to the bear, but that is still some distance from here. Even another week like the past one would not get us there so we may be safe for another few weeks.
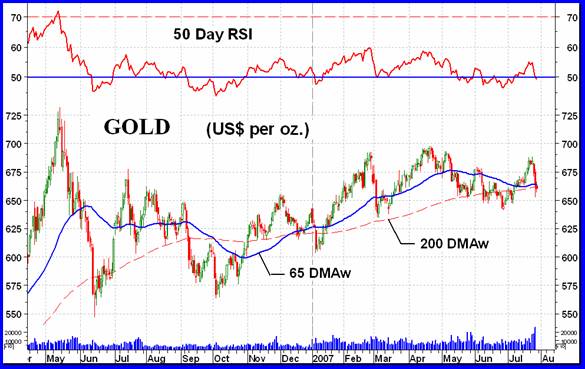
As for the usual indicators, Friday's close placed gold just below its weighted 200 DMAw but still above the popular simple 200 DMA. Both moving averages are still pointing in the upward direction although the weighted average is only slightly positive. The long term momentum indicator continues weak but is still in its positive zone. The daily version of the indicator is below the 52% level, which is only slightly above the 50% neutral line. Another week like the past one and this indicator could be right on top of the neutral line, or maybe even slightly below. As for the volume indicator, it is below its trigger line and the trigger line is pointing lower.
With the action of the past week one would be very courageous, or foolish, to maintain a bullish long term position BUT the indicators have not yet turned around so one cannot go bearish yet. I will downgrade my position, but only slightly this week, to the + NEUTRAL level, which is one level (out of 5) below all out bullish.
INTERMEDIATE TERM
The chart on the next page shows gold action over the intermediate/long term period. There are some interesting features in this chart that I had not noticed before, or had not commented upon. The most interesting and potentially the most negative feature in this chart is the daily volume action, especially since the beginning of this year. The daily volume is noted as vertical bars at the bottom of the chart.
Immediately after the plunge in May-June of 2006, as the price was tracing a somewhat lateral path, the volume action dried up. For 6 to 7 months the volume was relatively low. Then at the beginning of this year the volume started to perk up. The price had moved higher somewhat and the volume increased. Then the price action once more took a lateral trend at a slightly higher level then last year. During this new lateral trend the volume action increased significantly. Increased volume action with a lateral price trend, especially with a higher price range than previous, is not normally a good sign. It is too often a sign of quiet distribution by professionals resulting in a topping activity.
This past week might have been a wake-up call with the price dropping precipitously and volume action increasing. In fact, as mentioned at the beginning of this commentary, Thursday's volume was the highest single day's volume in my 20 year daily data base. This volume was accompanied by an $11 drop in price. Not good at all. We can normally expect a rebound of sorts after a sharp plunge but the longevity and magnitude of such rebound is difficult to guess ahead of time. At this stage I would be very suspicious of any rebound turning into a new bull move. After a serious deterioration such as this past week the market needs some time to get its act together again. Of greater concern is the serious possibility that this “sudden” down turn of events will just continue in the negative direction.
The intermediate term P&F chart had a sharp up direction and a sharp down direction but these two vertical directions were not enough to cause a trend change. The chart is still in a bullish mode and until some more lateral movement occurs to provide us with better lows to break we would require a move to $640 for the intermediate term P&F to turn bearish.
As for the normal indicators, the price closed below its intermediate term moving average line and the line is sloping downward. Momentum, still in a basic lateral trend as it has been for a year, has moved below its neutral line for a negative reading. The Thursday action pushed the volume indicator once more below its trigger line with the trigger in a negative slope.
Although most of the indicators have turned negative they are only slightly so at this time. With a still bullish P&F chart going bearish is not yet in the cards but staying bullish is not either. I am downgrading the intermediate term to NEUTRAL for this week and see what happens next.
SHORT TERM
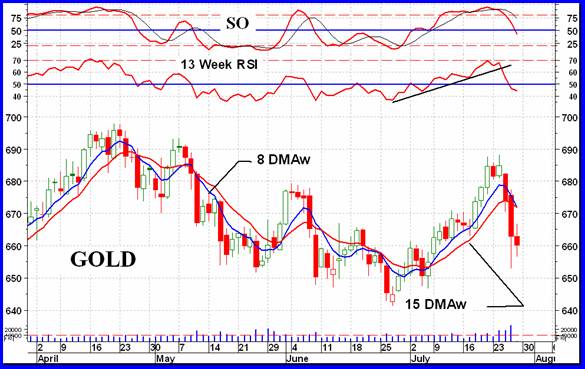
See chart on the next page. Gold took a sudden turn for the worst this past week. Although one can expect a short recovery or bounce after such action it is difficult to predict when such bounce will start. Is there more downside first or is the bounce ready to go? As can be expected all indicators turned negative after such violent move. So, staying with the trend in motion I must stay with the down side for the next short term. A one or two day bounce would not be unexpected but at the present time it would not be expected to change the basic short term direction.
IMMEDIATE TERM
Boy, this is really a coin toss as to what the market is expected to do on Monday and Tuesday. Only a guess but I will go with a bounce but not one with any longevity. At this time I don't think the bounce would break above the very short term moving average line (8 DMAw) least of all turn the line back to the up side. However, with volatility there is always the unknown.
NORTH AMERICAN GOLD INDICES
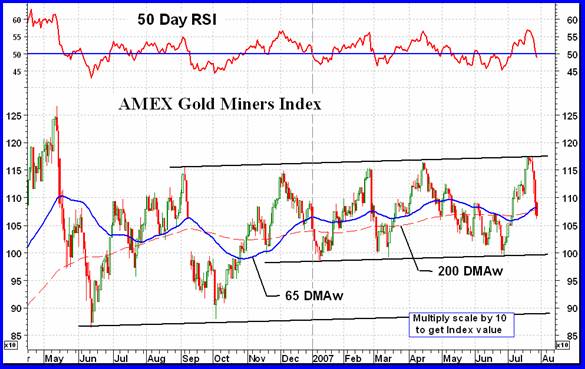
This week we look in on the AMEX Gold Miners Index. It was a disaster all around, even the major Indices took a deep hit. Since the original plunge in May-June of 2006 we have had five of these “over the cliff” moves in the Gold Miners Index, some as steep, some not quite as steep but all sharp over the cliff moves. As the chart shows, we have a support established by the bottoms of the past three moves. Now, will this move halt there or continue lower? Or maybe not even reach the support? The Index move over the past year has been basically a lateral move without any discernable strength upwards or downwards. Momentum so far is no real help. Usually the momentum indicator will give us some advance warning of building strength in one direction or another. Here, we have a lateral momentum same as the price and no real help. Maybe what this all is telling us is that the lateral trend has some more to go before the market decides which major direction it wants to move next.
MERV'S PRECIOUS METALS INDICES
Last week we had the Merv's Composite Index of Precious Metals Indices move just a hair above its previous potential double top level. The move was not yet decisive and the momentum indicator was not confirming the move. This week we find out why. The Composite Index fell by 6.7% during the week taking it back to just about the mid-point of its past several months of movement. Momentum has been weak but positive and in a lateral trend for the past year. It has dropped to just above its neutral line. The Index itself has closed the week just below both its intermediate and long term moving average lines. The long term is still sloping upwards but the intermediate term turned downward with the week's action. I would be inclined to rate the Index as NEUTRAL for both time periods as it is not overly bullish or bearish yet.
MERV'S GOLD & SILVER 160 INDEX
Probably the best Index to understand what the overall universe of gold and silver stocks are doing, the 160 Index closed lower by 6.4%, one of the least worst performers during this week of poor performers. Although the majors lost on average about 8.6% what the 160 is telling us is that the speculative stocks, although also on the down side, were not as great losers as the quality stocks were this past week. As the historical data I published some time back showed, on the down side both the quality and speculative stocks lost about the same amount. One might close much lower than the other one week and then the other catches up on the following week but through a full bear cycle they both loss about the same % wise.
The 6.4% decline in the Index does not adequately illustrate the slaughter that occurred in the stocks. We had only 19 stocks close higher (12%) while 136 closed lower (85%). This is a high negative ratio of over 7 declines for every one advance. In addition the summation of individual stock ratings took a deep hit during the week. All three time periods are back in the BEAR camp with the short term BEAR rating at 60%, the intermediate term at 53% and the long term at 58%. Finally, on a somewhat brighter note (I hope), although there were plenty of double digit losses during the week there was only one stock in my speculation category of plus/minus 30% movers and that, of course, was on the minus side. With only one such speculative loss the week's activity was still not of a panic nature. Hopefully, that would mean that there may not be much more down side ahead but one should never assume so.
As for the chart and indicators, both time periods, the intermediate and long term, are just at the junction of turning negative or have just barely done so. The Index closed just below its intermediate term moving average line and the line just turned very slightly negative. Intermediate term momentum just barely crossed into its negative zone. As for the long term, the Index also just closed below the moving average line but the line is still slightly positive. Long term momentum is just above its neutral line but heading lower. In both cases the indicators are just not strong enough to go either bullish or bearish. For this week NEUTRAL is the best rating.
MERV'S QUAL-GOLD INDEX : MERV'S SPEC-GOLD INDEX: MERV'S GAMB-GOLD INDEX
This week the sectors performed opposite to their quality. The highest quality Qual-Gold Index had the largest loss at 9.1% while the Gamb-Gold Index had the least loss at 6.2%. The Spec-Gold Index was at the same level with the Gamb-Gold with a 6.3% loss. ALL of the Qual stocks closed lower during the week suggesting a general dumping of gold stocks by the professionals and institutions who invest in this sector. The speculative variety, the kind most of the masses speculate in, were also sold but there were at least a few winners in these sectors. The Spec-Gold Index had 4 winners (13%) and 26 losers (87%) while the Gamb-Gold Index also had 4 winners (13%) and 25 losers (83%). As for the summation of individual stock ratings, well, here all of the Indices in all of the time periods are now in the BEAR camp.
The week's action in the sectors sure reversed a few good weeks of upside activity. The charts and indicators have mostly reversed their message and are now mostly in the negative. One general bright spot, although very weak and getting weaker, are the long term momentum indicators for the sectors. All are still in their positive zones but heading lower. In addition the Gamb-Gold Index still is in the bullish camp for both time periods. The other Indices can be classified as either bearish or – NEUTRAL for their chart ratings.
SILVER
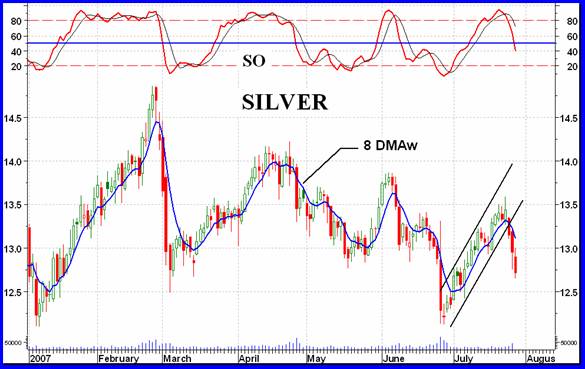
Looking at an aggressive chart of silver one notices that during this year we have had four peaks in the silver price and four lows. During each low the Stochastic Oscillator (SO) had moved into its oversold zone. Each subsequent rally started with the SO turning back to the up side and crossing back above its trigger line and oversold line. As for the four peaks, they were each at succeeding lower highs. Although each high was lower than the preceding one in each case the SO had moved into its overbought zone. In each case the down turn started with the SO dropping below its trigger line and below its overbought line. Although the price of silver may continue for some time in its trend while the SO may remain in its overbought or oversold zone it is safe to say that short term traders are taking extra risk in trading commitments after the SO has entered either zone.
We are back to one of the down drafts and expect to see silver at new 2007 lows before the next rally, if all goes according to the profile of the past several months. Again, one would look for the SO to enter the oversold zone and wait for a new rally to get going with the SO recovering above the oversold line.
MERV'S QUAL-SILVER INDEX : MERV'S SPEC-SILVER INDEX
As with all of the other Indices the silver Indices took a drubbing during the week. Of the seven Merv's Indices the Merv's Qual-Gold Index had the worst weekly performance with a loss of 9.2% while the Merv's Spec-Silver Index had the best performance with a loss of 5.2%. That doesn't sound right saying “best performance” and 5.2% LOSS. Oh well, that's the way it goes. All 10 stocks in the Qual Index closed lower while we had 4 gainers (16%) and 19 losers (76%) in the Spec Index. As one can expect from the week's performance all of the summation of individual stock ratings are in the BEAR camp this week.
As with the gold Indices indicators the long term momentum indicators are still in the positive zone but moving lower. The intermediate term Spec-Silver momentum is also still positive. All other indicators are in their negative zones and moving lower. Based upon the charts and indicators I would rate the Indices are follows. The Qual intermediate term as BEARISH. The Qual long term and Spec intermediate term as – NEUTRAL and the Spec long term as NEUTRAL. Let's see what this coming week brings.
Merv's Precious Metals Indices Table
Well, that's it for this week.
By Merv Burak, CMT
Hudson Aero/Systems Inc.
Technical Information Group
for Merv's Precious Metals Central
Web: www.themarkettraders.com
e-mail: merv@themarkettraders.com
During the day Merv practices his engineering profession as a Consulting Aerospace Engineer. Once the sun goes down and night descends upon the earth Merv dons his other hat as a Chartered Market Technician ( CMT ) and tries to decipher what's going on in the securities markets. As an underground surveyor in the gold mines of Canada 's Northwest Territories in his youth, Merv has a soft spot for the gold industry and has developed several Gold Indices reflecting different aspects of the industry. As a basically lazy individual Merv's driving focus is to KEEP IT SIMPLE .
To find out more about Merv's various Gold Indices and component stocks, please visit www.themarkettraders.com and click on Merv's Precious Metals Central . There you will find samples of the Indices and their component stocks plus other publications of interest to gold investors. While at the themarkettraders.com web site please take the time to check out the Energy Central site and the various Merv's Energy Tables for the most comprehensive survey of energy stocks on the internet. Before you invest, Always check your market timing with a Qualified Professional Market Technician
Merv Burak Archive |
© 2005-2022 http://www.MarketOracle.co.uk - The Market Oracle is a FREE Daily Financial Markets Analysis & Forecasting online publication.