


Brazilian Bovespa and EWZ Stock Market Analysis
Stock-Markets / Brazil May 04, 2010 - 01:24 PM GMTBy: Guy_Lerner

 On February 4th, I wrote that the Brazilian Bovespa was "dead money", and nothing since that time has changed my mind as Brazil, as measured by the i-Shares MSCI Brazil Index Fund (symbol: EWZ), has lagged the S&P500.
See figure 1 a monthly chart of the Brazilian Bovespa Index. Pink labeled price bars are negative divergence bars, and as I have shown many times before (click here and here for links), a cluster of negative divergence bars is a sign of slowing upside momentum. On the monthly charts, it is a reliable signal of a bull market top across multiple assets classes.
Figure 1. Brazilian Bovespa/ monthly
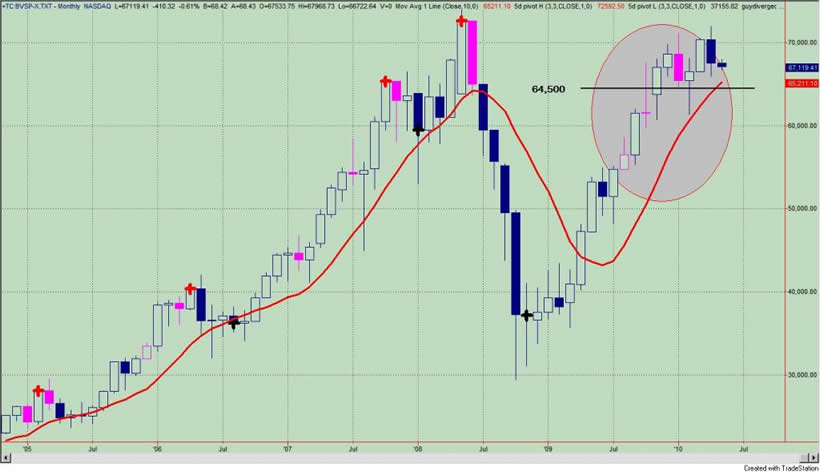
A monthly close below 64,500, which is the low of the negative divergence bar, would be very bearish for the Brazilian Bovespa, and essentially this would change the "call" from "dead money" to bear market.
Figure 2 is a daily chart of the i-Shares MSCI Brazil Index Fund (symbol: EWZ). First note the series of lower highs (i.e., down red arrows). While the S&P500 was making higher highs, the EWZ was making lower highs. This is not what you want to see from the market that represents one of the strongest economies in the world. Support comes in at the $63-65 level as shown by the key pivot points. A definitive close below these levels will likely see prices make a deeper and more significant pull back to the $50 level. This would represent a 50% haircut from the highs.
Figure 2. EWZ/ daily
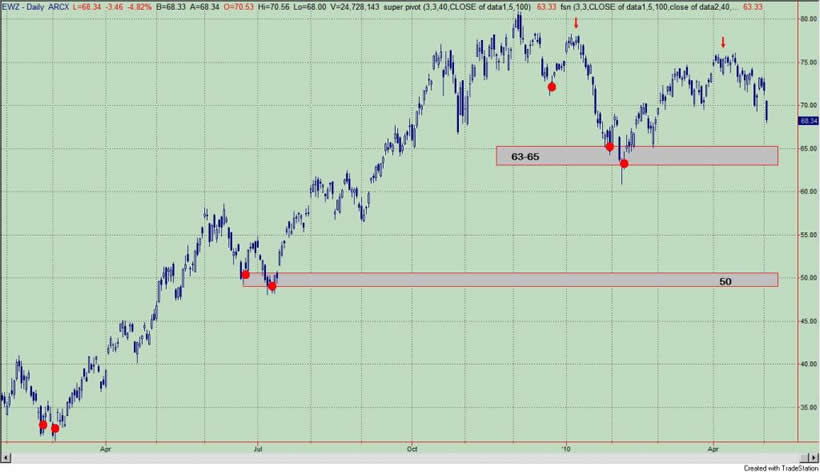
For now, if the sell off continues beyond the "typical" 1 day period, I would look for a bounce at the first level of support. This is a little less than 10% away.
By Guy Lerner
http://thetechnicaltakedotcom.blogspot.com/
Guy M. Lerner, MD is the founder of ARL Advisers, LLC and managing partner of ARL Investment Partners, L.P. Dr. Lerner utilizes a research driven approach to determine those factors which lead to sustainable moves in the markets. He has developed many proprietary tools and trading models in his quest to outperform. Over the past four years, Lerner has shared his innovative approach with the readers of RealMoney.com and TheStreet.com as a featured columnist. He has been a regular guest on the Money Man Radio Show, DEX-TV, routinely published in the some of the most widely-read financial publications and has been a marquee speaker at financial seminars around the world.
© 2010 Copyright Guy Lerner - All Rights Reserved
Disclaimer: The above is a matter of opinion provided for general information purposes only and is not intended as investment advice. Information and analysis above are derived from sources and utilising methods believed to be reliable, but we cannot accept responsibility for any losses you may incur as a result of this analysis. Individuals should consult with their personal financial advisors.
Guy Lerner Archive |
© 2005-2022 http://www.MarketOracle.co.uk - The Market Oracle is a FREE Daily Financial Markets Analysis & Forecasting online publication.