


Just Sell Something, Please!
Stock-Markets / Financial Markets 2009 Nov 17, 2009 - 08:57 AM GMTBy: Guy_Lerner

 The act of selling cannot be underestimated. Selling is just as important as any other decision (i.e., buying or money management) involved in trading, but it seems to get less attention in the world of market punditry. I guess it is just better for the ego to say, "I was there. I bought XYZ stock at the bottom tick." However, a buy recommendation is only good if you sell some time later at a profit, and of course, we want that trip from the buy to the time we sell to be accompanied by a tolerable draw down.
Buying the bottom tick and selling the top tick are noble, but unrealistic goals. Of course, we can try for perfection or more realistically, we can try to determine when there might be a good time to sell. This helps to capture profits (or avoid losses) and make the most of our time in the markets.
One of the strategies that I use is to determine when to sell is to look at negative divergences. Why use negative divergences? Negative divergences tend to show up at market tops, and their presence is a sign of slowing price momentum.
I presented this concept before in an article on the 10 year Treasury yield, which was written on June 15, 2009. First, I determine the presence of negative divergences between an oscillator that measures price and price itself. Then, I count the number of negative divergences that occur over a 13 week period. This produces the indicator in the bottom panel of figure 1, which is a weekly graph of the yield on the 10 year Treasury bond (symbol: $TNX.X). Negative divergences are noted by the pink markers on the price bars.
Figure 1. $TNX.X/ weekly
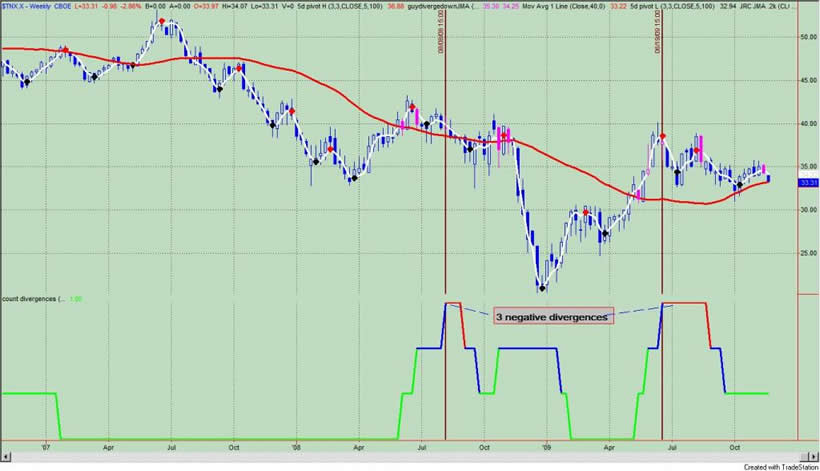
When there are 3 or more negative divergence bars occurring over a 13 week period, the indicator flashes red, and as you can see, yields on the 10 year Treasury are better sold than bought. In fact, the recent sell signal occurred at a yield of 3.789%, which is the second highest closing yield in the last 22 weeks. Good timing!
More importantly and for our purposes of determining a window or good time to sell, this pattern of multiple negative divergences is consistent enough across multiple assets over the past 90 years. It warrants our attention. Does this pattern identify every market top? No. Remember, I am not looking to identify secular or cyclical tops anyway. I am just trying to identify a good time to sell.
No one strategy is perfect and no one strategy covers every market circumstance, and a cluster of negative divergences is no different. What is clear is that a cluster of negative divergences occurs late in a price move. It may signal a market top. On the other hand, the failure of this signal to lead to lower prices in either the short or intermediate term, will typically lead to an acceleration of prices higher, which would be consistent with a market blow off. These concepts are best illustrated by looking at figure 2, a weekly chart of the yield on the 10 year Treasury (symbol: $TNX.X) with our divergence indicator in the lower panel. The time period under consideration is from 1994 to 1995.
Figure 2. $TNX.X/ weekly/ 1994 to 1995
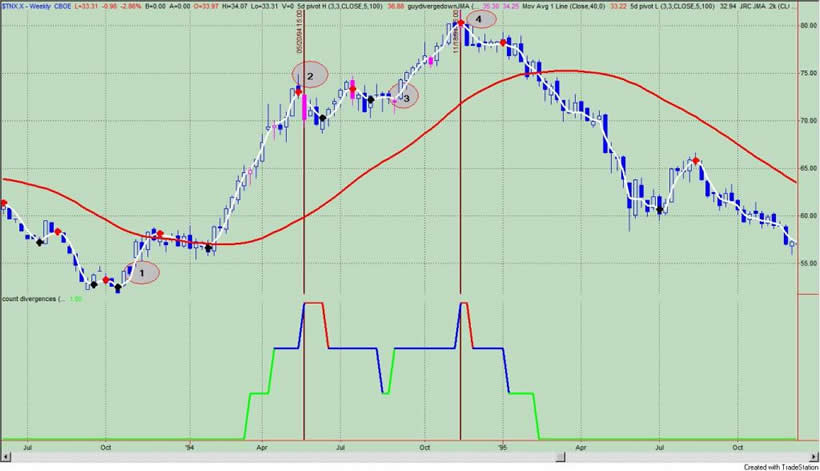
From point 1 to point 2, Treasury yields moved about 50% higher, and after such a strong move, a cluster of negative divergences showed up at point 2. Over the next 15 weeks, yields moved in a trading range as momentum slowed. At point 3, yields broke out of the trading range and bolted higher in what appears to be a market blow off. At point 4, we have another cluster of negative divergences, and at this point, the market put in a top that saw prices trade all the way back to levels seen 3 years earlier.
So the first negative divergence cluster (point 2) signaled a trading range, which led to higher prices and the second cluster of negative divergences (point 4) was consistent with a market top. Is there anyway that I could have distinguished such different outcomes? The answer is probably no. But that is ok because I am not looking to identify the top tick. I would have been a seller at point 2 because I cannot distinguish point 2 from point 4. Selling when there are multiple negative divergence bars protects profits; it does not "call" a market top.
Another way to navigate these junctures would be to use a moving average cross over system to exit the market during those times when there are multiple negative divergences. The cluster of negative divergences would serve as a filter and then you use the cross of a faster moving average below a slower one to be taken out of the market. This assures that you won't sell at the highs, but it may prevent premature selling.
But if you get out of a position, you must have a way to get back into the market because you may have sold prematurely. One suggestion would be to get back into the market on a close above the high of the recent negative divergence bar. There is no right or wrong here, but selling is just good insurance. Playing good defense leads to consistent and profitable trading.
Another example comes from the Dow Jones Industrial Average (symbol" $INDU). See figure 3 a weekly chart from the 1935 to 1937 time frame. From point 1 to point 2, the Dow Industrials gained approximately 60% over 60 weeks. At point 2, the first negative divergence cluster appeared leading to a short (i.e., in both depth and duration it was <> 10%) pullback. The negative divergence cluster at point 4 coincided with the market top which lead to a 45% correction of the prior move.
Figure 3. $INDU/ weekly/ 1935 to 1937
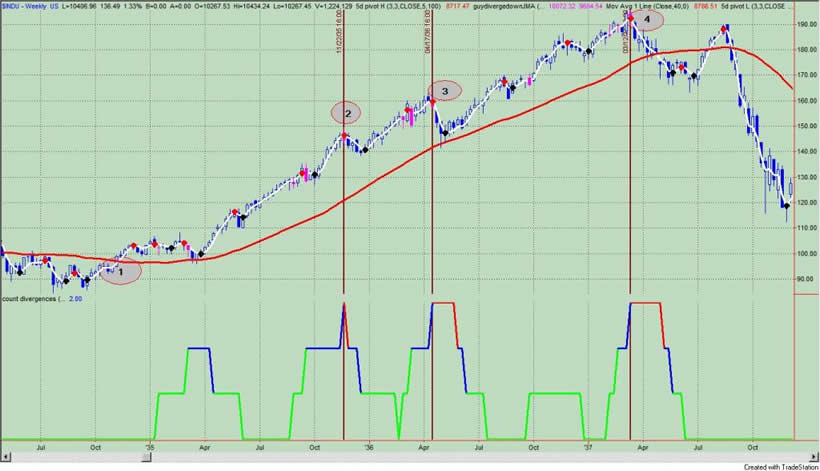
Per my comments above, I would have been a seller at point 1 and point 2, yet I would have gotten back in on a close above the highs of the negative divergence bar. The last cluster of negative divergence bars (at point 3) would be another place to sell, and there was no further action after this as the market fell apart.
So why is this discussion regarding selling relevant? As you can guess, after a 50% move in the markets over the past 8 months, I am starting to see a cluster of 3 negative divergences in many of the ETF's that I follow and that I have discussed in these pages. These ETF's are listed in the following table. Column 1 lists the ETF's by symbol; column 2 is the high of the recent negative divergence bar; column 3 notes a daily or weekly close over the high of the negative divergence bar; if column 3 is left blank, then prices have yet to close over the highs.
Table 1. Negative Divergence Clusters
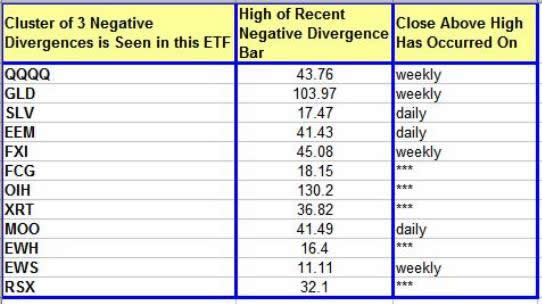
It is interesting to note that the QQQQ's, GLD, and FXI - that's tech, gold and China or everybody's favorite ETF's - have each made a weekly close above the high of the recent negative divergence bar. This is interesting and maybe it implies a blow off top, and it should be noted that this was the source of my reference to market blow offs in this week's wrap up on investor sentiment.
By Guy Lerner
http://thetechnicaltakedotcom.blogspot.com/
Guy M. Lerner, MD is the founder of ARL Advisers, LLC and managing partner of ARL Investment Partners, L.P. Dr. Lerner utilizes a research driven approach to determine those factors which lead to sustainable moves in the markets. He has developed many proprietary tools and trading models in his quest to outperform. Over the past four years, Lerner has shared his innovative approach with the readers of RealMoney.com and TheStreet.com as a featured columnist. He has been a regular guest on the Money Man Radio Show, DEX-TV, routinely published in the some of the most widely-read financial publications and has been a marquee speaker at financial seminars around the world.
© 2009 Copyright Guy Lerner - All Rights Reserved
Disclaimer: The above is a matter of opinion provided for general information purposes only and is not intended as investment advice. Information and analysis above are derived from sources and utilising methods believed to be reliable, but we cannot accept responsibility for any losses you may incur as a result of this analysis. Individuals should consult with their personal financial advisors.
Guy Lerner Archive |
© 2005-2022 http://www.MarketOracle.co.uk - The Market Oracle is a FREE Daily Financial Markets Analysis & Forecasting online publication.