


Stocks Tumble Again and U.S. Treasury Bonds Spike on Panic Buying
Stock-Markets / Financial Markets 2010 May 08, 2010 - 08:16 AM GMT

 Nonfarm payroll employment rose by 290,000 in April, the unemployment rate edged up to 9.9 percent, and the labor force increased sharply, the U.S. Bureau of Labor Statistics reported today. Job gains occurred in manufacturing, professional and business services, health care, and leisure and hospitality. Federal government employment also rose, reflecting continued hiring of temporary workers for Census 2010.
Despite the rosy numbers, the unemployment rate rose to 9.9%. Census workers count for 48,000 and the CES Birth/Death Model registered 188,000 fictitious new jobs. The real number of new hires is probably closer to 54,000. In addition, the number of marginally attached workers rose by 177,000 and discouraged workers rose by 203,000. I don’t call this a good report.
Table U-6, which includes discouraged workers not counted in the headline figures, suggest the real unemployment percentage rose from 16.9% to 17.1%.
High Frequency Trading Systems May Have Caused the Plunge.
Regulators are reviewing a plunge that briefly wiped out more than $1 trillion in market value yesterday as the Dow Jones Industrial Average slid almost 1,000 points before paring losses. Concern over the trading mechanisms that caused the volatility overshadowed the biggest growth in U.S. jobs in four years. Equities today pared earlier losses amid speculation the European Central Bank will announce measures to stem the region’s debt crisis.
The SPX has a cautionary pattern.
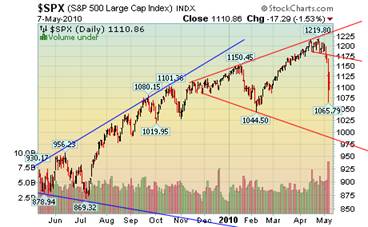 --Stocks stumbled again today as traders are trying to make sense out of yesterday’s panic selling. It wasn’t helped by computer-generated stop losses which triggered the bulk of the sell-off in just six minutes. This lends credence to the concern that the stock market is dominated by high-frequency computer trading systems that can execute trades in a millisecond. Leverage is nearing record levels again, bringing into question the sustainability of the rally. Finally, the Broadening Formation shown here is known as a topping pattern.
Treasuries spike in panic buying.
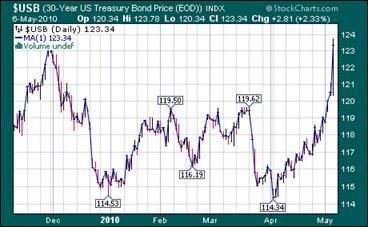 --Treasury bonds had their best performance since last November as investors fled to a perceived source of safety during the stock rout. Yields fell today as investors sought to guard against a potential meltdown in stocks caused by the fear of a sovereign debt crisis that would bleed over into a banking crisis. Many European banks own the debt of Greece, Portugal, Spain, Italy and Ireland, which has either been downgraded or threatened with a lower rating.
Are investors being panicked into gold, too?
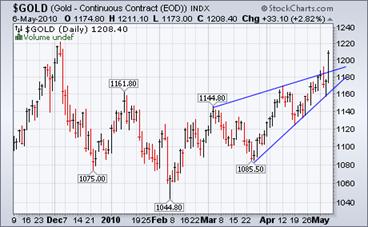 -- Gold dropped for the first time in three days in London after an advance to a five-month high prompted some investors to sell. Bullion jumped 2.8 percent yesterday and traded within 1.3 percent of a record, as concern about Europe’s debt crisis boosted its appeal as a haven amid a slump in equities and other commodities. Prices climbed to all-time highs in euros, British pounds and Swiss francs this week. Holdings in the world’s biggest gold-backed exchange-traded fund reached a record.
Nikkei suffers from the sell-off, too.
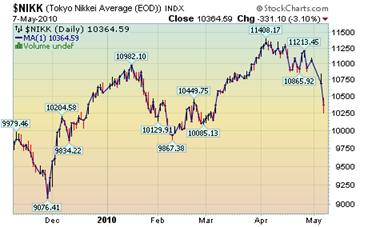 -- Japanese stocks tumbled for a second day, extending a global rout on mounting concern the European debt crisis will spread and stall the global economic recovery. The Nikkei dropped 6.3 percent in this holiday-shortened week for its biggest two-day decline since December 2008. The Topix sank 5.6 percent, the most since March 2009. Both gauges lost more than 3 percent yesterday after a three-day holiday during which concern mounted that Europe’s debt crisis will spread and hamper global growth.
China declines over 15% in two weeks.
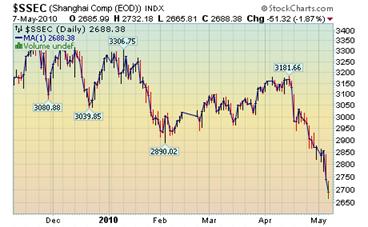 -- China’s stocks fell, sending the benchmark Shanghai Composite Index to an eight-month low, as concern Europe’s debt crisis will halt the global recovery spurred the biggest drop in U.S. equities in a year. The Shanghai Composite Index, which tracks the bigger of China’s exchanges, dropped 51.32, or 1.9 percent, to 2,688.38, the lowest close since Sept. 1 and capping a 6.4 percent decline for the week.
The U.S. Dollar continues its rally.
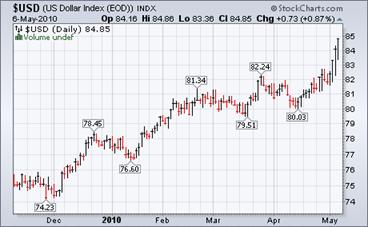 -- The dollar continued its rally, ending higher for the week. The Euro and the Yen continue to fall, revealing economic weakness in Japan and concern over the deteriorating condition of the European Union and the weakening of the economic ties between the countries in Europe. The sovereign crisis may turn into a European banking crisis, as many European banks hold the debt of the PIIGS countries. In the scramble to reduce their exposure, they are buying dollars in massive quantities to shore up their reserves.
Freddie Mac comes begging for more (taxpayer) money.
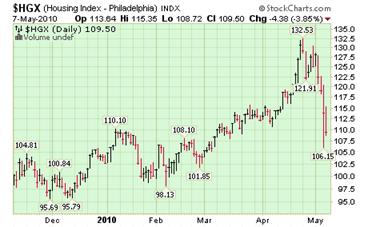 Freddie Mac, the bailed-out mortgage-finance giant, reported Wednesday that it continues to lose money and needs an additional $10.6 billion in assistance from U.S. taxpayers.The most recent earnings report follows three straight quarters in which the McLean-based company did not need infusions from the Treasury. Still, the firm is struggling to recover from the mortgage-market meltdown; it reported a net loss of $6.7 billion in the first quarter of 2010, compared with a loss of $9.9 billion a year ago.
Gasoline prices at the pump may drop next week.
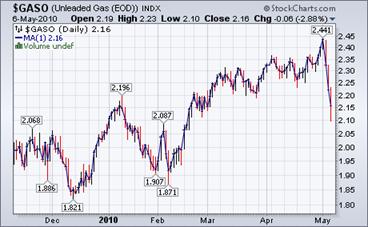 The Energy Information Agency weekly report observes, “The U.S. average price for regular gasoline increased five cents to $2.90 per gallon. The price was $0.82 above last year at this time. Although prices rose in all regions of the country, the size of the increase varied considerably, ranging from about a penny to more than seven cents. The East Coast average climbed over four cents to $2.88 per gallon. The average in the Midwest increased the most of any region, shooting up more than seven cents to $2.88 per gallon.”
Natural Gas prices follow lower consumption.
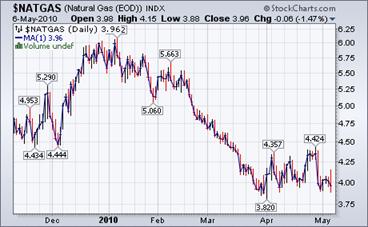 --Natural gas futures were little changed in New York after the Labor Department reported that U.S. employment in April increased by the most in four years. “The economic numbers are creating some sort of basis for a sustainable recovery,” said Peter Beutel, president of trading adviser Cameron Hanover Inc. in New Canaan, Connecticut. “But we continue to have very high production and ample supplies in storage.”
Equity Markets: A Long Way Down From Here
Mish says, “While everyone is cheering Friday's rosy job's numbers, the market responded with a big fat ‘so what?’"
Meanwhile, I have my eyes on a couple of charts that suggest "It Could Be A Long Way Down From Here"
Rogers, Faber Advise Paring Investments as U.S. Stocks Slump.
Investors should consider paring their holdings after a plunge in U.S. stocks yesterday, according to Jim Rogers and Marc Faber.
Equities had a “normal correction” and were “overdue for a sell-off” after rallying from last year’s low, Rogers, Singapore-based chairman of Rogers Holdings, told Bloomberg Television today. “The market was overbought, ahead of itself and due for a correction,” Faber, publisher of the Gloom, Boom & Doom report, said in a separate interview yesterday.
“Being down 3 or 4 percent is a big, big number but that’s hardly panic, not yet,” Rogers said. According to Faber, recent declines suggest “that maybe we’ve made a major high in the latter part of April this year and that we will, from here on, have a more meaningful decline.”
Traders alert: The Practical Investor is currently offering the daily Inner Circle Newsletter to new subscribers. Contact us at tpi@thepracticalinvestor.com for a free sample newsletter and subscription information.
Our Investment Advisor Registration is on the Web
We are in the process of updating our website at www.thepracticalinvestor.com to have more information on our services. Log on and click on Advisor Registration to get more details.
If you are a client or wish to become one, please make an appointment to discuss our investment strategies by calling Connie or Tony at (517) 699-1554, ext 10 or 11. Or e-mail us at tpi@thepracticalinvestor.com .
Anthony M. Cherniawski, President and CIO http://www.thepracticalinvestor.com
As a State Registered Investment Advisor, The Practical Investor (TPI) manages private client investment portfolios using a proprietary investment strategy created by Chief Investment Officer Tony Cherniawski. Throughout 2000-01, when many investors felt the pain of double digit market losses, TPI successfully navigated the choppy investment waters, creating a profit for our private investment clients. With a focus on preserving assets and capitalizing on opportunities, TPI clients benefited greatly from the TPI strategies, allowing them to stay on track with their life goals
Disclaimer: The content in this article is written for educational and informational purposes only. There is no offer or recommendation to buy or sell any security and no information contained here should be interpreted or construed as investment advice. Do you own due diligence as the information in this article is the opinion of Anthony M. Cherniawski and subject to change without notice.
Anthony M. Cherniawski Archive |
© 2005-2022 http://www.MarketOracle.co.uk - The Market Oracle is a FREE Daily Financial Markets Analysis & Forecasting online publication.