


Gold Up Days Not as Strong as Down Days
Commodities / Gold and Silver 2010 May 30, 2010 - 12:44 PM GMTBy: Merv_Burak

 The previous week we had four down days and one up. This past week we had four up days and one down. You would expect we are back to where we started but unfortunately the up days were not as strong as the down days and we are only half way to the previous starting point.
COMMENTS on the COMMENTARIES
I’m quite humbled by the response to my request for comments. I will be answering each and every one of them individually but it will take a little time so bare with me.
The two most common suggestions were for more technical “education” and for the occasional individual stock analysis. I will try to accommodate these suggestions. Most of the time the technical “education” will be intertwined within the general commentary although I might, on occasion, focus on an indicator by itself. Over time I am sure I will be presenting education previously presented but new readers come along and they may not have read earlier education. As for the individual stock analysis, some web sites that post these commentaries had indicated they were not amiable to having individual stocks analyzed within the commentaries posted on their sites so I have to think of how to get around this.
SOURCE for TECHNICAL EDUCATION
If you Google for technical analysis you will get hundreds of web sites. There are, within these hundreds, many good sites to get familiar with technical concepts and techniques. I would suggest one in particular as probably the best single site, that being www.stockcharts.com. It’s a good place to learn the technical discipline as well as a place to develop your own charts.
GOLD LONG TERM
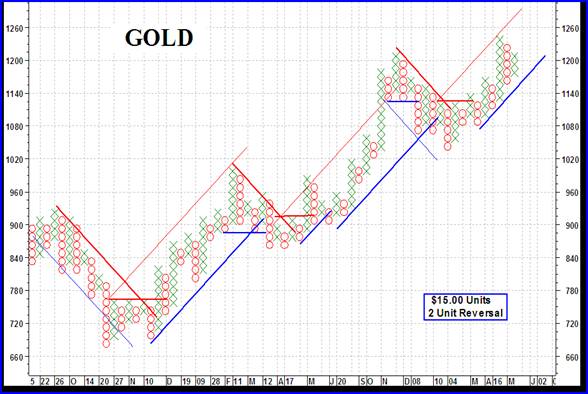
Once again we have the long term Point & Figure (P&F) chart of gold shown. Some form of the P&F chart has been around for centuries. A few hundred years ago the Chinese used a variation of P&F to track the price of rice. Over the years the chart format has varied from lines to zig-zag to Xs and Os. Today the basic P&F chart is a variation of the Xs and Os although there still is a section of the discipline that uses only Xs, especially for single reversal criteria charts. Regardless of which type of P&F chart one uses they all have three things in common. Time is not directly shown on the chart. The chart shows trends up and down and only moves to the right after a specified reversal of price. Volume is not part of the chart.
I’ve been a P&F enthusiast since the mid-1960’s. Over the years I had developed my own P&F technique for tracking stocks and indices. One variation of the technique addressed the lower priced stocks such as found in the Canadian speculative resource industry. I had found this technique was very good at picking the turns in the “penny” stocks and use it expensively in my precious metals central service.
You see the technique at work with the gold and silver charts shown here occasionally. As today’s long term gold chart suggests, P&F is not perfect, but then NO TECHNIQUE is. P&F has the advantage of keeping you in a trend as the trend progresses, getting you out when the trend is over and not having you in holding for dear life praying to break even when the price goes against you. On the occasion when it gives you a false signal it reverses back to the correct trend with minimal loss or minimal loss of profit.
At the present time the long term P&F remains bullish and some distance from any potential reversal signal. Should the price drop straight down the reversal would come in at $1110 so there is little concern at this time from the long term P&F standpoint.
Looking at my normal indicators, gold remains above its long term moving average line and the line slope is pointing upwards. The long term momentum indicator remains in its positive zone and just above its neutral trigger line. The momentum is showing a negative divergence versus the price action. As the price of gold was making a new high a few weeks back the momentum indicator remained a considerable distance below its previous high showing the strength of the gold price move was lower than before. Weakening strength of a move is often a sign of a potential problem ahead. However, the suggestion of potential problem does not have a time table attached to it so it could occur at any time or at a much later time or at no time. Nothing is for sure. One just has to stay on top of the on going move and be prepared for any eventuality. The volume indicator continues to show strength and remains above its positive sloping trigger line. As of the Friday close the long term rating for gold remains BULLISH.
INTERMEDIATE TERM
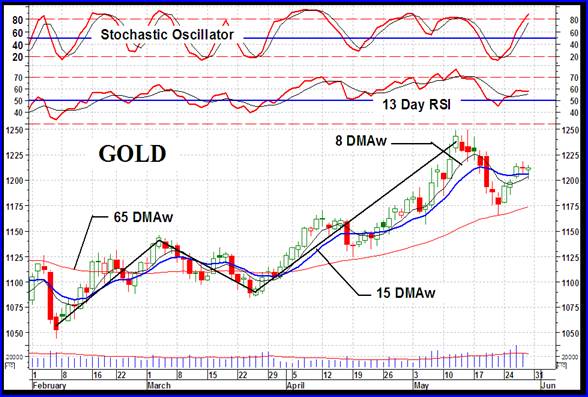
A week ago Friday gold just touched my intermediate term moving average line and bounced up. It continued in its upward trek during this past week but not with any vigor. Charles Dow mentioned way back over a hundred years ago that the market has three trends all moving independently of each other. There are the short ups and downs within a rising or falling roller coaster all within a gradual upward or downward tilt in the road. We seem to be in one of those upward bumps in an upward roller coaster trend. The price of gold has reacted upward after touching the positive sloping moving average line. The momentum indicator remains in its positive zone but like the price is nowhere near its previous level of a few weeks back. It has moved above its trigger line but the trigger remains sloping downward. The volume indicator is showing just slightly better strength than the price but not enough to grab on to. It is above its positive trigger line. All in all, the intermediate term rating remains BULLISH. The short term moving average line remains above the intermediate term line for a continuation confirmation of the bull.
SHORT TERM
One of the simple ways of understanding if we are in an up or down trend is by the higher highs and higher lows technique. The short term chart shows such a trend, higher highs and higher lows. For this up trend to continue we need a higher low that is several weeks from the previous higher high. We are not there yet. Along the way we had a few minor reactions and rallies signifying nothing much. That may be what we are into right now. That being the case we should be prepared for further down side action into the next few weeks to give us that higher low we are waiting for. Elliott Wave experts use these ups and down towards their analysis of the market direction and eventual target but to get into the Elliott Wave here would take too much time. Again, google Elliott Wave and you will get multiple locations on the web that provide you with Elliott Wave education and analysis. I’m not sure where we are relative to the Wave Theory but it does look like a downer to be finished followed by at least another upper into new high territory.
As far as the short term is concerned, gold has bounced above its short term moving average line during the week and the line has just very slightly turned to the up side. The momentum indicator has moved back into its positive zone and above its positive trigger line. The daily volume activity has been giving us a positive sign increasing during the up days while decreasing on the down day. For today, the short term rating is BULLISH. It should be noted that the very short term moving average line, although moving higher, has not yet crossed above the short term line for confirmation of the bull so one should be cautious until it does.
As for the immediate direction of least resistance, that’s always a toughie on the week-end, especially this week-end when the markets in the U.S. are closed on Monday. The very short term moving average line is moving higher and gold is above the line BUT gold does look a little toppy here. The Stochastic Oscillator has entered its overbought zone and although it has not yet started its reversal that does not take more than a day to occur. The SO is now in an area from which gold itself has consistently reversed its move. I’ll go with the lateral for the next few days although it does look like the downside is most likely.
SILVER
In the 14 May 2010 commentary I showed the P&F chart of silver. It was at its resistance level. It has since reversed back down to its support and is now once more bouncing up towards that resistance.
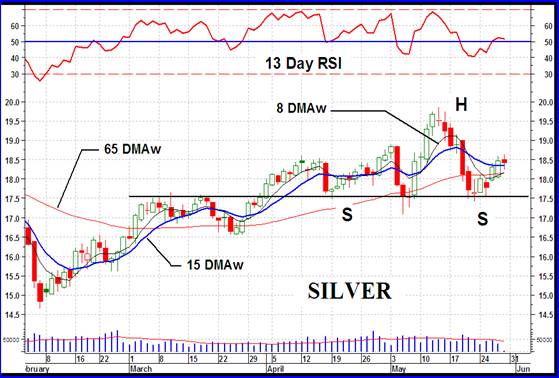
Too often I see analysts who claim there is a pattern in the trading activity that is pushing the envelope of credibility. As you may remember, when it comes to the head and shoulder pattern I have set a criteria for my own use as to when we have or not have an H&S pattern. My basic criteria is that the primary trend leading to the head must be a bull trend. The other basic criteria is that the distance from the start of the primary trend to the top of the head should be at least twice the distance as from the neckline to the top of the head. We have both of these basic requirements in the short term silver chart. Other features are investigated but these are supportive features and not primary defining features. For better confirmation of the H&S pattern I like to see the momentum indicator give us a negative divergence at the head and the daily volume to be lower at the head than earlier. Both of these features are there although I don’t necessarily require them on every H&S. So, we have a “potential” H&S pattern. Confirmation comes with the breaking to the down side of the neckline, which is roughly at the $17.50 level. Should silver close below the $17.50 mark (confirming the pattern) this H&S pattern would project a move to just above the $15 level.
Although slightly weaker than gold, the ratings for silver would be the same as for gold so I wouldn’t go into a detail analysis for silver this week, just use the relevant gold ratings.
PRECIOUS METAL STOCKS
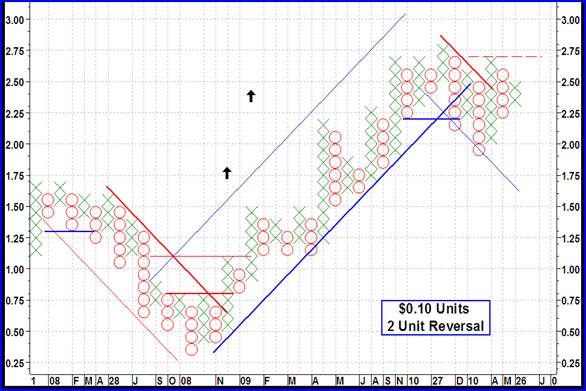
This was a stock chart provided to my subscribers a few weeks ago following the P&F sell signal. The Technical Table Rating went NEG at the same time as the P&F gave a sell but did so at a slightly higher price providing a slight improvement in profit. This is a sample of the P&F technique developed for the “penny” stocks. We have a buy signal at $0.90 at the end of Dec 2008 with an initial $1.80 projection. I require at least a 100% potential gain before actually giving a buy recommendation. That is what we had here. The trend stayed positive until the end of Dec 2009 when the P&F dropped below the up trend line and two previous lows. The sell was at $2.20 for a 144% gain in one year. What would one do with this stock now? Well, providing no additional up and down moves, the next upside break would come at the $2.80 level although one might wait until the $2.90 level to get into new high territory. BUT would one buy at that point? The projection on such break would only be for a 44% potential move and may not be enough to risk one’s capital, especially since the stop loss, using the P&F chart only, is some distance away. The potential profit to potential loss may not be attractive.
The P&F technique provides one with a simple method of tracking the actions of stocks and assessing the buy and sell potential without a great deal of headaches.
As for the performance of the general universe of gold and silver stocks, well this week was a lot better than the previous week but still we are in a serious situation that one needs to be careful before jumping into the market. The momentum indicator is providing us with a negative divergence situation that just might end propelling stocks lower. I’ll give the universe a better look next week.
Merv’s Precious Metals Indices Table
Well, I think I’ll call it another day.
By Merv Burak, CMT
Hudson Aero/Systems Inc.
Technical Information Group
for Merv's Precious Metals Central
For DAILY Uranium stock commentary and WEEKLY Uranium market update check out my new Technically Uranium with Merv blog at http://techuranium.blogspot.com .
During the day Merv practices his engineering profession as a Consulting Aerospace Engineer. Once the sun goes down and night descends upon the earth Merv dons his other hat as a Chartered Market Technician ( CMT ) and tries to decipher what's going on in the securities markets. As an underground surveyor in the gold mines of Canada 's Northwest Territories in his youth, Merv has a soft spot for the gold industry and has developed several Gold Indices reflecting different aspects of the industry. As a basically lazy individual Merv's driving focus is to KEEP IT SIMPLE .
To find out more about Merv's various Gold Indices and component stocks, please visit http://preciousmetalscentral.com . There you will find samples of the Indices and their component stocks plus other publications of interest to gold investors.
Before you invest, Always check your market timing with a Qualified Professional Market Technician
Merv Burak Archive |
© 2005-2022 http://www.MarketOracle.co.uk - The Market Oracle is a FREE Daily Financial Markets Analysis & Forecasting online publication.