


Weekly Gold and Silver Technical Analysis Report - 30th Sept 07- Technically Precious with Merv
Commodities / Gold & Silver Sep 30, 2007 - 04:35 PM GMTBy: Merv_Burak

 Gold is moving into new high ground for this generation but still over $100 shy of an all time high (not including effects of inflation). Will we get there before the next generation?
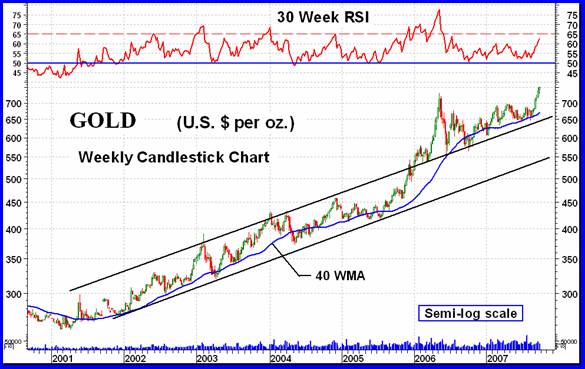
GOLD : LONG TERM
The long term P&F chart has tacked on another X and has now given us another long term projection. In my 07 Sept 2007 commentary I calculated three earlier projections. With gold breaking into new high ground a final (for now) projection can be calculated to the $1125 level. Of course there are higher projections based upon a very long term chart shown last week but those are for much later consideration.
For those interested in point and figure there is an interesting blog at http://canadianpointandfigure.blogspot.com that gives some well researched P&F charts and commentary on the markets, and other stuff. The blog is written by a former portfolio manager and a quantitative guy with a fundamental twist so you get just about everything. Check it out.
I want to spend a little more time on the stock Indices analysis so my gold analysis will be simplified this week.
On the long term everything is still technically great. The only cautionary indicator is still the momentum indicator but it too seems to be perking up. With a chart such as the one above one can only remain BULLISH on the long term.
INTERMEDIATE TERM
With gold closing at a new high for this bull market it's hard to find anything bad to say. Even momentum has moved into new year and a quarter highs although there is still that high from May 2006 to overcome. The one real negative here is the volume indicator. The daily volume during this latest run-up in price has been underwhelming. The On-Balance Volume indicator has continued to trace a lateral path failing to confirm the price strength. Speculators do not seem to be too impressed with the price trend. Something to be very cautious about. For now I can only remain BULLISH on the intermediate term.
SHORT TERM
As mentioned last week I am doing away with the immediate term analysis. Any such comment will be incorporated into this short term section.
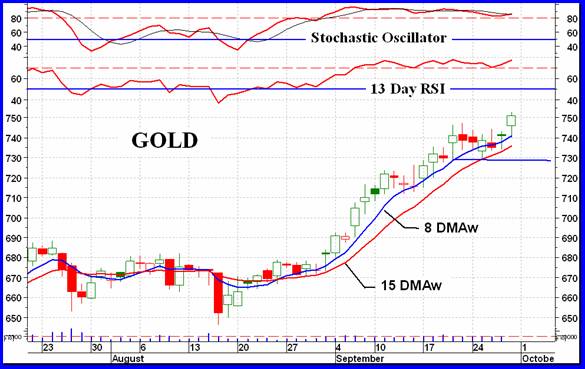
The short term moving average and momentum indicators (15 DMAw and 13 Day RSI) have kept us on the right side of this move for the past 5 to 6 weeks. It can't last much longer but as long as it does, keep with it. Momentum continues to track laterally inside its overbought zone indicating a continuous strong upside move (price wise). As mentioned in the intermediate term analysis, volume is a concern and remains so. We have a short term support at the $730 level and for this week as long as the price stays above that level we can assume the short term is still positive.
As the action continues it is possible for the price to move below the short term moving average line but as long as the line slope remains upward the trend would be unchanged. From a very short term perspective the Stochastic Oscillator has been showing weakness versus the price action. Although it is still inside its overbought zone the likelihood of it dropping below the overbought line are quite high. Should that happen it would probably be your first indication that the strong move has come to an end, for the time being. But wait for it. For now, still BULLISH on the short term.
NORTH AMERICAN GOLD INDICES
For most investors in the precious metals the gold standard of Indices is the PHLX Gold and Silver Sector Index, often referred to by its ticker symbol XAU. This Index has many faults as a representation of the gold stock market. The biggest, in my view, is the weighting factor towards the Index calculation. The largest few stocks in market capitalization represent the major portion of the Index value. Two thirds of the Index value is represented by only four stocks. This is not a representation of the overall precious metals market. However, the Index is widely followed and for that reason alone is important.
Although generally drifting upwards over the past several years the XAU has been a poor performer when compared to other gold Indices. Over the past year and a half the Index has moved in a lateral manner with two sharp peaks, one at the start of its lateral move and the other at this time. One wonders if this peak will collapse or if it will be just a stepping stone towards even higher levels.
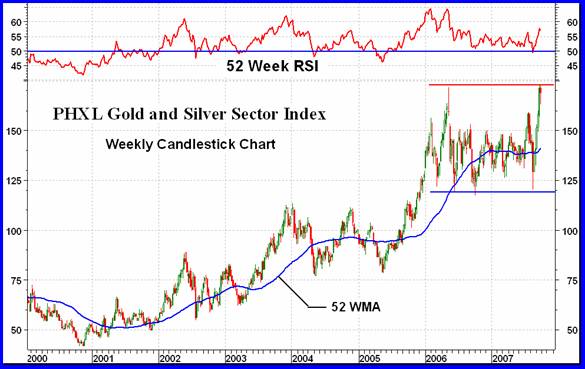
Over the past month the Index shot up sharply. Momentum has moved up rapidly with the Index but at a slightly weaker strength. On a daily chart the Index is comfortably above its July high but the momentum indicator is having trouble exceeding its July level. Not a good indication of strength. Although volume is not available for this Index looking at the actions of those four largest component stocks one is not too impressed with the volume action, except for possibly Barrick Gold, where the volume indicator has been on a steady upward track for the past four months. For now we will have to wait and see if the Index breaks decisively above the resistance level from the earlier peak.
The other four major Indices that are reviewed here on a rotating bases are either similar in recent performance to the XAU or are in a much weaker state.
MERV'S PRECIOUS METALS INDICES
Looking over the Precious Metals Indices Table there is a difference of results between the Merv's Indices and the majors. Almost all (except the Spec-Silver) of the Merv's Indices closed higher on the week while all the other Indices closed lower. This is an example of the difference between the largest companies and all the rest. All of the major Indices calculate their Index values based upon a weighting that results in a few large stocks contributing the major portion of the Index value. The Merv's Indices give each stock an equal weighting towards the respective Index value. In one case the large stocks dominate and in the other case they do not.
The Composite Index of Precious Metals Indices has traded in a wide slightly up trending channel over the past year and a half. It is presently very near the upper channel trend line. One would therefore expect that there is very little extra room for more upside action and that the direction of least resistance has now started turning towards the down side. We'll have to see how this plays out.
MERV'S GOLD & SILVER 160 INDEX
The chart shows the average performance of the universe of 160 precious metal stocks over the past several years, since the start of the Index bull market in 1998. From its 1998 bottom to this Friday's close this Index of 160 stocks has gained over 6000%. Not bad when you consider the number of component stocks. The PHLX Gold and Silver Sector Index, on the other hand, has only gained 303% from its low point at the start of its bull market in 2000.
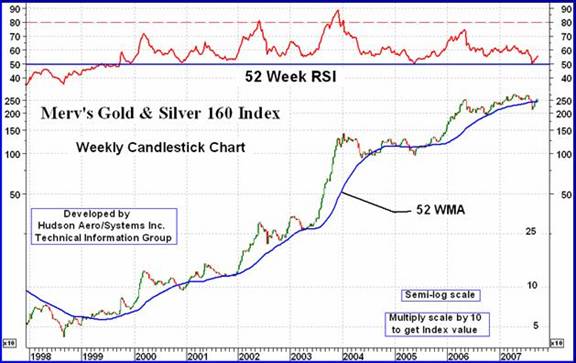
The chart is shown as a very long term chart with a yearly moving average and a yearly momentum indicator. These are somewhat longer term then I usually use for my analysis. What we see here is a moving average that is still pointing upward but starting to flatten out. This happens when the Index goes into a lateral trend. We had seen this before during the 2004/2005 period. Along with the moving average we have the momentum indicator as an indication of long term strength of Index activity. From the start of the bull market in this Index to its peak in early 2004 the strength of each new move into higher levels was accompanied by a stronger momentum reading.
Since the 2004 peak each thrust by the Index into new highs was NOT confirmed by a similar thrust of the momentum into new highs. In fact the new highs of May 2006 and the new highs earlier this year were consistently made on lower strength. The momentum (strength of price action) has been positive ever since it first broke above its neutral line in mid to late 1999. It has remained positive ever since.
What all this is suggesting is that we are at a crucial position for gold stocks. We need several good weeks for the stocks to turn the moving average more aggressively upward and get the momentum strengthening. Otherwise, we may be in for a real bummer of a year or two for the stocks.
MERV'S QUAL-GOLD INDEX
I've split the three gold sector Indices this week for a brief individual commentary on each.
The Qual-Gold Index is the more appropriate of the Merv's Indices to compare with the XAU. The Qual-Gold Index bottomed out from a bear market in mid 1998 and then made a double bottom in late 2000. From its low in 2000 this Index gained 593% up to Friday's close. This is almost double the XAU performance. The Qual-Gold Index exceeded its May 2006 high earlier this year and has just gone into new all time highs this week. Unfortunately, we have the same problem with the long term momentum as with the 160 Index, under performance of the momentum. Momentum breached its neutral line a few weeks back just before the recent rally. We'll have to see if it can stay above the neutral line again or if it will drop back down. Only time can tell.
MERV'S SPEC-GOLD INDEX
The second tier of gold stocks, those with somewhat lower market valuation than the Qual-Gold stocks, have been very good performers over the years. The Spec-Gold Index made its bottom in 1998 from the previous bear market. It then went into a two year lateral trend making a final similar bottom in late 2000. Since then the Spec-Gold Index has gained 3748% up to Friday's close. We have the same pattern of activity in the long term moving average and momentum as shown for the Qual-Gold Index, i.e. moving average flattening out and momentum under performing the Index action. The same comment holds here, we need several good weeks of upside action with momentum confirming, otherwise, look out below.
MERV'S GAMB-GOLD INDEX
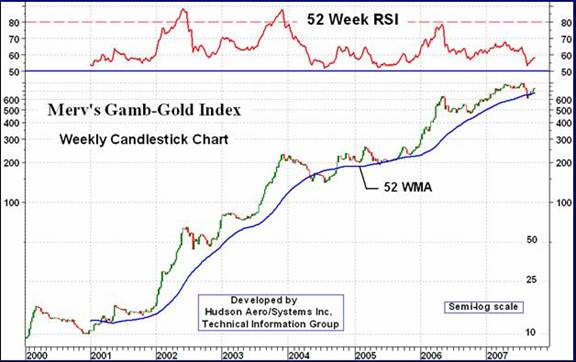
The Gamb-Gold Index was developed in early 2000 and may not have caught the lows it might have had earlier. However, since its early 2000 low to Friday's close its performance has been the best of the Merv's Precious Metals with a gain of 7831%. Despite some weakness over the past few weeks it is still the strongest Index from a long term standpoint. Momentum is weak but not as weak as the other Indices. The moving average still has a reasonable upward tilt to it. Having said all that it too can deteriorate quite rapidly should the overall market turn back to the down side. The negative divergence in the momentum indicator between its 2006 Index high and the Index higher 2007 highs is a serious concern. For now I'm watching if the Index can make new highs again.
SILVER
Silver has been on a real upward binge these past several weeks but it can't last much longer without taking a significant rest. As with gold the short term momentum and Stochastic Oscillators are in their overbought zones. The silver Stochastic has been a little stronger than the gold Stochastic but both look like they are ready for a reversal. Let's see what the new week brings.
MERV'S QUAL-SILVER INDEX
The bull market in the quality silver stocks did not start until late 2001, a year after the gold stocks started. However, once started these stocks did quite well having gained 1504% up to Friday's close. It's recent action has been quite weak and may resemble a topping activity. Momentum is flat and very close to its neutral line. The long term moving average line has been flattening out but is still pointing upwards. All in all a similar situation to the other precious metals Indices.
MERV'S SPEC-SILVER INDEX
The Spec-Silver Index is my newest Index and only goes back to early 2003. One cannot therefore compare its performance over its bull market as the bull for this Index probably started some years earlier. However, from its 2003 low to the present this Index gained 1320%. The Spec-Silver Index is probably about the weakest of the Merv's Indices at this time. Its long term moving average line has already turned downward, the only one of the Merv's Indices to do so. It's long term momentum, although bouncing off the neutral line, is still very weak after showing a serious negative divergence. If we are in for some serious down side action in the precious metals then this Index is the first to suggest so.
Merv's Precious Metals Indices Table
That's it for now.
By Merv Burak, CMT
Hudson Aero/Systems Inc.
Technical Information Group
for Merv's Precious Metals Central
Web: www.themarkettraders.com
e-mail: merv@themarkettraders.com
During the day Merv practices his engineering profession as a Consulting Aerospace Engineer. Once the sun goes down and night descends upon the earth Merv dons his other hat as a Chartered Market Technician ( CMT ) and tries to decipher what's going on in the securities markets. As an underground surveyor in the gold mines of Canada 's Northwest Territories in his youth, Merv has a soft spot for the gold industry and has developed several Gold Indices reflecting different aspects of the industry. As a basically lazy individual Merv's driving focus is to KEEP IT SIMPLE .
To find out more about Merv's various Gold Indices and component stocks, please visit www.themarkettraders.com and click on Merv's Precious Metals Central . There you will find samples of the Indices and their component stocks plus other publications of interest to gold investors. While at the themarkettraders.com web site please take the time to check out the Energy Central site and the various Merv's Energy Tables for the most comprehensive survey of energy stocks on the internet. Before you invest, Always check your market timing with a Qualified Professional Market Technician
Merv Burak Archive |
© 2005-2022 http://www.MarketOracle.co.uk - The Market Oracle is a FREE Daily Financial Markets Analysis & Forecasting online publication.