


Why the U.S. Recession Forecasters Are Wrong (For Now)
Economics / Economic Recovery Oct 22, 2011 - 01:04 AM GMTBy: Clif_Droke

 Speculation over the direction of the economy continues to take center stage. With the presidential election coming up in 2012, the economy will undoubtedly be the central issue on the campaign trail and will receive even more attention than it has up until now. Many analysts have made waves lately in forecasting a "double dip" recession, with at least a couple of high profile analysts claiming the recession has already arrived.
One of the more reliable barometers of the health of the U.S. retail economy, however, hasn't confirmed a recession. This particular indicator, in fact, is suggesting that the coming Christmas retail spending season may be up to par with last year's retail season. The indicator in question is the New Economic Index (NEI), which measures the fortunes of five of the most important companies serving the retail economy. This index has correctly predicted the short-term and intermediate-term outlook of the consumer spending economy since before the credit crisis began. It's a composition of the five leading retail components of the economy, including sales, transportation, business services and hiring.
Here's what the New Economy Index looks like right now.
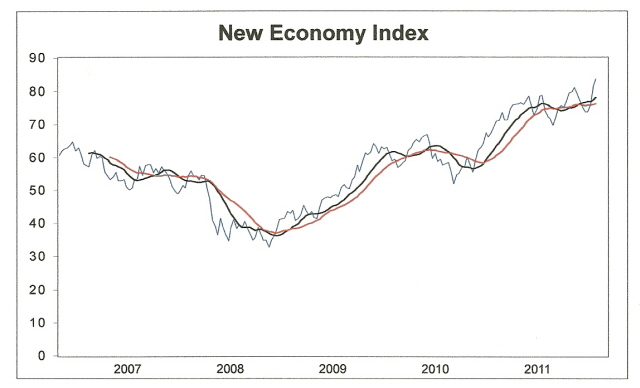
The index has made a fresh new 4-year high. The NEI is interpreted by watching how the two moving averages perform in relation to the NEI price line. When the 12-week moving average (black line) crosses below the 20-week moving average (red line) and then both moving averages trend discernibly lower, a downturn in the U.S. consumer economy of indeterminate length always begins. This hasn't occurred since the spring and summer of 2010 when the 12-week and 20-week MAs were in decline and the NEI price line was making a series of lower highs and lower lows after last year's "flash crash."
The rising trend in the NEI, along with its latest new high, is a reflection of a couple of things. It reflects how much spending power still remains with businesses in spite of all the talk about the high unemployment rate and poor sales outlook. It also shows just how much consumers - that is, those consumers with decent paying jobs - are willing to open their pocket books and make discretionary purchases in spite of being warned every day in the media that another recession is imminent. Until the NEI and its moving averages reverse significantly lower, an economic downturn isn't expected.
The positive trend in the NEI is reflecting either an optimistic mood among consumers (particularly those on the higher end of the economic spectrum), or else the anticipation of an above consensus retail spending season in the next few weeks. This doesn't assure that the trend will continue beyond the near term, however. To answer the question of how long this positive trend can continue it's important to look at two things, namely the longer-term cycles and the fiscal policies of the government.
In terms of the cycles, a very important longer-term cycle has already peaked this year, namely the 6-year cycle. The price peak for this particular cycle was in May while the time peak occurred earlier this month. This was the last of the significant longer-term cycles that was in its rising phase before the 60-year Grand Super Cycle bottoms in 2014 along with its double, the 120-year cycle. Some cycle watchers assume this mean that it's all downhill for the financial market and the economy between now and 2014, but this isn't likely to be true. As with any cyclical progression, there are short-term weekly and quarterly cycles at play which, when combined with extremes in investor sentiment, create potentially sharp reactions against the long-term downward trend.
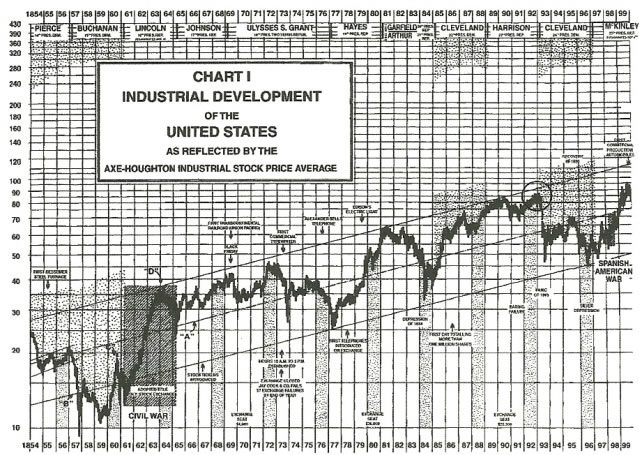
Another point worth considering is how the previous 120-year cycle bottom played out. In 1892 - just a couple of years before the 120-year cycle was to bottom in 1894 - the stock market as measured by the Axe-Houghton Industrial Stock Index actually advanced through the end of 1892 before collapsing in 1893-94 under the weight of the dominant long-term cycle (circled in chart below). Some observers have wondered if perhaps this pattern could be repeated in 2012.
To answer this question we need to consider that only one yearly cycle is still in its peaking phase currently and that's the 4-year cycle. The 4-year cycle is the least significant of the yearly cycles but when there is a sufficient level of political will on the part of regulators, a temporary abeyance of the stock market downtrend while the 4-year cycle peaks next year could theoretically occur. This would probably require a coordinated global stimulus effort on the part of the world's leading central banks, i.e. a global QE3 type effort. Considering that next year is a presidential election year in the U.S. and the stakes are also quite high in the euro zone for a rescue of certain member countries, such an effort can't be ruled out going into 2012.
Although a coordinate global stimulus policy while the 4-year cycle is in its peak phase next year could buy both the stock market and the economy some time, it likely wouldn't put a significant dent in the unemployment rate. Even a major stimulus on a global level will be battling the fierce headwinds of the 120-year down cycle, and it's unlikely that monetary regulators have the will or the understanding to increase money supply to the degree that would be required to make serious inroads against deflation.
For now the U.S. retail economy is still being propelled from the momentum created by the recently peaked 6-year cycle, not to mention the fairly abundant liquidity provided by the Fed in the last several months. It would be a mistake to assume that this liquidity is a sufficient barrier against, say, another outbreak of the European debt crisis because liquidity has a tendency to vanish when it's needed most. But as long as there are no crisis situations on the immediate horizon, the current environment should be enough to allow the retail economy to dodge another bullet this holiday season.
Gold & Gold ETF
Despite the recent pullback in the dollar index, gold and the gold ETF appear to be constrained by investor uncertainty over the near term outlook for the metal. Investors are still concerned about the effects of CME Group's recent increases in the margin requirements for the metals (including a 26% increase in the gold futures margin) and have refrained from making heavy commitments. It appears that CME's desire to shake out the speculators has worked as fund buying has been at a minimum in recent weeks.
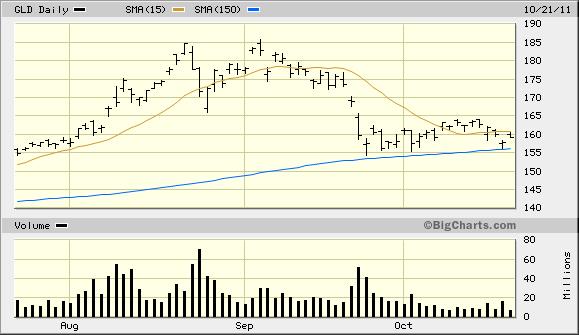
Meanwhile the SPDR Gold Trust ETF (GLD), our proxy for gold, has made no net progress in the last two weeks since establishing support above its 30-week moving average. GLD is overshadowed by the recent margin requirement increases in gold and although it did confirm a bottom the signal was very tepid.
Not only has the recent margin increases calmed traders' speculative juices but the temporary lifting of fear over the euro zone debt also has removed investors' urge to run into the safe havens. GLD needs to show us that it has bottomed, which it can do in the next few days by re-establishing support above the technically significant 30-week (15-day) moving average, which is now being tested as you can see in the chart below.
--------------------------------------------------------------------------------
Gold & Gold Stock Trading Simplified
With the long-term bull market in gold and mining stocks in full swing, there exist several fantastic opportunities for capturing profits and maximizing gains in the precious metals arena. Yet a common complaint is that small-to-medium sized traders have a hard time knowing when to buy and when to take profits. It doesn't matter when so many pundits dispense conflicting advice in the financial media. This amounts to "analysis into paralysis" and results in the typical investor being unable to "pull the trigger" on a trade when the right time comes to buy.
Not surprisingly, many traders and investors are looking for a reliable and easy-to-follow system for participating in the precious metals bull market. They want a system that allows them to enter without guesswork and one that gets them out at the appropriate time and without any undue risks. They also want a system that automatically takes profits at precise points along the way while adjusting the stop loss continuously so as to lock in gains and minimize potential losses from whipsaws.
In my latest book, "Gold & Gold Stock Trading Simplified," I remove the mystique behind gold and gold stock trading and reveal a completely simple and reliable system that allows the small-to-mid-size trader to profit from both up and down moves in the mining stock market. It's the same system that I use each day in the Gold & Silver Stock Report - the same system which has consistently generated profits for my subscribers and has kept them on the correct side of the gold and mining stock market for years. You won't find a more straight forward and easy-to-follow system that actually works than the one explained in "Gold & Gold Stock Trading Simplified."
The technical trading system revealed in "Gold & Gold Stock Trading Simplified" by itself is worth its weight in gold. Additionally, the book reveals several useful indicators that will increase your chances of scoring big profits in the mining stock sector. You'll learn when to use reliable leading indicators for predicting when the mining stocks are about o break out. After all, nothing beats being on the right side of a market move before the move gets underway.
The methods revealed in "Gold & Gold Stock Trading Simplified" are the product of several year's worth of writing, research and real time market trading/testing. It also contains the benefit of my 14 years worth of experience as a professional in the precious metals and PM mining share sector. The trading techniques discussed in the book have been carefully calibrated to match today's fast moving and volatile market environment. You won't find a more timely and useful book than this for capturing profits in today's gold and gold stock market.
The book is now available for sale at: http://www.clifdroke.com/books/trading_simplified.html
Order today to receive your autographed copy and a FREE 1-month trial subscription to the Gold & Silver Stock Report newsletter. Published twice each week, the newsletter uses the method described in this book for making profitable trades among the actively traded gold mining shares.
By Clif Droke
www.clifdroke.com
Clif Droke is the editor of the daily Gold & Silver Stock Report. Published daily since 2002, the report provides forecasts and analysis of the leading gold, silver, uranium and energy stocks from a short-term technical standpoint. He is also the author of numerous books, including 'How to Read Chart Patterns for Greater Profits.' For more information visit www.clifdroke.com
© 2005-2022 http://www.MarketOracle.co.uk - The Market Oracle is a FREE Daily Financial Markets Analysis & Forecasting online publication.