


U.S. GDP Miss Far Bigger Than Announced, Real GDP is 0%
Housing-Market / US Economy Apr 29, 2012 - 05:21 AM GMTBy: Mike_Shedlock

 The Advance Estimate for Q1 GDP came in at 2.2%, down from 3.0% in the previous quarter, and below most mainstream media estimates of 2.5%.
However, my friend BC notes ....
The GDP deflator is reported to have averaged 1.2% annualized in the past 2 qtrs. Had the trend rate from '11 persisted, the deflator would have subtracted 2.6% annualized from real GDP, resulting in a 2-qtr. growth of real GDP of 0%.
ECRI's Achuthan would appear correct that a recession were imminent instead of looking like a dummy.
Rick Davis at the Consumer Metric Institutes makes a similar calculation.
In their "advanced" estimate of the first quarter 2012 GDP, the Bureau of Economic Analysis (BEA) found that the annualized rate of U.S. domestic economic growth was 2.20%, down more than three-quarters of a percent from the fourth quarter of 2011. The vast bulk of the downturn was in commercial activities, with both fixed investments and inventories lowering the headline number substantially. Consumer spending on both goods and services improved slightly, and the ongoing contraction in governmental spending moderated somewhat. The BEA's bottom-line "real final sales" improved about a half-percent to an annualized growth rate of 1.61% -- hardly robust and certainly not the kind of numbers we would expect to see nearly three years into a recovery.
Once again the BEA has used "deflaters" that will strain the credibility of the public, especially if they buy gasoline. To correct the "nominal" data into "real" numbers the BEA assumed that the annualized inflation rate during 1Q-2012 was 1.54%. As a reminder, lower "deflaters" cause the reported "real" growth rates to increase -- and once again very low seasonally adjusted BEA inflation "deflaters" have been the headline number's best friend. If the raw "nominal" numbers were instead "deflated" by using the seasonally corrected CPI-U calculated by the Bureau of Labor Statistics (BLS) for the same time period, nearly the entire headline growth rate vanishes -- and the resulting growth rate would have been a minuscule 0.08% with "real final sales" contracting.
And real per capita disposable income actually shrank during the quarter shrank at an annualized -0.27% rate (from $32,699 per capita to $32,677 per capita) -- and it remains lower than it was 5 quarters ago. -- even using the BEA's optimistic "deflaters." Real-world households likely felt the pinch even more.
Doug Short at Advisor Perspectives has some interesting charts is his post GDP Q1 Advance Estimate Disappoints at 2.2%.
This chart shows the disturbing trends.
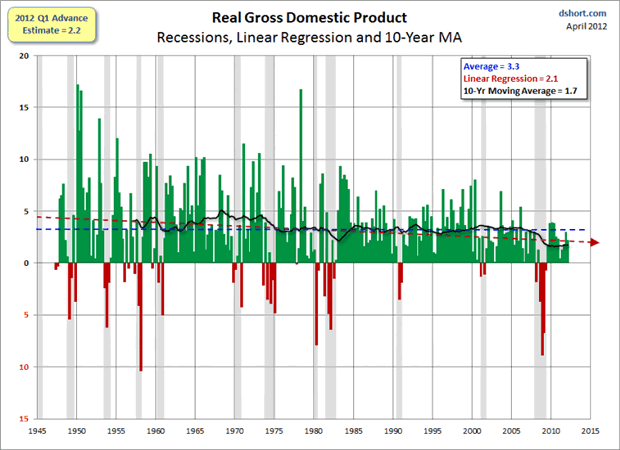
GDP Trends
- Average growth since 1945 is 3.3%
- Linear regression says growth is trending lower at 2.1%
- Over the last 10 years, growth averages a mere 1.7%
Take a good look at the last decade. The US only managed 1.7% growth in the biggest housing boom in history followed by the biggest multi-trillion dollar global stimulus effort in world history.
Three years into a recovery, growth (if you believe preposterous deflators) is a mere 2.2% but only 0% if you don't. Moreover, with parts of Europe in an outright depression, with even Germany and the UK in recession, and with China slowing significantly, the odds the US economy decouples for too much longer is now approaching zero.
I think the ECRI has its recession forecast reasonably correct. However, it may take a well-deserved GDP revision (likely after the next election) to prove it.
By Mike "Mish" Shedlock
http://globaleconomicanalysis.blogspot.com Click Here To Scroll Thru My Recent Post List
Mike Shedlock / Mish is a registered investment advisor representative for SitkaPacific Capital Management . Sitka Pacific is an asset management firm whose goal is strong performance and low volatility, regardless of market direction.
Visit Sitka Pacific's Account Management Page to learn more about wealth management and capital preservation strategies of Sitka Pacific.
I do weekly podcasts every Thursday on HoweStreet and a brief 7 minute segment on Saturday on CKNW AM 980 in Vancouver.
When not writing about stocks or the economy I spends a great deal of time on photography and in the garden. I have over 80 magazine and book cover credits. Some of my Wisconsin and gardening images can be seen at MichaelShedlock.com .
© 2012 Mike Shedlock, All Rights Reserved.
© 2005-2022 http://www.MarketOracle.co.uk - The Market Oracle is a FREE Daily Financial Markets Analysis & Forecasting online publication.