


The Jim Rogers View On Gold
Commodities / Gold and Silver 2013 Oct 18, 2013 - 09:13 AM GMTBy: Clif_Droke

 If October has held any surprises for anyone so far, it has to be the bears. While volatility has been in evidence, the crash that some analysts were predicting has so far failed to materialize.
One reason for this was the increase in short interest leading up to the start of the month. According to short interest data provided by Consensus Inc., bullish sentiment has been declining for the last few months and recently hit a low for the year to date. Investors and advisors alike, it seems, have been growing more bearish and had a less-than-favorable outlook for the market heading into the debt ceiling limit debate.
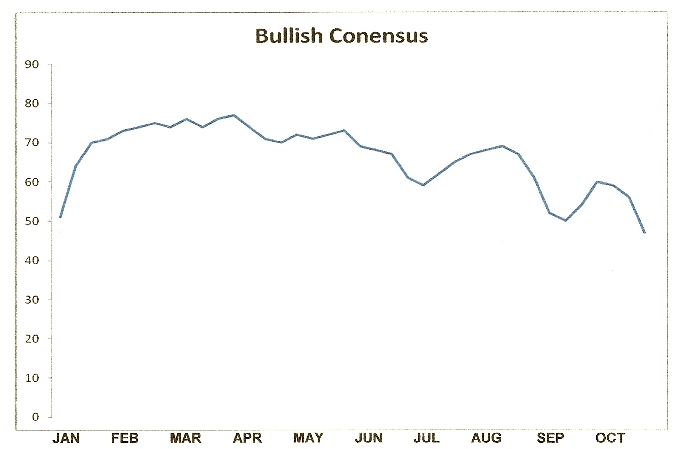
Now that the worrying is over in Washington, investors will get back to the task of surveying the investment landscape for opportunities. Sentiment will undoubtedly improve as fear is (temporarily at least) removed from the market. The lesson investors can take away from all this is that it rarely pays to lean too heavily to one side of the trade when everyone else is doing the same.
Barron's published an interesting interview with trader Jim Rogers. He was asked if the record levels of liquidity created by the Fed in recent years should push the stock market even higher. He responded by making the observation that Fed money usually goes into financial markets, but that the advance is getting narrower. He pointed out that fewer big stocks are rising, a trend similar to the one preceding the 2000 market top. I found his final remark in answering this question to be enlightening: "I don't know how long this will go on, but it can't go on forever. That said, you can't really short this market either."
I think that sums up my sentiment on this market perfectly, viz. the market advance is clearly narrowing with many internal divergences visible in recent months. It reminds us of the big divergence in the Advance-Decline line and new highs-new lows that began in late '98 or early '99. Yet I don't believe this market is "shortable" just yet. There's too much residual momentum still in play with the last few trading sessions a case in point.
Barron's also asked Rogers to share his outlook on gold. Rogers indicated that he still owns gold but is currently not a buyer. He points out that any asset class which rose for 12 straight years is anomalous and that a 50% retracement from its peak would take gold near $960. He added that 50% correction can be "quite normal."
"I know of nothing that has gone up for 12 years without a decline," he said, "but I'd also expect the correction to be different from normal." He added that he expects another buying opportunity for gold in the "next year or two" and that his long-term outlook calls for gold to eventually go "well over $2,000."
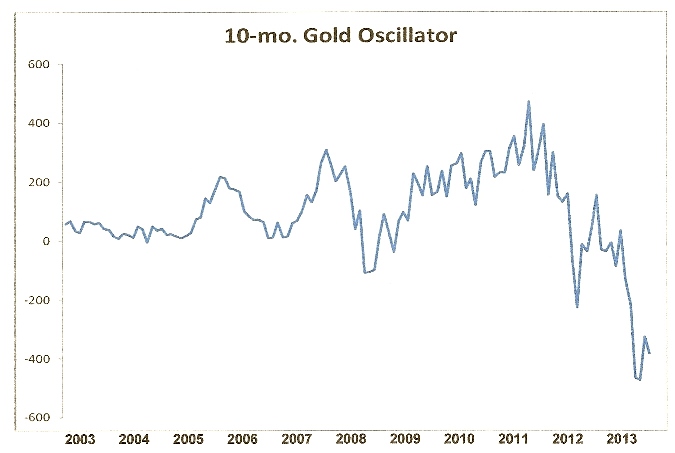
Rogers views on commodities tend to be prescient, so I won't contradict him on either point. There will, however, be worthwhile trading opportunities in the yellow metal in the interim. One such opportunity may soon be approaching. Consider that the gold price has recently reached its most oversold technical condition in over a decade, according to the 10-month price oscillator. This suggests an interim bottom should be near.
Meanwhile, a Federal Reserve governor recently credits the central bank with inflating asset prices since 2009 through its QE3 program. Housing prices have also risen thanks to the Fed; the median single-family home price was reported up 37.3% through August after hitting bottom in January 2012. The Fed is also trying to take credit for creating jobs via its monetary stimulus policy.
Yet that obscures the other side of the coin in the recovery. While housing starts and housing prices are up, construction jobs are not. As Ed Yardeni points out in his latest blog posting, "Housing starts are up from a low of 478,000 units during April 2009 to 891,000 units through August of this year. Yet residential construction jobs are up only 162,000 since they bottomed during January 2011, to 2.1 million in August. They are still 38% below the record high during the spring of 2006."
"So far, the so-called 'wealth effect'" hasn't created too many construction jobs," Yardeni observed. So why has the pace of recovery in the job market been so sluggish compared with the recovery of asset prices? Chalk it up to the underlying dynamics of the 120-year cycle of inflation/deflation. That cycle is down for one more year and until it bottoms there will always be a cyclical cross-current of deflation within the economy no matter how much artificial inflation the central banks of the world try to create.
The working class is still in the process of unwinding the debt and excess from the "party years" prior to the credit crisis. Wages for the average worker, moreover, haven't kept pace with the increase in retail food and fuel prices of recent years. Until this dynamic changes - which means either prices have to come down or wage go up - and until the deleveraging has completely run its course, economists have no reason to expect anything to change anytime soon.
Stock Market Cycles
Take a journey with me as we uncover the yearly Kress cycles - the keys to unlocking long-term stock price movement and economic performance. The book The Stock Market Cycles covers each one of the yearly cycles in the Kress Cycle series, starting with the 2-year cycle and ending with the 120-year Grand Super Cycle.
The book also covers the K Wave and the effects of long-term inflation/deflation that these cycles exert over stock prices and the economy. Each chapter contains illustrations that show exactly how the yearly cycles influenced stock market performance and explains where the peaks and troughs of each cycle are located and how the cycles can predict future market and economic performance. Also described in this original book is how the Kress Cycles influence popular culture and political trends, as well as why wars are started and when they can be expected based on the Kress Cycle time line.
Order today and receive an autographed copy along with a copy of the booklet, "The Best Long-Term Moving Averages." Your order also includes a FREE 1-month trial subscription to the Momentum Strategies Report newsletter: http://clifdroke.com/books/Stock_Market.html
By Clif Droke
www.clifdroke.com
Clif Droke is the editor of the daily Gold & Silver Stock Report. Published daily since 2002, the report provides forecasts and analysis of the leading gold, silver, uranium and energy stocks from a short-term technical standpoint. He is also the author of numerous books, including 'How to Read Chart Patterns for Greater Profits.' For more information visit www.clifdroke.com
Clif Droke Archive |
© 2005-2022 http://www.MarketOracle.co.uk - The Market Oracle is a FREE Daily Financial Markets Analysis & Forecasting online publication.