Housing Market Worst Since 1978- Heading for April Apocalypse?
Housing-Market / UK Housing Apr 16, 2008 - 02:48 AM GMTBy: Nadeem_Walayat

 The Royal Institute of Chartered Surveyors (RICS) report confirms that the UK housing market is in countrywide meltdown mode. House prices are falling at their fastest pace in 30 years (since records began). The net balance between those reporting price rises against price falls deteriorated to a reading of -78.5 in the three months to March 08, from -65.7 in February 08.
Whilst for many mortgage banks such as the Nationwide the downturn in the UK housing market seems to have emerged from out of the blue, as illustrated by a steady transition over the past 9 months from overly optimistic house price growth forecasts for 2008 of 5% to no change (Nov 07), to now starting to consider a fall in house prices by the end of the year. The problem with forecasts from mortgage banks is that they have a vested interest in a rising housing market, therefore the tendency is to 'talk the market up'. This was entirely expected as the September 07 article warned of history repeating - UK Housing Market on Brink of Price Crash - Media Lessons from 1989!
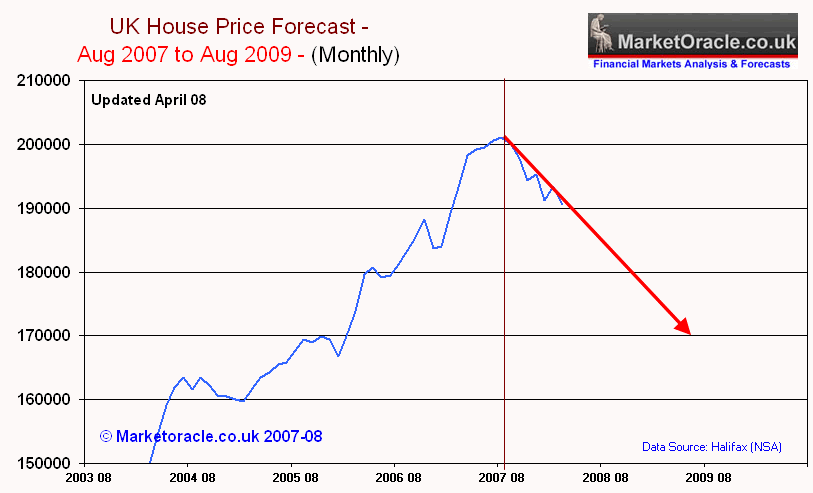
It is an apt time to remind readers of the long standing Market Oracle forecast of August 2007 for UK house prices to fall by 15% between August 2007 to 2009. This forecast has been reinforced and expanded upon during the past 9 months by more than 40 subsequent articles of analysis which confirm that the housing market is on track towards a major bear market that could eventually see UK house prices fall by 33% in real-terms from August 2007 peak to eventual trough.

Why an April Housing Market Apocalypse ?
UK house price data for April 2008 to be released in May 2008 is anticipated to show one of the biggest monthly falls on record, the first sign of this impeding decline to the market consensus was in the sharp drop in March of 2.5% (Halifax :SA). The April 08 'crashette' for UK house prices was forecast in November 2007, primarily to coincide with UK capital gains tax changes AND by the realisation by housing market participants that UK house prices were about to go negative on a year on year basis, therefore to spark speculative buy to let investors selling to prevent further loss of equity.
Current State of UK Housing Market
The UK Housing market is now into the 8th month of a multi-year bear market (as measured by data from the UK's biggest mortgage Bank, Halifax : NSA) The original forecast was for UK house prices to decline by 15% between the period August 07 to August 09, for which the UK house prices appear to be precisely on track as the above graph illustrates. The trend for the next quarter is expected to see a sharp deterioration before house prices level off later in the year to bring the indices back towards trend.
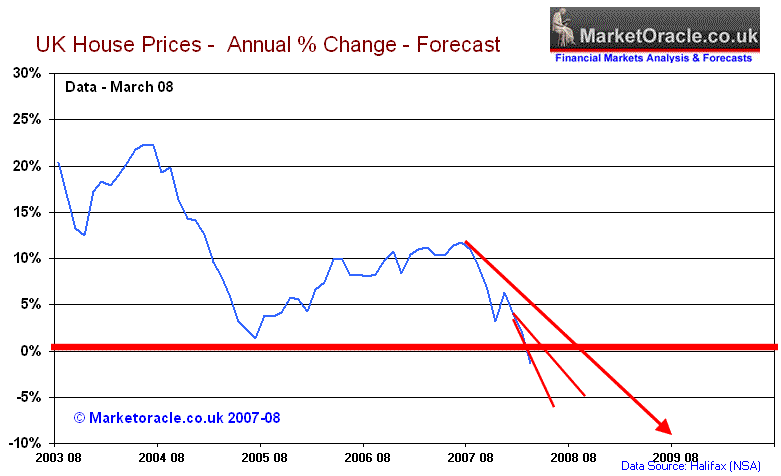
On an annualised basis, house prices are at the more extreme end of the trend forecast. This implies an acceleration in house price deflation, i.e. literally panic selling amongst speculators and home owners aiming to cash in and move to renting as the realisation hits home of the REAL loss of equity.

Driving Forces for House Price Deflation
Affordability
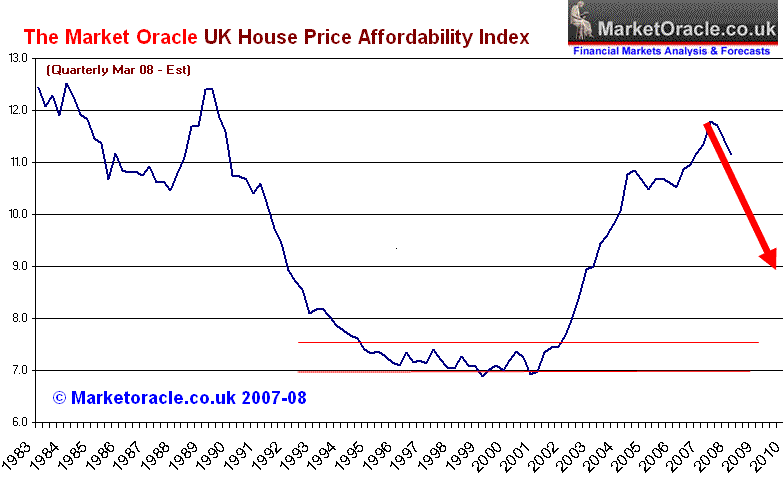
The US Housing market peaked at X5 average earnings, UK house prices have peaked in many areas at X7 earnings. US house prices are already down an average 15%, UK house prices are already down 5%. The run up in US house prices saw a rise of 250% over 10 years, UK house prices saw a rise of more than 350% over 10 years. Even so many commentary disagreed during 2007 that UK house prices had reached an extreme level of affordability.
UK house prices have moved to an extreme level of affordability and are likely to trend towards the lower extreme before a housing market bottom is in. The trend forecast is illustrated in the below graph.

Credit Crisis - End of the Credit Boom
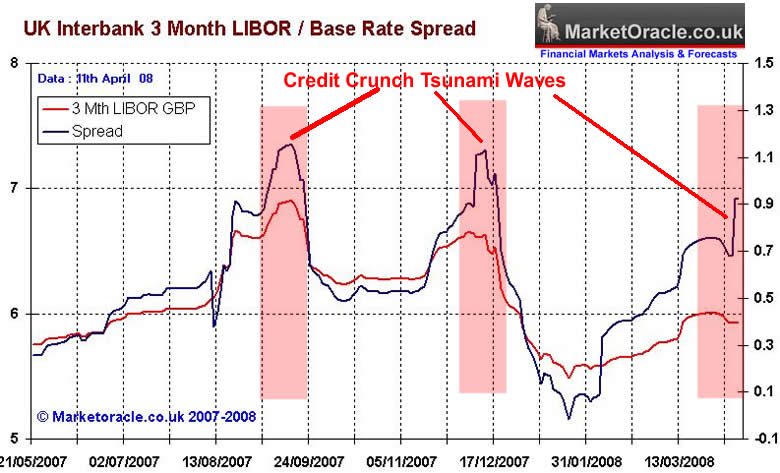
The credit markets have shifted from a climate of easy credit into a new climate of risk averseness and tight lending criteria, the consequences of which is deleveraging of much of the $500 trillions of derivatives bets by financial institution against assets such as the US housing market. This will tend to act as a feedback loop that will lead to an even tighter credit market. The aversion to risk is most clearly evident in the GBP LIBOR market (The interbank market determines the interest rate at which banks lend to one another) which illustrates the reluctance of the banks to lend to one another, both because of their growing bad debts and loss of future earnings as many of the past cash cows such as the trade in mortgage backed securities has seized, and thus in the in-ability to determine whether the borrowing bank will be able to make repayment.

The interbank market played a pivotal role during the credit boom as it would allow banks to borrow form other banks on a short-term basis to fund long-term positions i.e. mortgages. This was played out most publically with Northern Rock Bank which soon discovered that following the failure of two Bear Stearns Hedge funds as a consequence of the US subprime mortgage market in June 2007, that banks were suddenly unwilling or unable to lend huge sums to other banks.
Despite last Thursdays interest rate cut to 5% from 5.25%, which followed unprecedented action by the Bank of England in providing £15 billion in liquidity to the UK banking system in recent weeks. So far the interbank market has failed to respond to these actions, which saw the 3 Month Libor rate / base rate spread expand to recent credit crunch extremes as illustrated by the above graph. This results in a vicious cycle of banks withdrawing credit from borrowers as each Credit Crunch Tsunami Wave hits the banking system.
Could there be more Northern Rocks?
It would be surprising if there were not. The fact is that all mortgage banks are in for extremely difficult times due to mortgage related bad debts, and loss of profitable revenue streams, that's from the biggest HBOS to the smaller banks. In my opinion the two of larger banks that could face difficulties in the coming year are Alliance and Leicester and Bradford and Bingley. The governments response should be pre-emptive to prevent another run on a UK bank, one way of achieving this is by guaranteeing 100% of deposits of up to£100k per bank. The chancellor, Alistair Darling first declared his intentions to legislate for this in October 2007, thus far it seems the government has sat on their hands for 6 months. The government needs to act sooner rather than later otherwise more queues will form outside crisis hit banks in the future as the current guarantee only covers 100% of the first £35k per financial institution as defined as having separate registrations with the FSA.
Mortgage Payments Vs Renting
UK standard variable rate mortgage interest rates remain in excess of 6.5%, this despite three UK interest rate cuts bringing the base rate down to 5%. Even today the UK's biggest mortgage lender the Halifax is set to increase the interest rate charged on its most popular mortgages by 0.5%. Some 1 million fixed rate mortgages taken out during the height of the housing boom are expected to reset during the balance of the year to much higher standard variable rates with risk averse mortgage banks unwilling or unable to offer anything better than high standard rates of 6.5%+ to these customers. Even if lower rates can be achieved, invariably these are accompanied by high arrangement fees which if taken into account bring the interest rate back towards 6%+.
The costs of servicing an average £200,000 property with an average £150,000 mortgage is estimated at £9,750, add in maintenance and insurance costs of £2,000 then the annual cost for an home owner is £11,750 or £979 per month.
The current rent payable on an average property is £625 PCM, therefore house holders are paying 50% more per month than the cost of renting or £4,250 extra per year. Whilst during a housing boom such an extra cost is seen as a price well worth paying against the prospects of capital gains, however in an environment of falling house prices and loss of equity it is an real extra avoidable monthly cost that is deflating the UK consumer's pocket.
Equity Loss Vs Savings
The example of a property valued at £200,000 coupled with an £150,000 mortgage implies equity of £50,000. This equity in the form of savings would generate a return of £2,500 per year at a 5% interest rate. However a housing market that is on track to fall by 7.5% per annum is eroding the value of the equity by a a whopping £15,000 per annum. Therefore in 2 years the home owner will have effectively lost 60% of their equity or £30,000, against a £5,000 return that would have been generated by savings at 5% on the £50k.
During a housing Bear market home owners have gone from the wealth effect of house price appreciation to the deflationary effect of large losses in the equity that many home owners have viewed as an ATM to spend against in the form of Equity Withdrawals.
See the November 07 article Buy Or Rent A House in the UK - Five Scenarios of Gains or Losses's over the Next Five Years for more in depth analysis.
Repossessions - Supply Surge
By the end of 2008 more than 100,000 home owners are expected to be in negative equity, many of whom will abandon their houses under the weight of high servicing costs and negative equity. The expectation is for the number of repossessions to surge towards levels not seen since heights of the last housing bust that is expected to exceed 75,000 repossessions for 2008 which is still significantly above recent consensus forecasts of 48,000 repossessions against 27,000 for 2007.
Economic Contraction
The knock on effect on the wider economy by the twin forces of the global credit crisis and the UK housing bear market is impacting the consumer as the recent retail sales figures confirm a sharp drop in sales of 1.6% in March. The consequences for this is for contraction in corporate earnings and a downward spiral as companies cut back on investment and production. As corporate earnings disappoint over the coming year we can only expect more falls in the stock markets that act as a warning of economic contraction later in the year. Whilst politicians focus on high employment statistics they fail are acknowledge that employment statistics have been manipulated to such an extent that they under represent the true level of unemployment by several millions infact the true rate of current unemployment may be as high as 8 million against official statistics of 1.5 millions as the 8 million figure takes into account those adults of working age termed as economically inactive.
Additionally, unemployment tends to be a lagging indicator of economic activity and therefore reliance on this statistics gives false confidence to policy makers to avoid taking drastic and painful action until it is far too late. What is clear that the primary engine for much of the economic growth in the UK for the past 10 years, namely the financial services industry centered in London is now in recession and is experiencing significant job losses.
The UK economy is expected to end 2008 at growth levels of as little as 1.1% (Dec 07), which whilst not a recession it will however feel like a recession following an economy that has grown used to consistent at or above trend growth. The real pain will come during 2009 as the UK housing bear market continues to take many more home owners into negative equity. There is a strong probability that UK growth will contract during 2009 with the UK entering into a recession at least on par with that of the the early 1990's
Conclusion
Britains housing boom has been one of the biggest in the western world and it is highly likely that once the dust settles in some 2-3 years time, it will turn out to be one of the biggest housing busts in the west. The Housing bust of 2008 will be followed by a sharp slow down in economic activity during 2009 towards recession. Gordon Brown's government is running on borrowed time as the clock ticks towards a 2010 election deadline and thus there is a strong possibility of the government attempting to inflate its way out of a recession which will lead to a sharp fall in sterling accompanied by much higher than expected inflation during 2009 and 2010 than the current inflation rate which is expected to fall towards the government target by November 08. The government may even raise the CPI inflation target to 3%. In such a scenario nominal falls in house prices following August 2009 may be subdued against continuing sharp real term falls as a consequence of government election spending and high money supply growth as the Bank of England throws countless more billions of tax payers money at the banking sector.
Important UK Housing Market Articles :
By Nadeem Walayat
Copyright © 2005-08 Marketoracle.co.uk (Market Oracle Ltd). All rights reserved.
Nadeem Walayat has over 20 years experience of trading, analysing and forecasting the financial markets, including one of few who both anticipated and Beat the 1987 Crash. Nadeem is the Editor of The Market Oracle, a FREE Daily Financial Markets Analysis & Forecasting online publication. We present in-depth analysis from over 120 experienced analysts on a range of views of the probable direction of the financial markets. Thus enabling our readers to arrive at an informed opinion on future market direction. http://www.marketoracle.co.uk
Disclaimer: The above is a matter of opinion provided for general information purposes only and is not intended as investment advice. Information and analysis above are derived from sources and utilising methods believed to be reliable, but we cannot accept responsibility for any trading losses you may incur as a result of this analysis. Individuals should consult with their personal financial advisors before engaging in any trading activities.
Attention Editors and Publishers! - You have permission to republish THIS article if published in its entirety, including attribution to the author and links back to the http://www.marketoracle.co.uk . Please send an email to republish@marketoracle.co.uk, to include a link to the published article. Nadeem Walayat Archive |
© 2005-2022 http://www.MarketOracle.co.uk - The Market Oracle is a FREE Daily Financial Markets Analysis & Forecasting online publication.


