


Third Longest Stocks Bull Market in History
Stock-Markets / Stocks Bull Market Dec 06, 2014 - 03:19 PM GMTBy: Tony_Caldaro

 The market started the week at SPX 2068, gapped down to 2050 on Monday, then made higher highs for the rest of the week. For the week the SPX/DOW gained 0.55%, the NDX/NAZ lost 0.40%, and the DJ World index lost 0.25%. Economic reports on the week were mixed. On the uptick: construction spending, ISM services, non-farm payrolls, long term investing, plus weekly jobless claims improved. On the downtick: ISM manufacturing, consumer credit, the WLEI, the ADP index, and the trade deficit. Next week we get Retail sales, Export/Import prices and the PPI.
LONG TERM: bull market
Last weekend we discussed, and posted in the public charts, three potential bull market counts being considered in the OEW camp. We assigned a 40% probability to the count posted on the SPX charts, and a 30% probability to each of the counts posted on the DOW and NAZ charts. This week nothing occurred in the market to change that view.
What did change, however, is that the bull market extended into its 69th month with new highs in the SPX/DOW indices. This is important, and going mostly unnoticed. While OEW quantifies the medium term trends, (weeks to months), it also quantifies the long term trends, (months to years). During the entire 130 years of US stock market data, (February 16, 1885), there have been only five long term uptrends that have lasted five years or longer. One lasted 13 years, (1987-2000), one lasted 8 years, (1921-1929), and three have lasted 5 years, (1932-1937), (2002-2007), (2009-2014 so far). The 1932-1937 bull market was actually 56 months, and the 2002-2007 bull market was 60 months. This places our current bull market as the third longest in modern history. What may have been already observed by Fibonacci fans, is that each of the four completed bull markets ended in Fibonacci years: 5, 8 or 13. This suggests, should our bull market make new highs next month, its sixth calendar year. It is likely to continue into 2017, its eight calendar year. No guarantees. But stock market history suggests it is certainly possible.

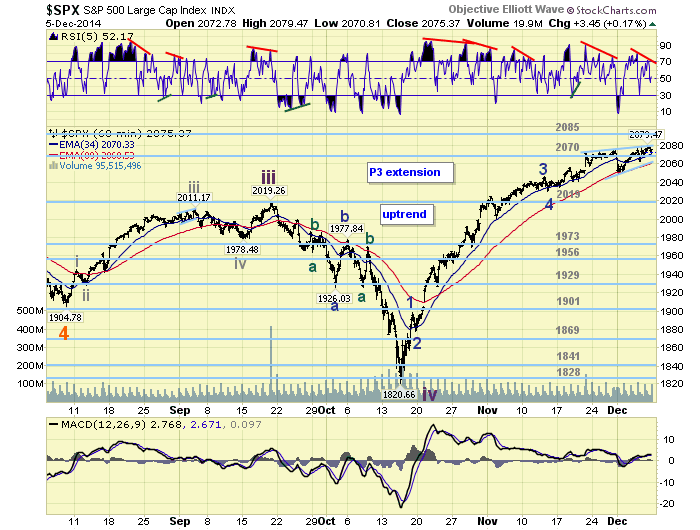
Our long term OEW count continues to suggest this bull market is still in Primary wave III of a five primary wave bull market. As you can see on the chart above, Primary waves I and II ended back in 2011. And, a continually extending, and subdividing, Primary III has been underway since then. This 3+year rise has been difficult to track at times because of all the subdivisions. Twice we had potentially completed counts for Primary III. And, twice the market corrected only a small amount, and then rallied to new highs. When the current uptrend ends, the next correction, (be it 5%, 10% or 20%), should help resolve the current three count inflection point.
MEDIUM TERM: uptrend
The current uptrend, which we are labeling Intermediate wave v of Major 3, began in mid-October at SPX 1821. Completing the first week of December, the uptrend has rallied to SPX 2079 or 14%. The advance started quite rapidly, rising nearly 11% in just over two weeks. Since then, five weeks later, it has only gained another 3%. We have been counting this uptrend with five Minor waves: 1898-1878-2046-2030-2079 so far. Minor wave 3 divided into five Minute waves: 2024-2001-2041-2032-2046. Minor wave 5, however, has been choppy and appears to be forming a complex diagonal triangle.
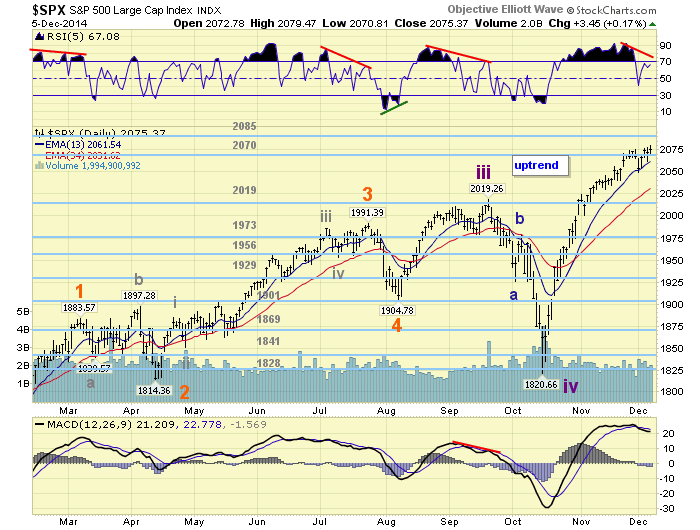
Thus far from the Minor 4 SPX 2030 low, every pullback has overlapped the preceding advance: 2056-2040-2076-2050-2076-2062-2077-2066-2079 so far. Should this pattern conclude as a diagonal triangle, the high should mark the high of this uptrend. Then a correction should follow lasting for at least several weeks. Currently there are negative RSI divergences on the SPX/DOW daily charts, and negative crosses on the daily MACD for all four major indices. Also this week, the NDX/NAZ have lagged the SPX/DOW failing to make new bull market highs. This suggests the uptrend could rollover soon, or require higher highs in the NDX/NAZ first to set up negative divergences there as well. Medium term support is at the 2070 and 2019 pivots, with resistance at the 2085 and 2131 pivots.
SHORT TERM
While Minor wave 5 has certainly been choppy, we just noticed another potential count: Minute i 2056, Minute ii 2040, Minute iii 2076, Minute iv triangle (2050-2076-2062-2077-2066), Minute v 2079 so far. This count would suggest that Minute wave v has been underway since Thursday’s SPX 2066 low. Since Minute iii was longer than Minute i, Minute v could continue higher until it completes. This count would favor the higher highs in the NDX/NAZ scenario before this uptrend ends.
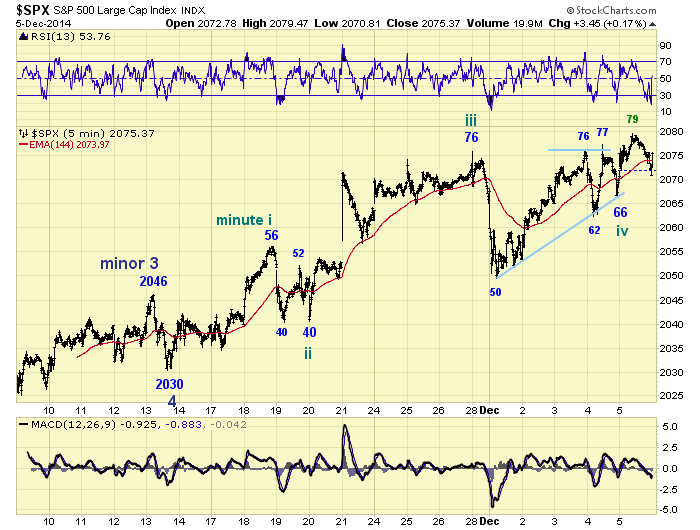
While the market did clear the OEW 2070 pivot on Friday. It took six attempts over the past 2+ weeks to do so. It dipped back within the range, however, after the SPX 2079 new high. Overhead resistance remains between the SPX 2078-2084 Fibonacci cluster zone, and then the OEW 2085 pivot range. So it does appear the market will continue to struggle to make higher highs. Short term support is at the 2070 pivot and SPX 2050, with resistance at the 2085 and 2131 pivots. We continue to see SPX 2050 as key support for this uptrend. Short term momentum ended the week at neutral after establishing another negative divergence at new highs.
FOREIGN MARKETS
Asian markets were mostly higher on the week for a net gain of 1.5%.
European markets were all higher on the week for a net gain of 1.6%.
The Commodity equity group were all lower for a net loss of 4.5%.
The DJ World index remains in an uptrend but lost 0.25% on the week.
COMMODITIES
Bonds remain in a downtrend and lost 1.0% on the week.
Crude remains in a downtrend and lost 0.2% on the week.
Gold is in an uptrend and gained 2.3% on the week.
The USD is still in an uptrend and gained 1.1% on the week.
NEXT WEEK
Tuesday: Wholesale inventories, and an open FED meeting. Wednesday: the Budget deficit. Thursday: weekly Jobless claims, Retail sales, Export/Import prices, and Business inventories. Friday: the PPI and Consumer sentiment. Best to your weekend and week!
CHARTS: http://stockcharts.com/public/1269446/tenpp
http://caldaroew.spaces.live.com
After about 40 years of investing in the markets one learns that the markets are constantly changing, not only in price, but in what drives the markets. In the 1960s, the Nifty Fifty were the leaders of the stock market. In the 1970s, stock selection using Technical Analysis was important, as the market stayed with a trading range for the entire decade. In the 1980s, the market finally broke out of it doldrums, as the DOW broke through 1100 in 1982, and launched the greatest bull market on record.
Sharing is an important aspect of a life. Over 100 people have joined our group, from all walks of life, covering twenty three countries across the globe. It's been the most fun I have ever had in the market. Sharing uncommon knowledge, with investors. In hope of aiding them in finding their financial independence.
Copyright © 2014 Tony Caldaro - All Rights Reserved Disclaimer: The above is a matter of opinion provided for general information purposes only and is not intended as investment advice. Information and analysis above are derived from sources and utilising methods believed to be reliable, but we cannot accept responsibility for any losses you may incur as a result of this analysis. Individuals should consult with their personal financial advisors.
Tony Caldaro Archive |
© 2005-2022 http://www.MarketOracle.co.uk - The Market Oracle is a FREE Daily Financial Markets Analysis & Forecasting online publication.