


Will The Stock Market Return to Earth This Summer?
Stock-Markets / Stock Markets 2015 Aug 13, 2015 - 01:11 PM GMTBy: Clif_Droke

 What accounts for the equity bull market's stubborn refusal to bend to the bears' will despite a clear lack of internal strength? That's the question investors are asking right now in what has been a grinding, directionless stock market this summer.
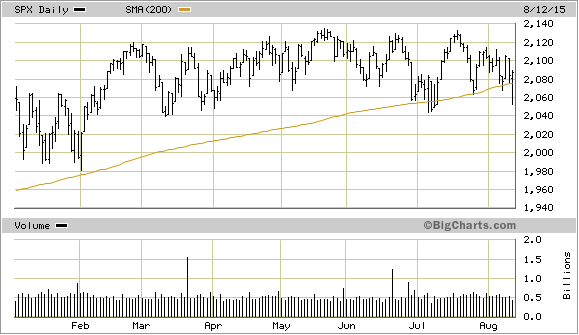
The answer to that question is simple to answer, yet complex when you look below its surface. Corporate funds are driving this bull market much more so than direct participation by small retail investors. The pattern that has been established since the start of this year has been a case of wash, rinse, repeat: the S&P 500 Index (SPX) rallies to either a new high or a previous high, then the sellers enter to force stock prices lower. The sellers rarely succeed in pushing the SPX much below its 200-day moving average before the buyers step back in to regain control. The net result of this continual process has been a lateral trading range for much of this year.
What's remarkable about the market's resilience for the year to date is that internal momentum for the NYSE broad market has been negative in recent months, as the following graph shows. This indicator is based on the new 52-week highs and lows and underlines the stock market's internal path of least resistance based on the rate of change (momentum) of the new highs-new lows. As my late mentor Bud Kress always believed, the new highs and lows are the single best statistic for discerning what he called the "incremental demand for equities." The following chart shows the complete series of Hi-Lo Momentum (HILMO) indicators as originally conceived by Kress. They show a stock market that is beset by numerous cross-currents and a rather large degree of internal weakness.
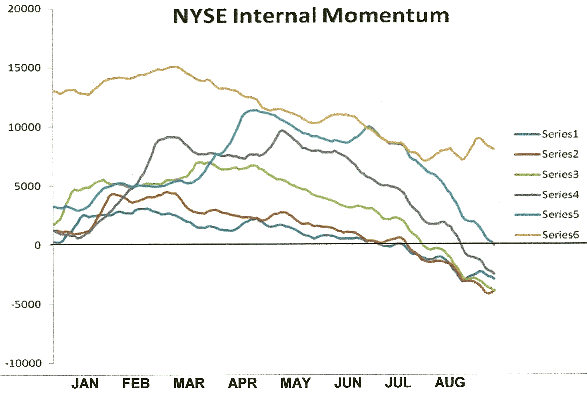
Normally when NYSE internal momentum is as weak as this chart illustrates, the market would have nowhere to go but down. After all, the HILMO indicators show the market's internal path of least resistance and when they're all declining in unison it means that there are way more new 52-week lows than there are new 52-week highs. So why has the stock market refused to decline in a sustained fashion all year? Probably because the public aren't major participants in equities, unlike in previous bull markets. Institutional funds are the primary demand drivers for stocks, and institutional participants are far less likely to sell heavily unless they have someone else to sell to, namely the public.
A shrinking supply of stocks is another reason for the market's resilience against bear raids in recent years is another factor worth mentioning. The number of U.S. exchange-listed stocks has declined almost every year since the late 1990s. According to the Strategas Group, the total number of exchange-listed companies sank to 4,900 by the end of 2012 after peaking at 8,800 in 1997. "De-listings of failed uncompetitive technology stocks, another M&A surge in the mid-2000s and a relative shortage of initial stock offerings all contributed," Michael Santoli observed in December 2013. Sarbanes-Oexley and the growth of buyout funds devoted to acquiring smaller companies and turning them private also contributed to the shrinkage of publicly traded stocks.
The trend of shrinking equity supply may be in the process of ending, however. The number of U.S. listed stocks rose to 5,008 as of last year, according to The Wall Street Journal. This marked the first time since the Internet stock boom of the late '90s that the number of public companies actually grew.
Dr. Ed Yardeni has another explanation for the stock market's resilience since 2013. "Investors have been impervious to the sorts of anxiety attacks that caused significant corrections during the first four years of the bull market," he recently observed. Yardeni noted that falling commodity prices have been a concern for investors, as have the meltdown in Chinese stock prices and the ongoing bailout trauma in Greece. Yet the U.S. equity market has refused to panic. He attributes this to the rising trend of the 52-week average of the Investors Intelligence Bull/Bear Ratio.
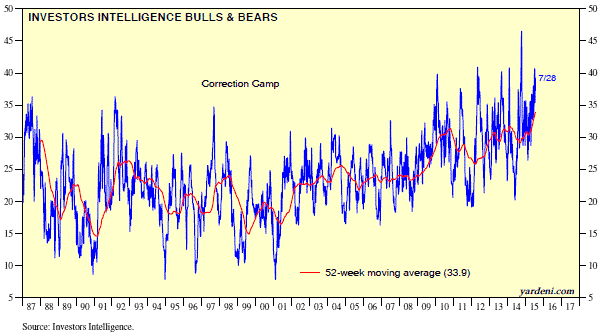
This series, which begins in 1988, is near record-high territory. Yardeni explained: "That's because the sentiment survey's percentage in the correction camp is also at a record high. In other words, when trouble mounts, sentiment doesn't turn bearish. Rather, it turns mildly defensive, betting that any selloff will be just a correction in a bull market. Ironically, that helps to explain why corrections have been missing in action since the start of 2013."
What it would it take to panic the big institutional investors into selling stocks heavily? More than perhaps any other factor, the bull market in equities is being driven by institutional investors' belief that the U.S. economy is gradually improving. Indeed, virtually every positive economic news headline has been greeted with enthusiasm on Wall Street. Even negative news is often used as an excuse by big investors to buy stocks based on the assumption that it bolsters the case for the Fed not raising interest rates.
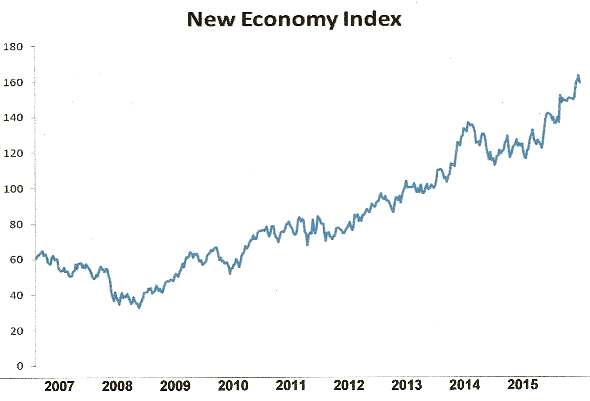
The belief that the domestic economy is improving is supported by the New Economy Index (NEI), a measure of U.S. retail economic strength, is near an all-time high. Note the progression of the NEI trend since breaking out of a sideways range earlier this year. NEI has continued higher since then, a sign that U.S. consumers are still spending despite the bad news about the global economy.
As long as consumers believe their jobs to be secure and the U.S. economy to be inviolable, the retail spending trend isn't likely to abate anytime soon. Neither, for that matter, is institutional investors' refusal to cash out their stock market holdings as the bull market nears its seventh year of existence.
Mastering Moving Averages
The moving average is one of the most versatile of all trading tools and should be a part of every investor's arsenal. Far more than a simple trend line, it's also a dynamic momentum indicator as well as a means of identifying support and resistance across variable time frames. It can also be used in place of an overbought/oversold oscillator when used in relationship to the price of the stock or ETF you're trading in.
In my latest book, Mastering Moving Averages, I remove the mystique behind stock and ETF trading and reveal a simple and reliable system that allows retail traders to profit from both up and down moves in the market. The trading techniques discussed in the book have been carefully calibrated to match today's fast-moving and sometimes volatile market environment. If you're interested in moving average trading techniques, you'll want to read this book.
Order today and receive an autographed copy along with a copy of the book, The Best Strategies for Momentum Traders. Your order also includes a FREE 1-month trial subscription to the Momentum Strategies Report newsletter: http://www.clifdroke.com/books/masteringma.html
By Clif Droke
www.clifdroke.com
Clif Droke is the editor of the daily Gold & Silver Stock Report. Published daily since 2002, the report provides forecasts and analysis of the leading gold, silver, uranium and energy stocks from a short-term technical standpoint. He is also the author of numerous books, including 'How to Read Chart Patterns for Greater Profits.' For more information visit www.clifdroke.com
Clif Droke Archive |
© 2005-2022 http://www.MarketOracle.co.uk - The Market Oracle is a FREE Daily Financial Markets Analysis & Forecasting online publication.