


Gold And Silver – Hope And Change From Last Week? Little Hope, Little Change
Commodities / Gold and Silver 2015 Dec 05, 2015 - 12:58 PM GMTBy: Michael_Noonan

 Was last week the start of something big? You be the judge of what the market is saying.
There is a reason and purpose why we always use and refer to the weekly charts, and the monthly at the end of each month. These higher time frames are more controlling over the lower time frames, particularly the daily chart upon which most rely. From the daily, many then choose to view the markets from an intra day perspective, as though a closer time frame will give better results. That is not the case.
Lower, intra day time frames are more problematic. One’s frame of reference is occupied with faster moves that require quicker decisions and often result in more losses than profits. Quite frankly, many traders lack the discipline necessary, and even more importantly, do not have a detailed set of rules of engagement. It may seem tedious that we keep saying to wait for confirmation before making a buy/sell decision, yet the futures markets are dominated by highly skilled professionals and, just as often, cartels or even governments that control activity.
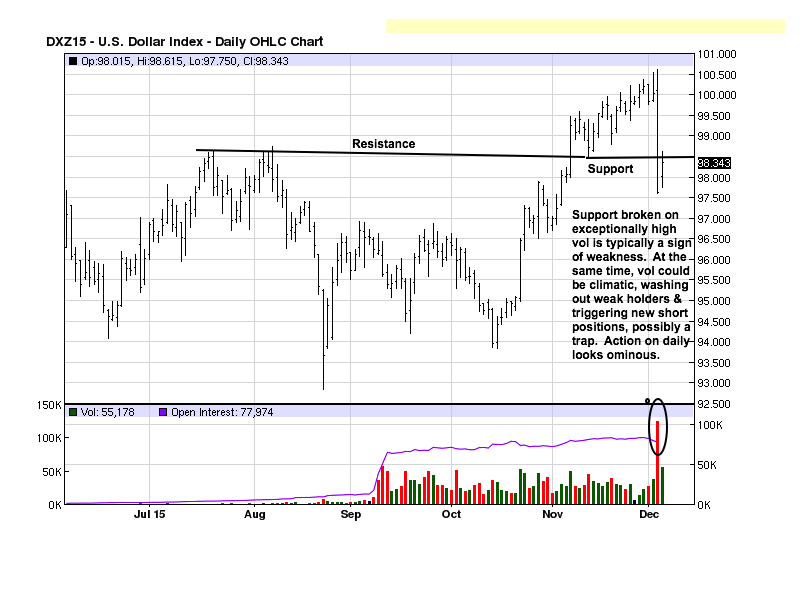
The daily fiat “dollar” chart serves as an example. Recent support was decisively broken with a wide range bar and on very strong volume. Typically, this is how trends undergo change. However, the FX markets are strictly controlled by the primary central banks, and very little trading information is provided by them, yet they see all buy/sell orders from all participants providing a huge advantage for the “house,” as it were.
No one can be certain of insipid Draghi’s impact on the market last Thursday that generated a huge increase in volume activity and equally huge losses for many traders. Is that volume a legitimate break of support that will change the trend, or is the volume climatic to the downside, over-extending the sell-off through support, triggering weak hands to exit, even some professionals caught on the wrong side, as well as resting stops being hit and new selling by computerized programs? If the latter, then last week could be nothing more than a bear trap where sellers will have to pay up to cover short positions.
By having a set of rules and a game plan, and a solid plan always incorporates stops to protect positions at all times, one can minimize risk exposure. Any well-developed set of rules would not be buying recent highs because the risk exposure is too great. Last Thursday proves that kind of exposure from imprudent buying.
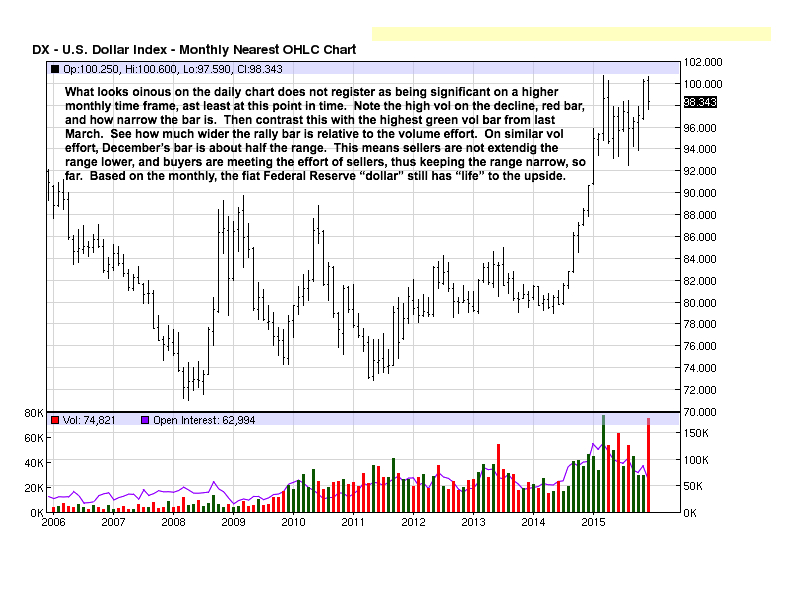
What impact will last week have? Looking only at a daily chart, it looks rather ominous, as we purposefully described. When one shifts perspective by looking at higher time frame charts, the results are quite different, as the monthly chart will show.
We get a totally different “look” and sense of expectation concerning the trend. There does not appear to be much change, if any, in the stronger monthly trend. Price is still well above most of the activity for all of 2015. In fact, when you compare the volume for the month, to date, and the small size of the range, the month being still young, it looks like sellers did not make much of a dent in the up trend.
Then, compare the volume spike in March and how much larger the trading range was relative to current December. Firstly, the volume spike from last March was a red flag for longs because it suggested sellers were just as active in high numbers as buyers at the then top of a rally. Smart money buys low, on increased volume, and sells high, also on increased volume. That is why the high volume was a red flag denoting strong seller presence at a high area.
The fact that the market traded lower-to-sideways for the next nine months confirms the observation about sellers. What the sideways activity says is that the impact of sellers may have stopped price from going higher, they had little ability to push the market lower. We have commented that the reaction since the March high has been weak, and weak reactions tend to lead to higher prices, and higher prices were evident since October.
There is no clear answer on the “dollar” topping here, or not, but the monthly chart is telling a much different “story” from the daily. There is much more to how one could have read this market activity, but these two charts show how easily one can miscalculate a market by not being aware of all time frames and not having a defined set of rules.
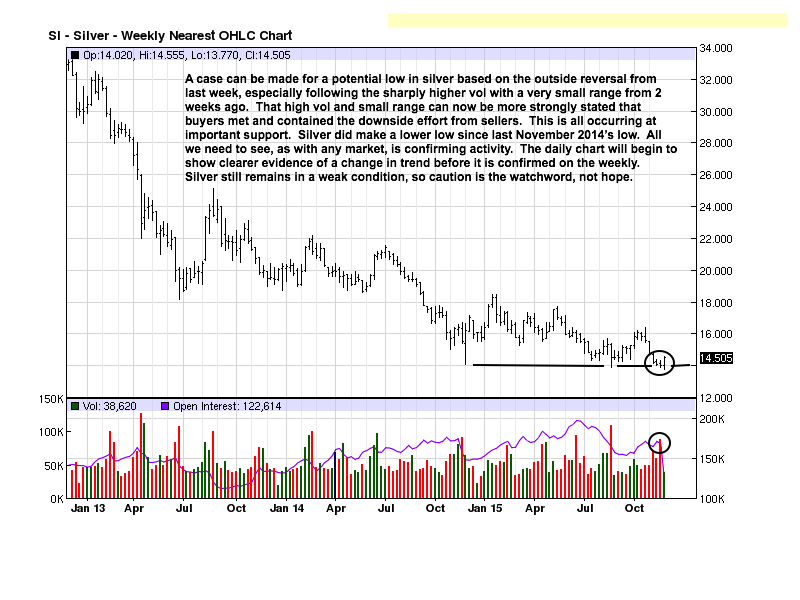
The chart comments set out the facts from the chart as it exists today. Gold is still in a weak market condition. Is a bottom forming? Like we said last week, we keep getting closer without knowing how close the anticipated bottom will be.
There is reason to be on an alert for continued near-term strength in this nascent rally, really just one week. The outside reversal following the prior week’s sharply higher volume can be positively construed. The same could have been said of the swing low in December 2013, October 2014, and the shorter live rally that started in March 2015. None led to a change in trend.
Based on this factual history, you can better understand why confirmation is so vital. It takes more patience than many want to exercise, wanting immediacy and clarity, but that is not how markets function, especially like in PMs that are being overtly suppressed by the globalist’s Federal Reserve, for the most part.
If one wanted to presume that a bottom is in for gold, [and we are not making such a presumption], then one can see the layers of resistance above current prices that would impede “normal market rallies” in a not so normal market. Whatever the potential for a turnaround may be, at this point, it will take some time to break through the layers of built-up resistance to change the existing trend.
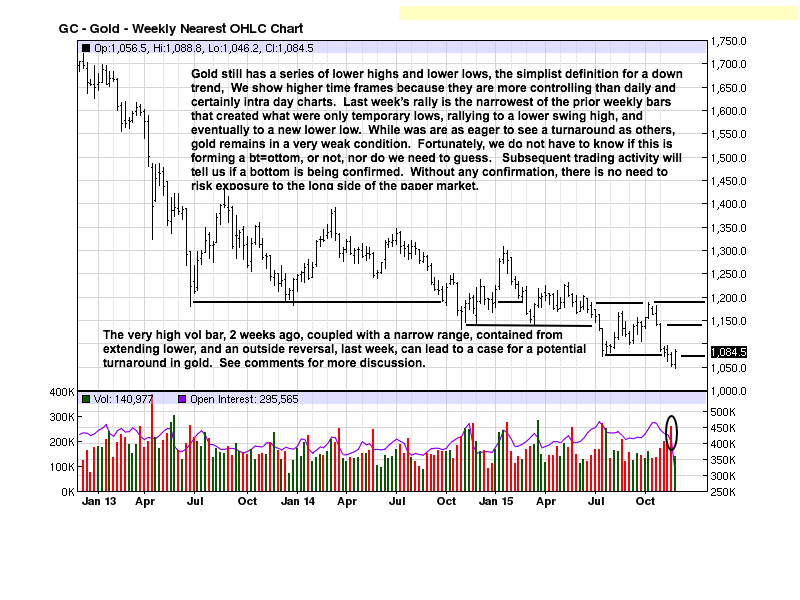
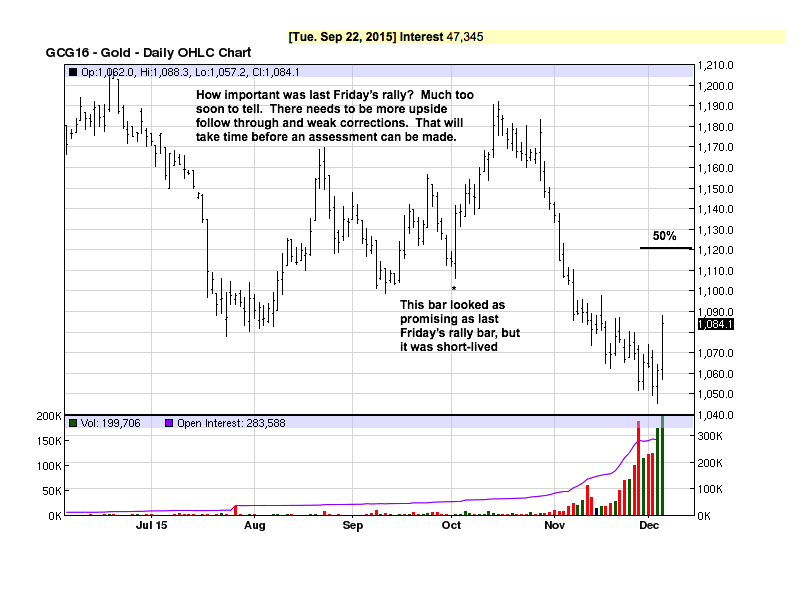
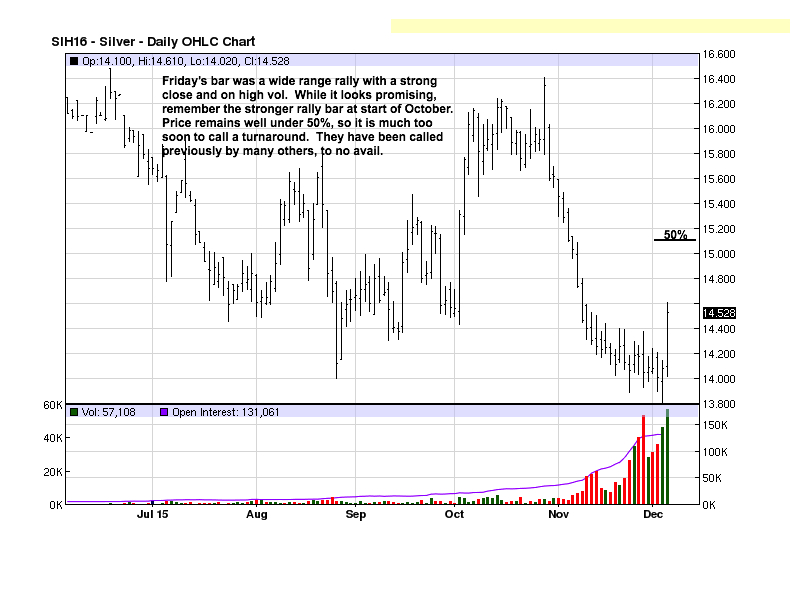
Trend changes are noted sooner on lower time frames, like this daily v the above weekly chart. Look how far away even a 50% retracement is on the daily chart. Friday’s strong rally may have been encouraging, but last October’s wide range strong rally was greater than Friday’s, and all that resulted was another lower swing high. No change in trend was confirmed. Therefore, there has been no reason to position trade from the long side of the futures paper market.
The case for a potential change developing on the weekly gold chart is more compelling on the weekly silver chart by virtue of how the support line has been persistently holding. Gold, by contrast, has been a series of consistent lower swing lows.
We say the watchword is caution because the current activity has to be confirmed by future activity. Hoping for change will not do. What we are saying is the daily silver chart becomes more important to watch for a potential change in market character for any change will show up there, first.
As with gold, the daily silver chart is not that encouraging for anticipating a change in trend. The EDM [Ease of Downward Movement], since the late October swing high, making a new recent low, does not auger for an immediate change in trend. The weekly chart shows a possible framework for change, but the daily says there is a lot of work required to shore up that framework.
Stay with the physical, and add as one can or feels comfortable. There is no sense in complaining about where the price of silver is, [and gold], for the price is artificial, but still a reality, and at some point that does not appear to be soon, the reality of demand will kick in, but not before the reality of how the globalists are playing this out to the bitter end.
Like it or not, patience will be required, still, going in to 2016.
Michael Noonan, mn@edgetraderplus.com, is a Chicago-based trader with over 30 years in the business. His sole approach to analysis is derived from developing market pattern behavior, found in the form of Price, Volume, and Time, and it is generated from the best source possible, the market itself.
© 2015 Copyright Michael Noonan - All Rights Reserved Disclaimer: The above is a matter of opinion provided for general information purposes only and is not intended as investment advice. Information and analysis above are derived from sources and utilising methods believed to be reliable, but we cannot accept responsibility for any losses you may incur as a result of this analysis. Individuals should consult with their personal financial advisors.
Michael Noonan Archive |
© 2005-2022 http://www.MarketOracle.co.uk - The Market Oracle is a FREE Daily Financial Markets Analysis & Forecasting online publication.