


US Economy Slides One Step Further Towards A Recession
Currencies / Recession 2016 Feb 08, 2016 - 01:05 PM GMT

 SUMMARY:
This article reviews whether the US is potentially sliding towards an economic recession, as defined by NBER.
- The St. Louis FED publishes a monthly report that presents the output from its smoothed US recession probabilities model.
- The model covers the period from June 1967 to the present day, and during this period there have been seven US recessions, as defined by the National Bureau of Economic Research (NBER).
- The FED model has three false positives and zero false negatives. All three false positives were within two years of a US recession starting, so they can be considered as early indicators of a recession rather than false positives.
- A new US recession monitor has been developed by the author to take the output from the St. Louis FED recession model and generate an early "warning" signal and a "US recession" signal.
- The "US recession" signal has an accuracy of 98.6% when verified back against the dates of recessions from NBER.
- As of February 2016, a recession "warning" signal is now in play, and the next two reports for March and April will confirm or dismiss the warning signal for the start of a US recession.
- If the "warning" signal is confirmed then there is a 70% chance that a US recession has already begun or could begin in the next few months.
INTRODUCTION
The Federal Reserve Bank of St. Louis publishes a monthly report presenting the output from its smoothed US recession probabilities model. The most recent report was published Monday February 1, 2016. The data in the report is delayed by 2 months, hence the February report covers the time period up to November 2015.
The St. Louis FED model was originally developed by Marcelle Chauvet and presented in the paper ""An Economic Characterization of Business Cycle Dynamics with Factor Structure and Regime Switching". Additional work, including an analysis of the performance of the FED model, was completed by Marcelle Chauvet & Jeremy Piger and presented in the paper "A Comparison of the Real-Time Performance of Business Cycle Dating Methods". Links to these papers (in PDF form) can be found on the St. Louis FED website.
A new US recession monitor has been developed by the author of this article to convert the output from the St. Louis FED model into an early "warning" signal and an accurate "US recession" signal. Results show that the "US recession" signal from the monitor has an accuracy of 98.6% when measured against the official dates of US recessions, as defined by the National Bureau of Economic Research (NBER).
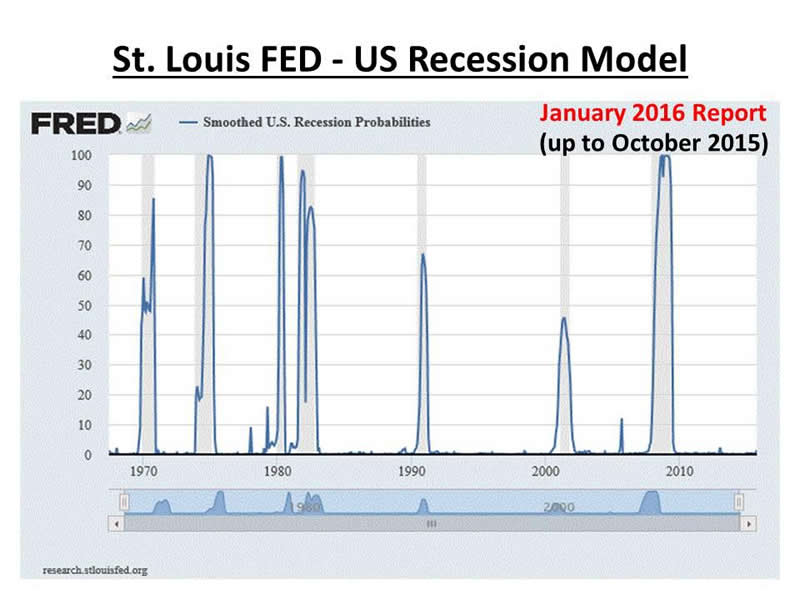
The chart below shows an example from last month's January 2016 report. The vertical grey bars indicate US recessions, as defined by NBER, and the blue line shows the smoothed US recession probabilities.
DETAILS OF THE ST. LOUIS FED RECESSION MODEL
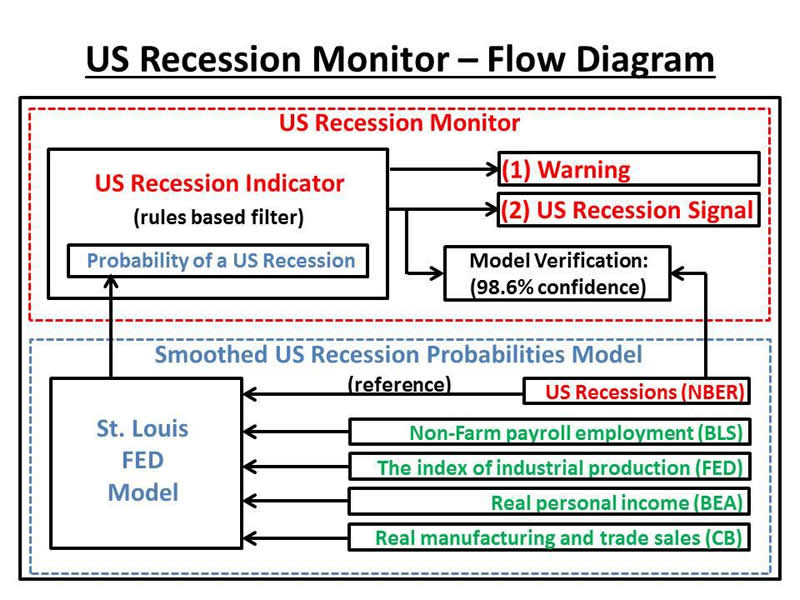
In terms of how the model works, the St. Louis FED states that the smoothed US recession probability is obtained from a dynamic-factor markov-switching model applied to four monthly coincident variables:
[1] Non-Farm payroll employment
[2] The index of industrial production
[3] Real personal income (excluding transfer payments)
[4] Real manufacturing and trade sales
The model output is a percentage value that reflects the likelihood that the US economy is in a recession. Usually, the output is between 0% and 1% for the majority of the time, however, it does rise significantly to a value between 20% and 100% once a recession has started. Monthly outputs from the model will remain at the elevated level until the recession ends, at which point it returns to a value of between 0% and 1%, once again.
The model is not seasonally adjusted, however, the model output does reflect changes due to revised input data (especially non-farm payroll employment) so that monthly output percentages from the model do tend to take a month or two to settle and become firm.
For example, the report published in early June 2015 last year, covered data up to March 2015. The output percentage for the June report showed a small increase above a key threshold, indicating that a recession might be close. The following month's July 2015 report, covering data up to April 2015, showed a downwards revision to the percentage output for March 2015, thus removing the threat of a recession at that time.
ST LOUIS RECESSION MODEL ACCURACY
The St. Louis FED model covers the period June 1967 to the present, which is a total of 582 months (approximately 50 years). During this period there have been seven recessions as defined by NBER.
All seven of the recessions are correctly identified by the model, so there are no false negatives. In all, there are ten signals that a recession may have started so there are three false positives seen in January 1978, April 1979 and December 2005 (see the chart above). In each of these three cases a recession did start within two years, so in simple terms the model can be seen as 100% effective for identification of a recession starting within two years or 70% effective for a recession starting within a few months.
NEW US RECESSION MONITOR
In an attempt to eliminate the false positives from the St. Louis FED model, a new US recession monitor has been developed to filter the output from the St. Louis FED model and create two specific signals.
The first signal is a "warning" signal that is generated in advance of a recession starting, alerting users to the fact that a recession is likely on the horizon. The second signal is a "US recession" signal that triggers when a recession is active.
Historically, a "warning" signal usually means that a recession is on the horizon, and will start soon, but in the weakest case (about a third of the time) the signal indicates that a recession is anything up to two years away. In simple probability terms, after a "warning" signal is recorded and confirmed there is a near 100% chance that a US recession will start in about two years or less, and a 70% chance that is will begin within a few months. There is a small 5%-10% chance that a US recession may have already begun.
A backtest of the new "US recession" signal from the monitor confirms an accuracy of 98.6% when compared with the dates of recessions, as defined by NBER. Specifically, the monitor correctly identifies the status (recession or no recession) of 574 months from the total of 582 months elapsed since the model began in June 1967.
The chart below shows the interaction between the St. Louis FED model and the new US recession monitor.
CURRENT OUTPUT FROM US RECESSION MONITOR
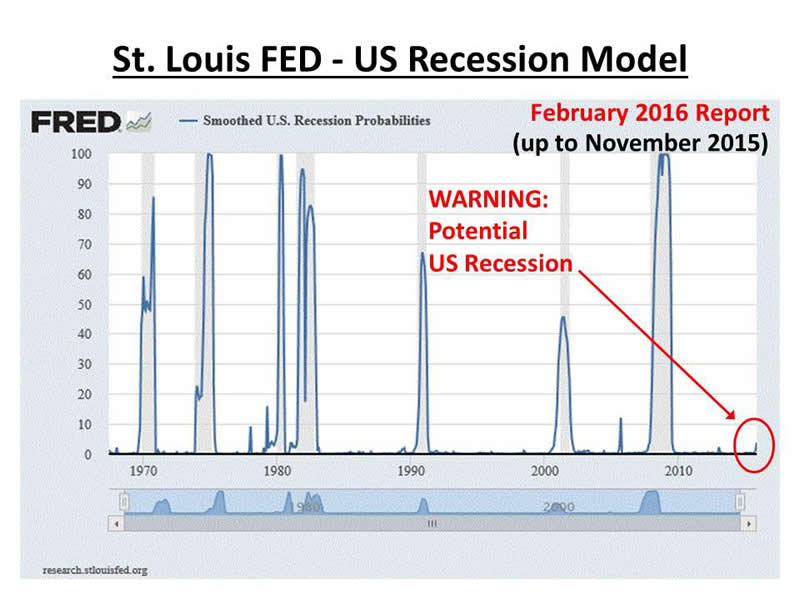
The chart below, from the February 2016 report, shows the output percentages from the FED model up to the start of November 2015. The vertical grey bars indicate US recessions, as defined by NBER. The new US recession monitor is now showing a "warning" signal.
The next few reports for March and April are crucial, in terms of determining whether a recession has started. If the output percentage value steadily rises over the next two reports then it is likely that the US is about to head into a recession. If the percentage output subsides back below 1% then the threat of a recession will have diminished.
LOOKING FORWARD TO THE FUTURE
The current state of the US stock market is precarious. Since Spring 2015, there has been significant movement downward in price momentum, indicating that stock indexes here in the US may have peaked in mid-2015 and are now looking to fall for an extended period. This adds weight to the argument that the US is perhaps close to entering a recession. The current multi-year stock market rally since early 2009 is one of the five longest rallies in the 130 year history of the Dow Jones Industrial Average (DJIA), and the other four rallies (1901, 1929, 2000, 2007) did not end well, yielding a minimum of 40% drop in the DJIA index.
Many US stocks are themselves in a bubble, and mathematically all price bubbles must fall at least 30% to 50%, if not more, before they fully deflate. It is likely that the deflation of these stock prices will bring down the US stock market to significant new lows in 2016 and perhaps 2017. In particular, Apple Inc. is one company that has seen a bubble grow in its stock price and has since seen a significant drop in price as the bubble has deflated. A review of the bubble in Apple Inc. was published in an article a year ago on February 8, 2015, just before the top in its stock price was recorded, "A TOP Formation In Apple Inc. - Crash Condition Signal Recorded". A link to the article can be found here.
At least two dozen US stocks have been identified and confirmed by the author as being in a bubble at this time, along with Apple Inc., and most likely there are quite a few others beyond this list. A future article will cover this topic in more detail.
The initial reading of 2015 Q4 US GDP was low, yet still positive. The second (February) and final (March) readings of Q4 GDP may drop further and eventually be recorded as negative, leading to the first of perhaps two negative quarters of GDP and the eventual onset of a US recession.
Finally, there is a belief that the US economy and US stock market can keep growing strongly for a few more years because the usual FOMC tightening of the federal funds rate has yet to fully complete. Another view is, it's possible that "this time it's different", and that the tightening may already have happened.
Specifically, the usual boom-bust cycle that we experience economically starts with a reduction in federal funds rate to induce growth followed by a tightening of the rate to slow growth, which inevitably has the effect of bringing on a US recession. This recent cycle has been different since the growth was induced primarily by three rounds of QE (and one round of Operation Twist), followed by tightening in the form of a gradual tapering of QE3. Hence, we may have already seen a full FOMC cycle of easing and tightening, however, it was managed in a different way using injection and removal of QE dollars rather than the reduction and subsequent increase of the federal funds rate. In this case, it is more likely that we will see QE4 before we see the federal funds rate reach the range 4% to 5% again, especially if a US recession is potentially on the horizon.
The massive crash in the price of oil has provided a supportive tailwind during the period of QE3 tapering and beyond, however, once oil reaches a bottom (which I calculate could be soon) and starts to rise in price, the influence that oil has on the economy will change from tailwind to headwind. Only those countries that reply almost entirely on the price of oil for national income will breathe a sigh of relief.
CONCLUSIONS
The St. Louis FED publishes a monthly report presenting the output from its US recession probabilities model. The latest report for February 2016 indicates that a US recession maybe on the horizon. A new US recession monitor has been developed by the author to convert the output of the St. Louis FED into two signals. The recession monitor is currently showing a "warning" signal.
The next two St. Louis FED reports for March and April are crucial because they will either supply conformation that a recession is on the horizon or they will reflect downward revisions to the data, removing the threat of a US recession shown initially in February.
In the event that an increase in percentage is sustained though to the April report, there is (in simple terms) a near 100% chance that a US recession will begin within two years or a 70% chance that a recession is imminent in the next few months.
Stock Markets both here in the US and abroad have fallen significantly since mid-2015. Many US stock are in a bubble and have fallen substantially in price, bringing down the key US stock market indexes. Small-cap stocks represented by the Russell 2000 index have suffered a substantial fall and are about to complete a major downwards moving pattern at the end of Q1 2016.
A simple rule for the start of a recession is two quarters of negative GDP, equaling half a year of contraction. The preliminary reading of Q4 US GDP is low, and so the final reading in March could end up being negative. This would be the first step towards two negative quarters.
The drop in oil price has somewhat masked the current economic issues, providing a tailwind from late 2014 to the present time. The low cost of oil together with the bear market in other commodities, means that cost of production has been cheaper than usual and the cost of transportation has been the lowest for some time. Once oil and other key commodities bottom and begin to rise, there will be added pressure on the cost of production and cost of transportation going forwards, leading to increased pressure on company earnings over time.
Disclosure: I/we have no positions in any stocks mentioned, and no plans to initiate any positions within the next 72 hours.
By Dr. David J. Harris
Disclosure: The author has no positions in any stocks mentioned, and no plans to initiate any positions within the next 72 hours.
David Harris is an independent stock market investor and trader with an interest in modeling price movements in stock markets. In particular, David has spent the last ten years developing mathematical models to identify market tops and market bottoms and more recently a model that identifies bubbles in national stock market indices and individual stocks. Trained originally as an Electronic Engineer, David has a First Class Honors Degree in Electronic and Electrical Engineering from Leeds University, UK and a PhD in Adaptive Control Algorithms, also from Leeds University. David has worked as a Senior IT Manager in the City of London and more recently in New York City for a variety of Investment Banks, including NatWest ...More Markets, Bankers Trust, Deutsche Bank, Bank of Bermuda and HSBC Bank.
© 2016 Copyright Dr. David J Harris - All Rights Reserved Disclaimer: The above is a matter of opinion provided for general information purposes only and is not intended as investment advice. Information and analysis above are derived from sources and utilising methods believed to be reliable, but we cannot accept responsibility for any losses you may incur as a result of this analysis. Individuals should consult with their personal financial advisors.
© 2005-2022 http://www.MarketOracle.co.uk - The Market Oracle is a FREE Daily Financial Markets Analysis & Forecasting online publication.