


A TOP Formation In Apple Inc. - Crash Condition Signal Recorded
Companies / Apple Feb 08, 2015 - 03:31 PM GMTBy: Submissions

 David Harris writes:
SUMMARY:
- In June 2014, a new market timing model recorded that a significant US market top was near and would be reached in the next few weeks or months.
- A new and more accurate market timing tool predicted in mid-2014 that the market top was likely to occur in either late July, October, early November or at year end.
- On Friday 26, December the DJIA recorded a new all time closing high as predicted by the tool.
- The same market timing tool shows that Apple has a single 7 week window of opportunity ending February 13, and so a significant top is about to be recorded for Apple Inc.
- A mathematical model has been developed by the author to predict and identify stock market bubbles and crashes.
- The identification model shows a current score of 100% for Apple Inc. indicating that the top of the bubble has been reached, and a crash condition is now in effect.
- The model predicts that all bubbles must deflate back to the point where the bubble started to grow, which will mean a drop of at least 20% to 30% in Apple Inc. over the coming months.
US STOCK MARKET TOP for DJIA
In June of 2014, a new market timing model signaled that a US stock market top was likely in the following weeks and months. The model is very accurate in terms of identifying market tops, however, it cannot pin-point the exact time that the stock market top will happen, only that it will happen soon.
A new and separate market timing tool, developed in mid-2014, has been used to determine a number of possible windows which might pin-point the timing for a significant stock market top. The following chart shows the four windows (red boxes) as they were calculated in the summer of 2014:-
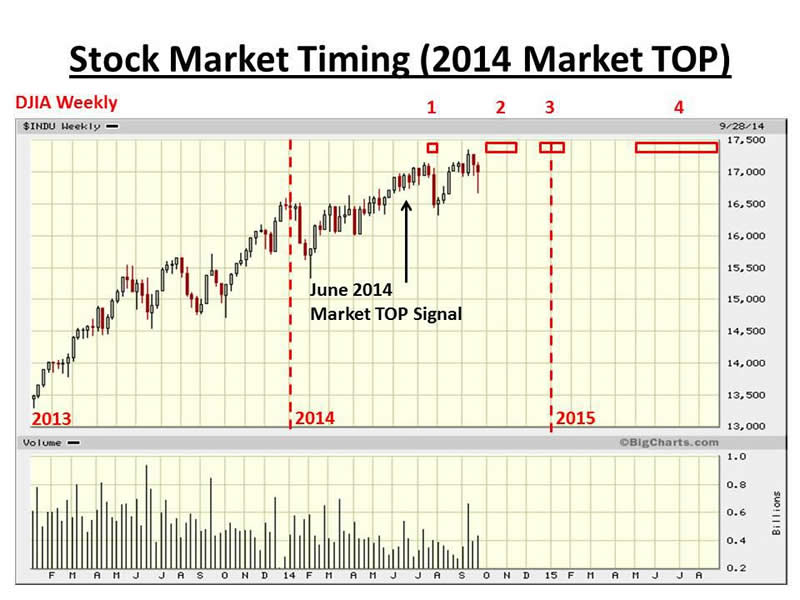
We now know that the 2 week window in July was too early. Also, the 7 week window covering four weeks of October and the first three weeks of November has been surpassed by the market high at the end of December. Hence, the next two windows of opportunity calculated by the market timing tool are:-
[1] A four week window from Monday December 22 to Friday January 16
[2] A multi-month window covering the spring and summer of 2015
As shown in the following chart, the DJIA did record a new market high on Friday 26, December, within window 3. The chart also shows that there was significant selling at key levels on the DJIA at 17,900, 18,000 and 18,100, leading to downward pressure on the index. Such strong downward pressure could make it difficult for the DJIA to attempt a further push above the December 26 high.
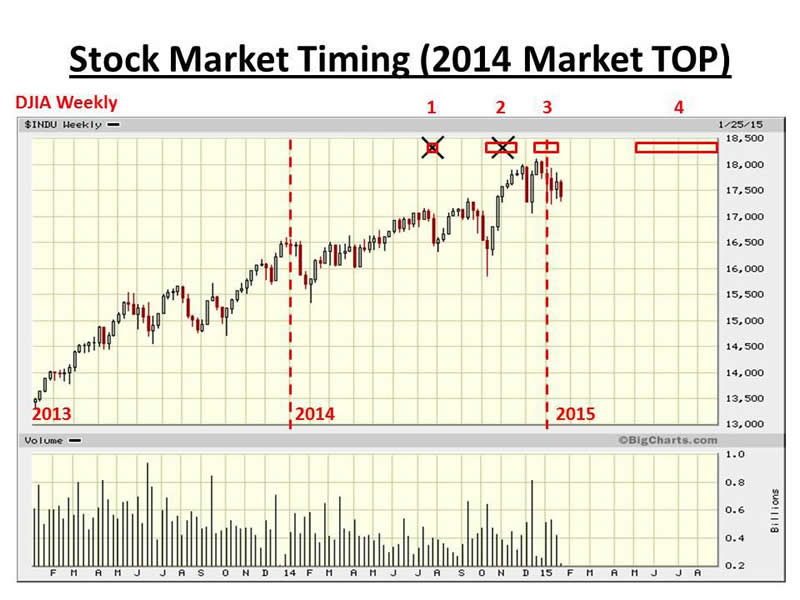
The fact that QE3 bond purchases by the FED finished at the end of October 2014 counted against the possibility of a year end rally into window 3. However, the steady drop in the price of oil (through the second half of 2014) provided a tail wind into year end, fuelling a small Santa Rally to the end of December.
ANALYSIS of APPLE STOCK PRICE
Various mathematical models are used to determine the future stock price of Apple Inc. All models have been developed independently by the author over the last ten years.
[A] Formation of a Bubble
A model has been developed by the author to predict, identify and classify stock market bubbles. The model works for national and international stock market indexes (such as DJIA and S&P 500) and also for individual stocks (such as Apple Inc.).
When the historic data is run through the model for Apple Inc., the model shows that Apple has formed a rare double peak bubble. In addition, the bubble has grown to an extremely oversized bubble classified as a 'Super bubble' which is an unusually large bubble, much greater than most bubbles that form in the stock market. The following chart shows a long-term view of Apple Inc. from 2002 to the present time. The recent double top formation is visible on the chart covering the last four months of the chart from November 2014 to February 2015.
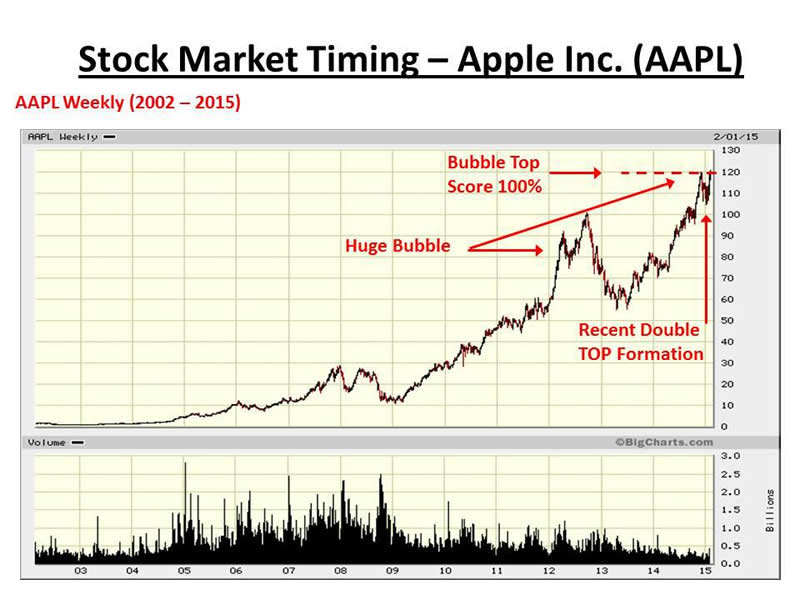
The model shows a current score of 100% for Apple Inc. indicating that the top of the bubble has been reached, and a crash condition is now in effect.
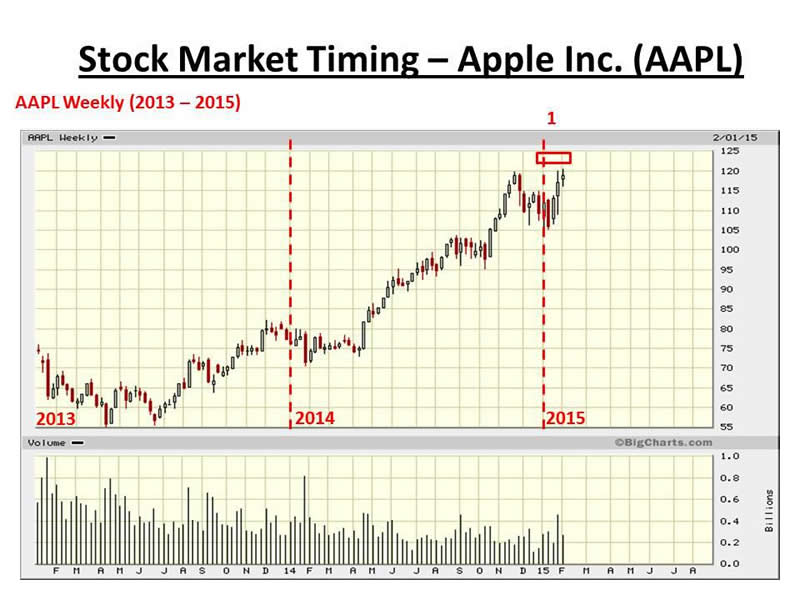
[B] Prediction of a TOP in Stock Price for Apple Inc.
This next section covers the results from the market timing tool which predicts the likely window of opportunity for a stock market top or top in stock price. The following chart shows that there exists a single 7 week window (red box) from Monday January 2 to Friday February 13 within which Apple Inc will most likely form a top in price. At the time of writing this means that either the top has just been recorded last week (February 2 to February 6) or the top will be recorded next week (February 9 to February 13). Once the window has closed the price will decline. The model predicts that a fall of between 20% and 30% is likely before the bubble fully deflates.
CONCLUSION
The prolific rise in the stock price of Apple Inc. has continued onwards for a considerable period of time. The over-stretched nature of the stock price has created a bubble which is inherently unstable and which will soon pop followed by a significant drop in price.
Disclosure: The author has no positions in any stocks mentioned, and no plans to initiate any positions within the next 72 hours.
By David Harris
David Harris is an independent stock market investor and trader with an interest in modeling price movements in stock markets. In particular, David has spent the last ten years developing mathematical models to identify market tops and market bottoms and more recently a model that identifies bubbles in national stock market indices and individual stocks. Trained originally as an Electronic Engineer, David has a First Class Honors Degree in Electronic and Electrical Engineering from Leeds University, UK and a PhD in Adaptive Control Algorithms, also from Leeds University. David has worked as a Senior IT Manager in the City of London and more recently in New York City for a variety of Investment Banks, including NatWest Markets, Bankers Trust, Deutsche Bank, Bank of Bermuda and HSBC Bank.
Copyright © 2015 David Harris - All Rights Reserved Disclaimer: The above is a matter of opinion provided for general information purposes only and is not intended as investment advice. Information and analysis above are derived from sources and utilising methods believed to be reliable, but we cannot accept responsibility for any losses you may incur as a result of this analysis. Individuals should consult with their personal financial advisors.
© 2005-2022 http://www.MarketOracle.co.uk - The Market Oracle is a FREE Daily Financial Markets Analysis & Forecasting online publication.