


S&P Stock Market Analysis & Forecast : Knockdown, Drag Out
Stock-Markets / US Stock Markets Mar 17, 2007 - 09:18 PM GMTBy: Dominick

“I also think the boxing gloves might come off and we'll be in for a real street fight at the first gap off the lows.”
If you read last week's update, then you should've been expecting the total bull vs. bear streetfight that broke out like a gang riot at Wednesday's lows.
But did you have the guts to pull the trigger?
There were two things I mentioned last week that should have had readers buying Wednesday's lows with no sweat. The first was the quote above, and the second was this:
“It's still possible to see new highs AND new lows from here. Did the magic number 1360 put in a bottom in the futures market or does the cash market need to be tested and decide?”
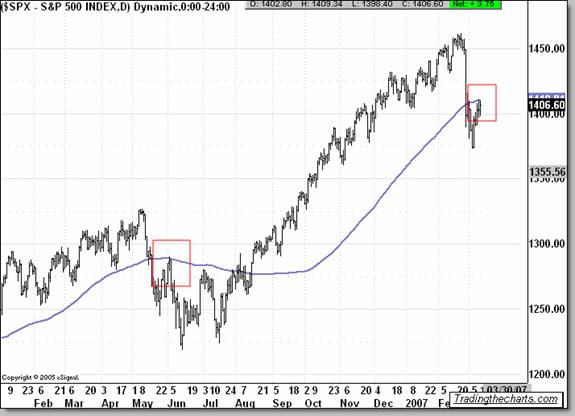
So, even if you weren't a member, last week's update gave you enough information to get in on Wednesday's trade. But everyone in the forums and the chatroom got a much clearer picture as the week progressed. For starters, since we didn't have any confirmation of either a low or a high being in place, we looked to the rally after the first drop in May as a roadmap, and found the correlation too sweet to pass up. As we waited to see what the market's true intentions were, the chart below was posted late Monday night with the caption, “ Lets clear it or short it. ”
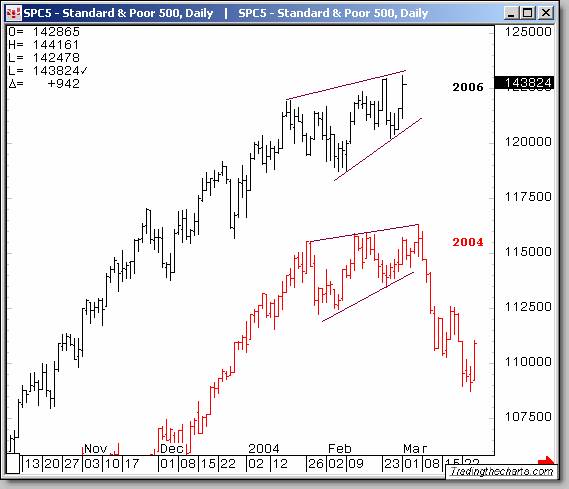
Sure enough, the market immediately rolled over and mapped out its path to the gap that I mentioned last week. The chart below was posted to the site on Jan 31, after having posted it several times in December also. The idea was that we were going to experience the same type of topping action as we had in 2004.
Tuesday night I put up the next chart continuing to show that the analog was working out perfectly and that we were about to make new lows, only to turn right back up.
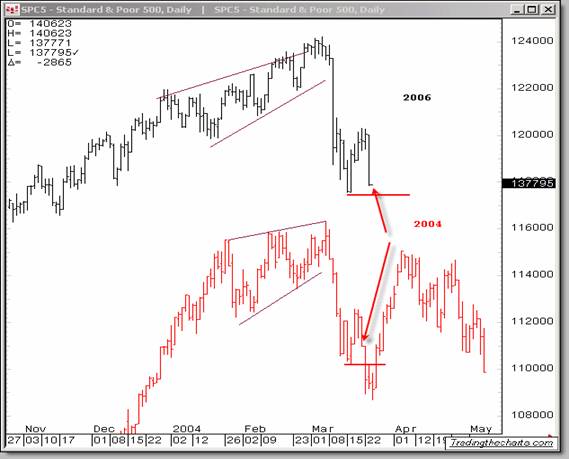
The results were not bad eh?
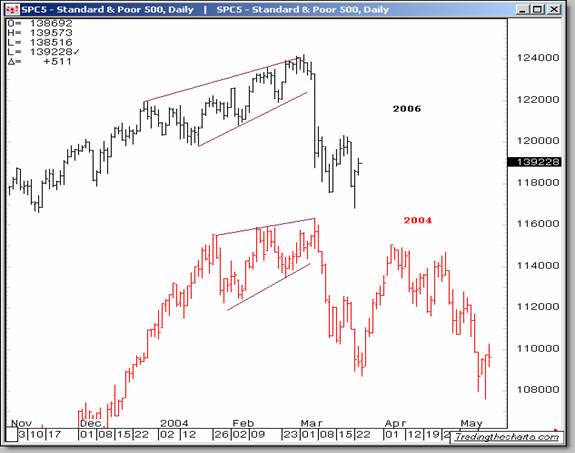
So far it's proven a successful reference, but more importantly, this chart put cash in our bank accounts. This update is not an intellectual exercise, and it's not theoretical analysis. It's a window into the way we actually trade day in and day out. But before you get too excited, let me clearly state that we would drop this 2004 comparison in a second if the market suggested otherwise, and the only way to find out in time to trade it is to be in the pit with us. In other words, don't expect a weekly update to do the work of the full membership service.
Throughout the week, we continued to post charts that proved our idea was correct. Below is another one with the now famous 1360 number. The chart also shows a measured move and an Andrews's fork. Last year, as we went through my 1360 target, I raised the ultimate target to allow for NYSE 9314 but said we'd be back to retest the area to decide the final outcome. After an overnight test in globex the week before, we finally came back down to test the 1360 area in the cash this week.
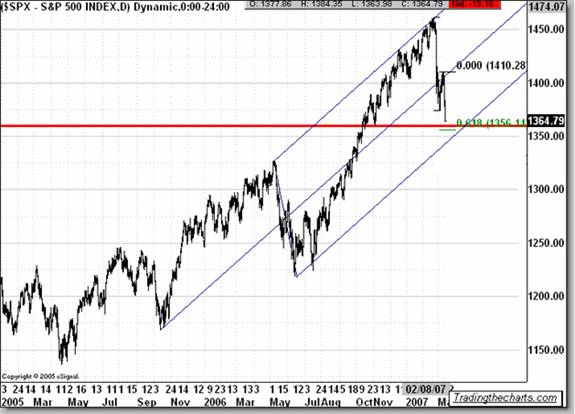
As many bearish traders sold into that low not knowing, or believing, the importance of it, the only thing we wanted to do is buy it. Simply, we bought our number! The S&P's screamed off that low in classic 1990's V-bottom style. Trades like that are exactly where we expect to shine, and we did. If you, too, bought that low, then job well done. But if you froze, or, even worse, went short, it might be time to practice the “Unbiased Elliott Wave” that is our specialty. Continuous guidance for setting up the move on Wednesday was given to members in our real time chatroom.
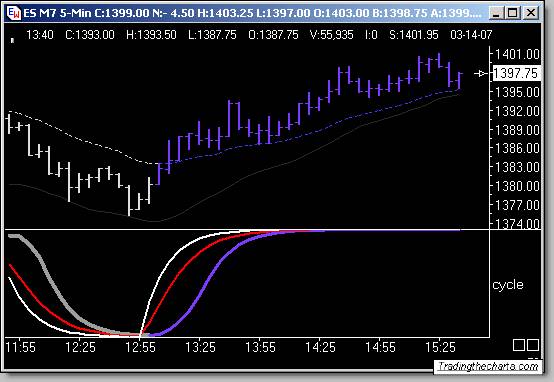
Once we were four points above the target originally mentioned a year ago, and getting there on a 100-point drop, we made sure my trend charts were going to confirm the trade before we put it on. Below is the 5-minute chart that turned up with force exactly where we needed to have the confidence for a trade. I'm sure some professional shorts knew what to do, but most bears got caught bringing knives to a gunfight, and we were there to pull the trigger. After that, the S&P's did what they should and took off, leaving behind a lot of stunned traders.
Just as foolish as it is to think it's a crash every time we selloff, I think it's just as bad for bulls to claim victory after just a few hours. Plus we had a 1400.50 target, and the sentiment started to smell over done already, so we went flat into Wednesday's closing bell. Thursday's idea was to sell 1405, which we did, and then saw globex give us our pay check overnight. Again on Friday we figured the morning buying for a B wave, and sure enough it fell into the perfect expected target of 1396 on the S&P futures.
What next?
Since the 50 point S&P drop, I have continued to say that labeling the big picture was the last priority on the list and we'd instead focus on catching the wide swings the market was throwing out on a regular basis. A successful week like this one is the result of that strategy. Knowing what the count is on the decade chart does nothing for me or our members at the moment, but cashing in 20-point chunks does. I said weeks ago that anyone that “knew” the pattern was guessing, and I still believe the same. I have started to map the Dow possibilities, which are reserved for members.
That said, it's starting to look like we're getting to the sweet spot where the big rewards will be. As of Friday we already have a chart that should guide us early next week and might pave the path for trading this market going forward for many months, if not the rest of the year.
Basically, we had a sharp move off the highs in February, then a bounce and a retest. That retest was on Wednesday and we're now moving toward a possible retest of that lower low and should get an explosive move from this area either way that I want you to ride . Over the weekend, members will have a recap of where we are and what the market is already saying to us, as well as levels for confirmation. For the fee of $50 per month, I'm sure you can't afford to miss what we offer. Join now
Remember that we might see some fake-outs on the way with the Fed meeting on Tuesday and Wednesday next week. The day before the meeting is typically a consolidation period, and could possibly be the consolidation before the big move. But I wouldn't advise you to assume anything before the statement because things will get very interesting if I'm correct about where we are in the pattern. Leave your bias behind or become a victim of the market.
Members
Once Friday's chart picks it direction, we can start to explore the next big direction of the market. I have already laid out the possibilities of what the Dow looks like using weekly to 15 minute charts. Many traders and analyst already have narrowed it down to one pattern. That is far from the truth and I believe that the 4 patterns you will see are all valid. Hopefully we can get rid of one or more by this week. Once we break to a wider range, we should only have two, or possibly one road map left to use.
Use the following link to view these charts as we wait for the market to tip its hand. Dow Map
Finally, be sure to read this week's Precious Points for Joe's take on the very volatile metals markets. Have a profitable and safe week trading, and don't forget:
“Unbiased Elliott Wave works!”
By Dominick
For real-time analysis, become a member for only $50
If you've enjoyed this article, signup for Market Updates , our monthly newsletter, and, for more immediate analysis and market reaction, view my work and the charts exchanged between our seasoned traders in TradingtheCharts forum . Continued success has inspired expansion of the “open access to non subscribers” forums, and our Market Advisory members and I have agreed to post our work in these forums periodically. Explore services from Wall Street's best, including Jim Curry, Tim Ords, Glen Neely, Richard Rhodes, Andre Gratian, Bob Carver, Eric Hadik, Chartsedge, Elliott today, Stock Barometer, Harry Boxer, Mike Paulenoff and others. Try them all, subscribe to the ones that suit your style, and accelerate your trading profits! These forums are on the top of the homepage at Trading the Charts. Market analysts are always welcome to contribute to the Forum or newsletter. Email me @ Dominick@tradingthecharts.com if you have any interest.
This update is provided as general information and is not an investment recommendation. TTC accepts no liability whatsoever for any losses resulting from action taken based on the contents of its charts, commentaries, or price data. Securities and commodities markets involve inherent risk and not all positions are suitable for each individual. Check with your licensed financial advisor or broker prior to taking any action.
© 2005-2022 http://www.MarketOracle.co.uk - The Market Oracle is a FREE Daily Financial Markets Analysis & Forecasting online publication.