


Stocks Commodities and FX Markets Waiting Technically While Fundamental Data Neutral Poised
Stock-Markets / Financial Markets 2016 Sep 28, 2016 - 12:41 PM GMTBy: John_Mesh

 The benchmark S&P 500 gyrated at open, showed indecision during the first 90 minutes of trading and then rose to its 0.70% intraday high in the early afternoon. It then traded in a narrow range and closed with a slightly trimmed gain of 0.64%, reclaiming a bit over half the pre-debate selloff following last week's "no rate hike" rally. The yield on the 10-year note closed at 1.56%, down three basis points from the previous close. Here is a snapshot of past five sessions in the S&P 500.
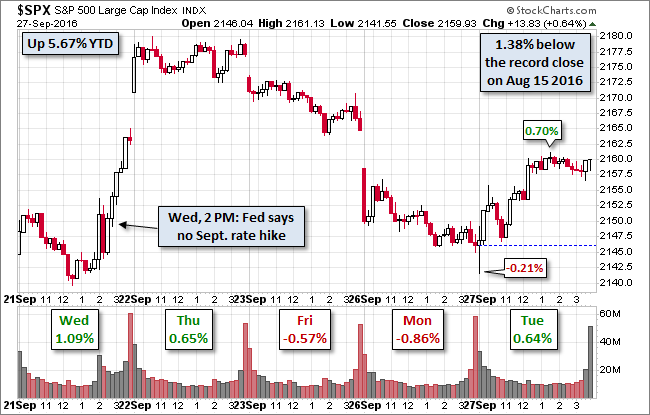
Narrow trading range as market waits presidential election debates.
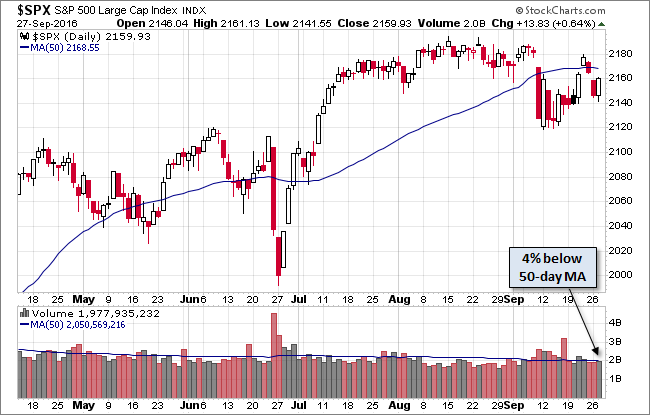
Here is daily chart of the index. Today's unremarkable trading volume suggests that the presidential debate mini-drama was a bit of a yawner.
Manufacturing soft in September
Manufacturing activity in the Fifth District continued to soften in September, but somewhat less so than in August, according to the Richmond Fed's latest survey. Overall manufacturing activity, as measured by the composite index, gained three points but continued to indicate some contraction, with a reading of −8 following last month’s reading of −11. Hiring activity at District manufacturing firms weakened in September. The manufacturing employment indicator lost 20 points to end at a reading of −7, while the average workweek index improved from a reading of −4 in August to 1 in September. The wage index lost eight points to end at a reading of 13 for the month.
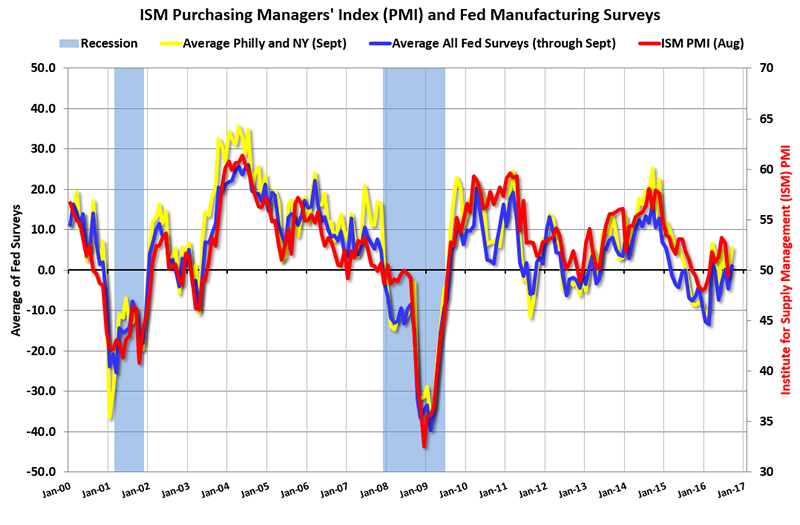
Here is a graph comparing the regional Fed surveys and the ISM manufacturing index. Fed Manufacturing Surveys and ISM PMI Click on graph for larger image. The New York and Philly Fed surveys are averaged together (yellow, through September), and five Fed surveys are averaged (blue, through September) including New York, Philly, Richmond, Dallas and Kansas City. The Institute for Supply Management (ISM) PMI (red) is through August (right axis).
Consumer Confidence : Strong rise in August/September
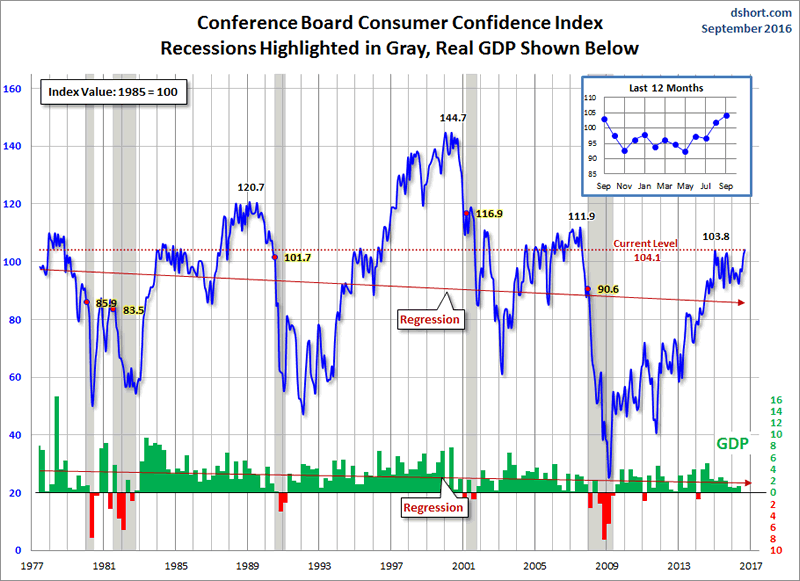
The latest Conference Board Consumer Confidence Index was released this morning based on data collected through September 15. The headline number of 104.1 was an increase from the final reading of 101.8 for August, an upward revision from 101.1. Today's number was substantially above the Investing.com consensus of 99.0. This is the highest since August 2007.
House Price YoY flat
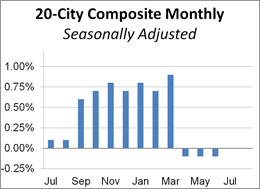
Seasonally adjusted home prices for the benchmark 20-city index were unchanged month over month The seasonally adjusted year-over-year change has hovered between 4.4% and 5.4% for the last twelve months.
Technical Charts
Copper: Multi month move shaping up
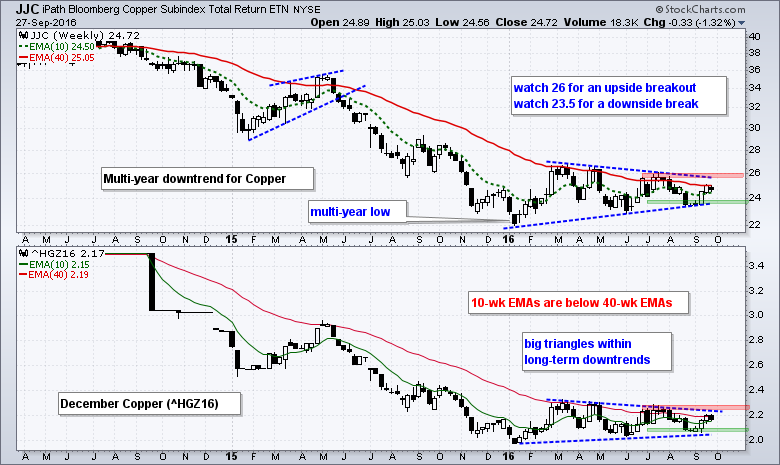
Copper is coiling inside a tight range and will break out in our view. China’s copper demand growth to slow to 0.8 percent in the second half, from 2.1 percent in the first half. It sees prices averaging US$4,700 a ton in Q4, up from around US$4,600 a ton currently, then falling to below US$4,500 in 2017 as mine supply grows. China is a net copper importer, but has been increasingly been producing refined material from imported concentrate. China’s improved copper demand has been reflected in a rise in premiums to US$50 last week from around four-year lows at US$45, and in the first drop in China’s bonded inventories since April, according to brokers. “We believe this reflects improving onshore demand in September, supported by both seasonal trends and a rebound in activity in southern China following flood-related disruptions in July,” Standard Chartered said in a report.
GOLD consolidates after a mini breakout this year
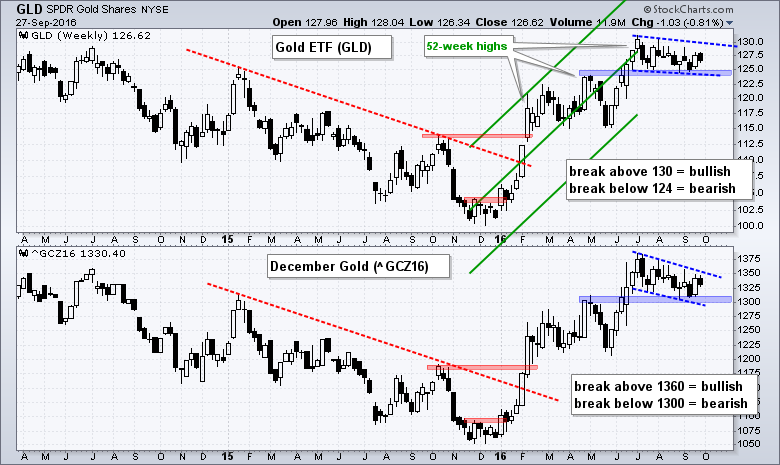
Gold is currently consolidating within an uptrend. Gold surged early in the year as the stock market plunged and then began to consolidate when the stock market bottomed in mid February. Gold got another surge in June and broke above its April high. This breakout is holding as gold consolidated with a falling channel/wedge (blue lines) over the last ten weeks. Overall, I view this channel/wedge as a corrective pattern within a bigger uptrend. This means an upside breakout is expected and such a move would signal a continuation of that trend. The broken resistance zone (blue) turns into the first support zone to watch. Failure to breakout and a close below this zone would be quite negative and call for a reassessment. At ChartCon, John Murphy noted a negative correlation between gold and the 10-year Treasury yield
Oil is forming a base: Will take longer to break
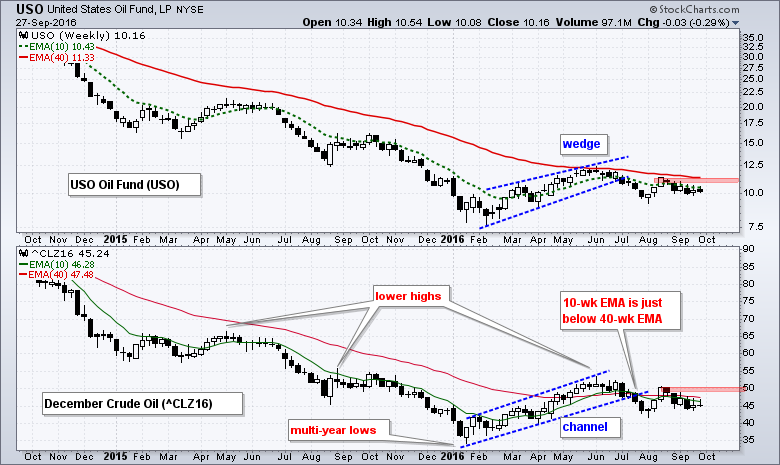
December Crude (^CLZ16), which is in the bottom window on the chart below, broke below 50 in August 2015 and is currently below 50 in September 2016.
Market: Transportatiokn breaking out

FEDex broke out with a gap. The volumes are impressive.
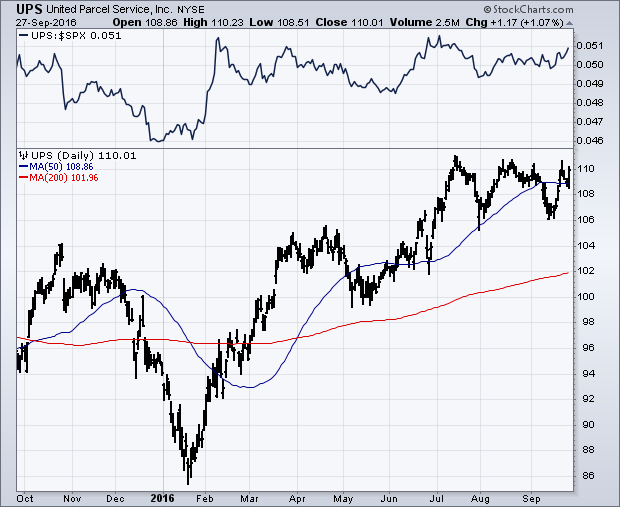
UPS is coiling at the top and could also follow FEDex.
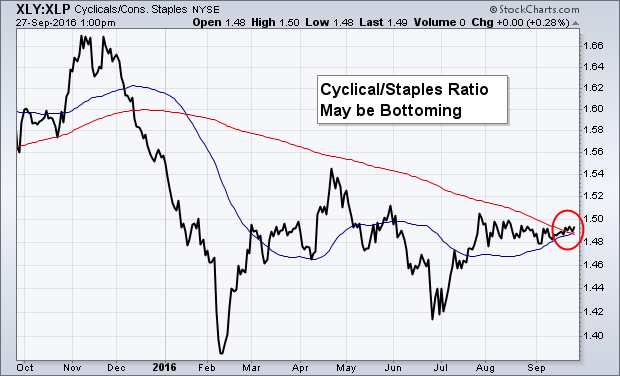
The direction of the ratio is generally indictive of the market risk appetive. This ratio could be turning higher. A break above April highs will mean market is ready to break higher on all major indices.
Final Summary
We believe given the market internals and volumes at the 50 MA suggest that markets are not in a panicky mode as US election approach. We like the euphoria surounding the transportation sector which is generally a good indicator of risk appetite. However tales from FX markets suggest severe caution.
JM is the partner at FXMesh. Over 15 years of trading, hedge fund and research experince background, he now provides investment advice and economic reasearch to clients around the world from his site http://fxmesh.com
He has worked at some of the most marquee names in trading and hedge fund industry. He invented the MESH Framework of trading. He will also like publish regular free articles at marketoracle for benefit of the readers.
Copyright 2016 Joy Mesh. All rights reserved.
Disclaimer: The above information is not intended as investment advice. Market timers can and do make mistakes. The above analysis is believed to be reliable, but we cannot be responsible for losses should they occur as a result of using this information. This article is intended for educational purposes only. Past performance is never a guarantee of future performance.
© 2005-2022 http://www.MarketOracle.co.uk - The Market Oracle is a FREE Daily Financial Markets Analysis & Forecasting online publication.