


Commodities the Return To Inflation?
Commodities / Commodities Trading Jan 07, 2018 - 06:23 PM GMTBy: WMA

 The headline in this Thursday’s Financial Times reads: “Commodities prices hit highest point since 2014”.
The FT article begins: “The Bloomberg Commodity Spot Index, which tracks price of 22 raw materials, has hit its highest level since 2014 when the oil market price crash started.”
A small problem might be that the Bloomberg Commodity Spot Index does not include Energy or Precious Metals, which are in other Bloomberg indexes. In fact, in the Bloomberg Commodity Spot Index is a grouping of Raw Industrials and Food Stuffs. The Raw Industrials includes burlap, copper scrap, cotton, hides, lead scrap, print cloth, rosin, rubber, steel scrap, tallow, tin, wool tops, and zinc. Foodstuffs include butter, cocoa beans, corn, cottonseed oil, hogs, lard, steers, sugar, and wheat.
The FT reference to the year 2014 was to the crash of Oil prices due to the collapse of the financial system, which in turn caused the entire basket of commodities to fall. The article’s clear inference, however, is not about commodity prices because media knows that people have a tough time referring to commodities unless it’s the fuel for their vehicles and homes or the food on their table.
Obviously, with typical emotion-hitting headlines, the Financial Times was poking at the public’s soft spot, inflation.
Now that Crude Oil prices have returned to the 60’s in the past month for both WTI and Brent, doubled from the 30’s and below in 1Q2016, the entire commodities narrative is changing. While the 2017 Energy rally was an alarming development in many quarters, particularly for wealth managers and traders who were short or missing the train, it seems that media has used it as an excuse to concern people that inflation is on the way.
Even the Federal Reserve Bank members and central bankers of several countries are now talking up inflation. We are sure this publicly-sensitive topic will be a prominent discussion at the next meeting of the G-20 finance ministers and central bankers – simply because it has more to do with their need to raise rates to normalized levels, so they can regain monetary policy control of the global financial system.
Given the G-20’s latest involvement with inflation, should we as wealth managers really be concerned about it, and if so what types of inflation should we be considering?
Are we talking producer prices or consumer prices for example? Are consumer prices the whole basket or just what is called the core basket, which excludes food and energy costs, deemed to be too volatile for sensitive eyes? Are we even talking consumer prices or people’s wages, which could be inflating more or less? And, in what country? Might we be considering America or Argentina or possibly Venezuela? There’s quite a range.
We’re sure most of us could agree that if commodity prices rise high enough for long enough there would be a reason for us to be having an inflation problem. Today, however, most of us would agree that, while inflation does exist, as it always does to some degree, there is no inflation problem, at least not in most of the advanced economies of the world.
There will be an inflation problem sometime in our future, we know, but for that there will be just one of two catalysts: (a) a major international war, or, (b) more likely, if only because of its inevitability, an overshoot by central banks in withdrawing liquidity from capital markets through excessive selling of over-priced securities to its member banks thereby sucking up money supply they say is too abundant. The latter problem i.e., over-doing policy implementation, we know, has been a repeat offense in cyclical terms. Then, when too little money chases the goods and services the world really needs -- and it’s not bitcoin -- ergo there is inflation – in one form and/or in one country or another.
There is so much we could discuss if the issue here was indeed inflation, so let’s do ourselves a favor and just stick to commodity prices, leaving the media to its usual practice of planting false flags.
Energy is the world’s most important commodity and unless and until crude oil is somehow replaced, the global economy absolutely needs increasing amounts of it. Without sufficient crude oil, economies shrivel, and capital markets collapse. That is a fact. What is arguable is that, at crude oil prices that have been too low for too long, the oil and gas industry is financially unsustainable. Insufficient prices have not permitted sufficient capital expenditures to replace known reserves as they have been depleting in normal use as the global economy has been growing at rates of +2% to more than +3% on an annual basis.
From the Summer of 2016, after the subject became a contentious one, we argued that sustainable economics of the Oil & Gas industry required the prices of West Texas Intermediate and Brent to rise from about $45/bbl (WTI) at the time to $65/bbl. However, skeptics then threw every possible argument against us such as alternative energy, shale oil technology, electric vehicles, and the like. We argued simply that, while all of that contained much truth, in the real world the conventional Oil & Gas industry was the 800-pound gorilla in terms of our energy supply.
To us, these negative arguments were like a 1-hour bar chart overlaid on the more important 1-year chart. In terms of wave theory, they were focused on ripples instead of the tide. They were never going to look forward a quarter or a year, but were in fact using personal agenda-supporting arguments that extended the time horizon 5 to 10 years past what is important to us as wealth managers.
Through production agreements among the majority of Oil & Gas producing nations, the market is finally approaching normalization, i.e., back to $65 sustainable Oil economics. With a few dips and turns, we’ll have it. Long-term demand and supply is being rebalanced, which brings us to the most important point about commodities, demand-supply economics will endure while the actions of financial market players, when extreme, will sooner or later produce unintended consequences.
As wealth managers, unless our names are Vanguard, Goldman and the like, our time and resources for study are limited. We need to use some helpful analytical tools and then we need to think, to apply our skills, knowledge, and experience.
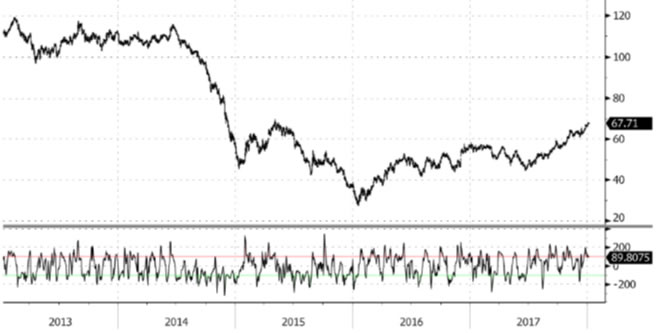
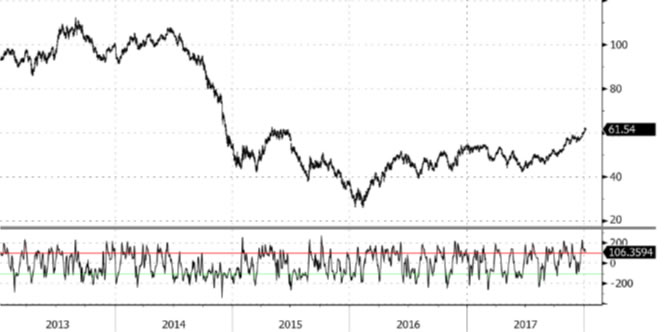
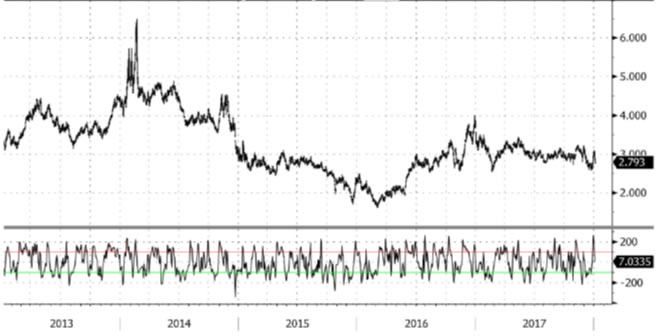
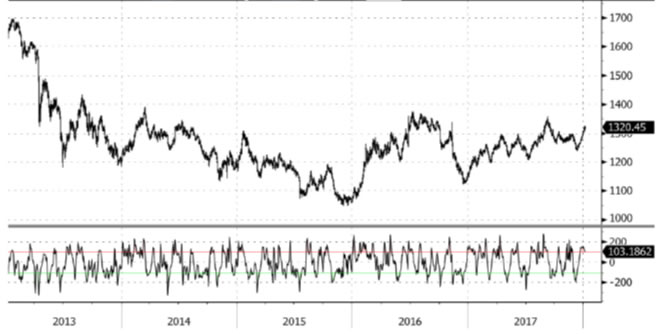
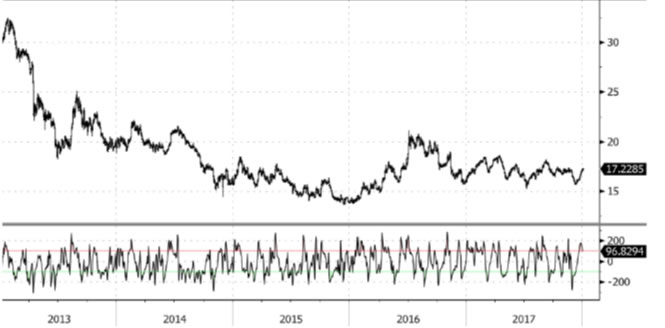
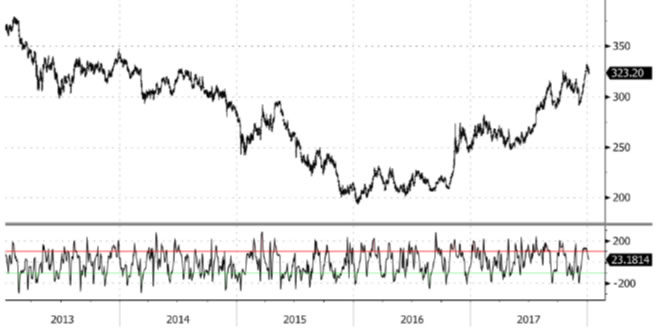
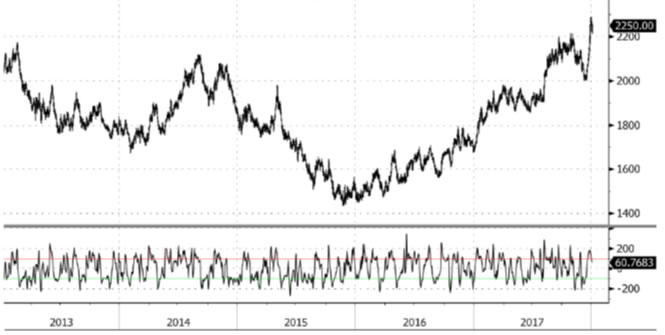
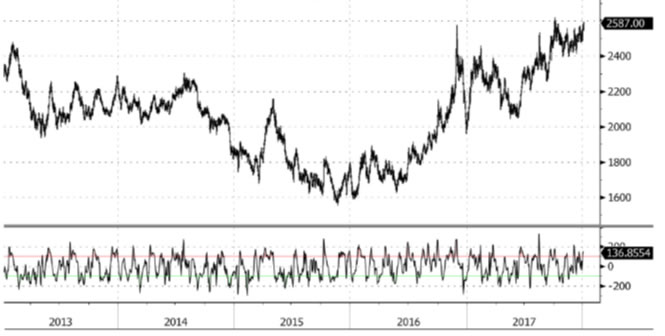
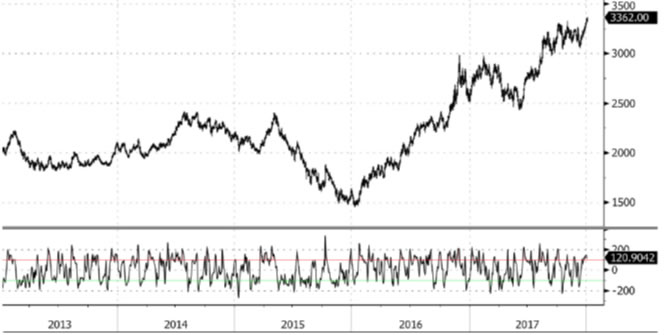
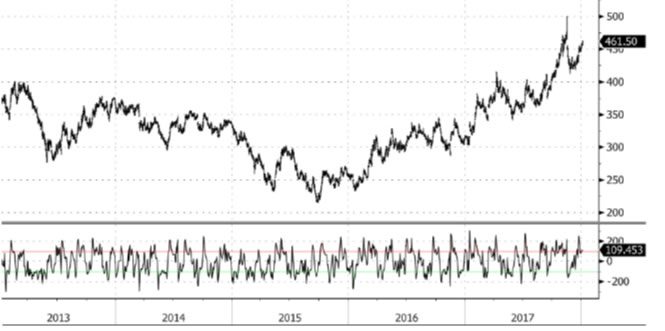
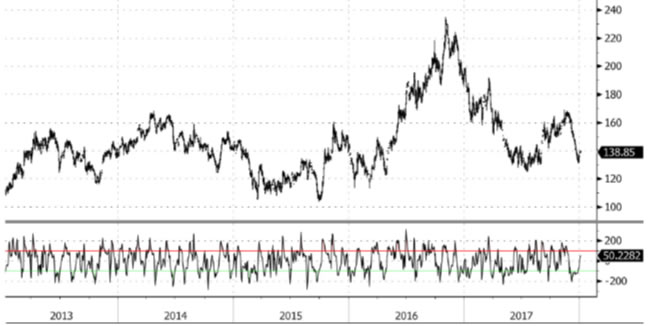
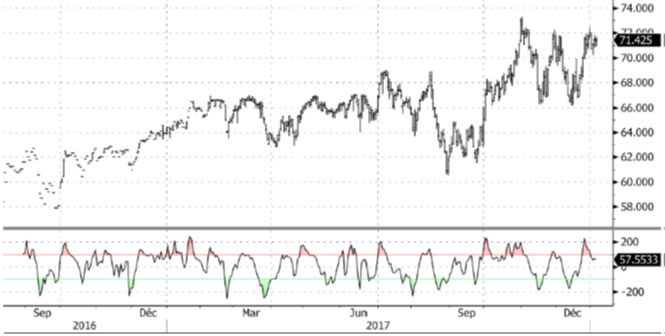
Given such practical constraints, when it comes to decision-making with regard to prices of commodities and derivative instruments, we find that one particular investigative tool is helpful. The Commodity Channel Index is a measure of the variation of a commodity price from its statistical mean/statistical average. This fits within our understanding that market prices rise and fall in trends and cycles, always reverting to the mean.
The CCI technical indicator available to all of us is a price oscillator that oscillates between high levels and low levels, always seeking what would be a normal level based on long-term supply-demand economics.
|
Commodity |
Month |
Recent |
Energy |
Brent Oil |
18.mars |
67.80 |
|
Carbon Emissions |
18.mars |
7.75 |
|
Crude Oil WTI |
18.févr |
61.61 |
|
Gasoline RBOB |
18.févr |
1.80 |
|
Heating Oil |
18.févr |
2.07 |
|
London Gas Oil |
18.janv |
607.50 |
|
Natural Gas |
18.févr |
2.79 |
Softs |
Lumber |
18.janv |
455.50 |
|
Orange Juice |
18.mars |
138.50 |
|
US Cocoa |
18.mars |
1896.50 |
|
US Coffee C |
18.mars |
129.17 |
|
US Cotton #2 |
18.mars |
78.67 |
|
US Sugar #11 |
18.mars |
15.23 |
Meats |
Feeder Cattle |
18.janv |
147.57 |
|
Lean Hogs |
18.févr |
71.05 |
|
Live Cattle |
18.févr |
120.80 |
Metals |
Aluminum |
|
2213.75 |
|
Copper |
18.mars |
3.23 |
|
Copper |
|
7123.75 |
|
Gold |
18.févr |
1318.30 |
|
Lead |
|
2579.25 |
|
Nickel |
|
12497.50 |
|
Palladium |
18.mars |
1086.30 |
|
Platinum |
18.avr |
969.40 |
|
Silver |
18.mars |
17.20 |
|
Tin |
|
19900.00 |
|
Zinc |
|
3366.50 |
Brent
West Texas
Natural Gas
Gold
Silver
Copper
Aluminium
Lead
Zinc
Lumber
Orange Juice
Lean Hogs
Live Cattle
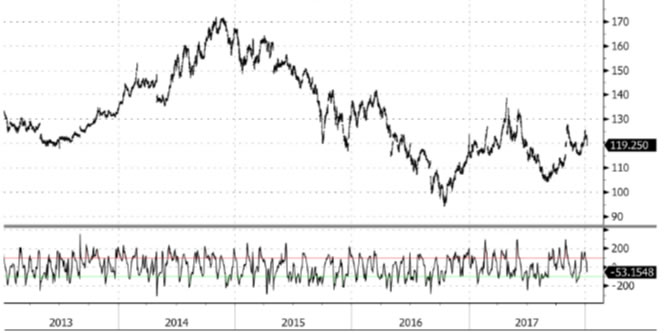
Technically speaking, if CCI is above +100; then overbought conditions are indicated. IF above +200; an impending market correction i.e., reversion to the mean, is indicated, which is usually a good time to sell, particularly as the CCI falls closer to +100.
Similarly, if CCI is below -100; then oversold conditions are indicated. When below -200; an impending market correction i.e., reversion to the mean, is also indicated, which is usually a good time to buy, particularly as the CCI rises closer to -100.
In practice, for our Natural Resources Fund portfolio, we study CCI commonality over multiple time frames such as Monthly, Weekly and Daily data series to give us an overview perspective of market conditions. When we get to a high-priced market (i.e., sellers’ market) or a low-priced market (i.e., buyers’ market), we run a proprietary but simple algorithm (CCI, RSI and some other indicators) on intra-daily data series of our invested positions plus watchlist instruments.
Presently, these charts are indicative that Energy and Metals are high-priced for their Monthly, Weekly and Daily data series. We call this the Distribution Zone, a time for selling. Back on September 1, 2017, when we started the Natural Resources Fund portfolio, we happened to be in the Accumulation Zone, a time for buying, first for Oil&Gas and then for Metals.
Initially we favored Oil over Gas and Copper. Then we favored Silver over Gold. These are the commodities and their derivative instruments (i.e., in our case the equities) we accumulated in September. In late December we were taking profits as CCI was indicating over-bought price levels.
We noted all our trades in the Natural Resources Fund portfolio monthly report: for the Oilers, our profits came from Callon (CPE +28.3%), Carrizo (CRZO +41.0%), Devon (DVN +30.7%), Gulfport (GPOR +0.1%), Helmerich & Payne (HP +48.3%), Murphy (MUR +25.2%), Newfield Expl. (NFX +19.1%), Pioneer (PXD +20.7%), and Sanchez (SN +9.3%). We also closed our position in HudBay Minerals (HBM +19.0%). We sold full positions in all but GPOR, where we sold a 40% position because of nat gas seasonality and the extreme cold in the northern States and Canada over the holiday period. We earlier had bought into weakness, then sold into strength, while taking no losses, so clearly the CCI technical indicator has been a useful tool in our toolbox.
At the end of the day, there are two factors we find important in trading commodity-based equities: (i) corporate fundamental strength of the underlying instrument, and (ii) technical timing of the underlying commodity price.
Wealth managers, including self-managed traders, are advised to use this encompassing approach when commodities-related equities are involved. Moreover, it pays to ignore the narrative pushed by mainstream media who have a raison-d’être quite different than ourselves.
By Williams Market Analytics
http://www.williamsmarketanalytics.com
We provide insightful market analysis and account management founded upon our very successful systematic, disciplined approach to investing. Our investment analysis revolves around two inputs: company valuation and our quantitative, market-based indicators. Learn more about our approach and our strategist.
© 2018 Copyright Williams Market Analytics - All Rights Reserved
Disclaimer: The above is a matter of opinion provided for general information purposes only and is not intended as investment advice. Information and analysis above are derived from sources and utilising methods believed to be reliable, but we cannot accept responsibility for any losses you may incur as a result of this analysis. Individuals should consult with their personal financial advisors.
© 2005-2022 http://www.MarketOracle.co.uk - The Market Oracle is a FREE Daily Financial Markets Analysis & Forecasting online publication.