Stock Markets Comparison Against the 1930's Depression
Stock-Markets / US Stock Markets Sep 16, 2008 - 01:14 PM GMTBy: Captain_Hook

 Analog Comparisons - The term analog is rooted in the word analogy , which for our purposes is being used with reference to an analog signal measuring a variable signal that is continuous (similar) in amplitude and time. In terms of analyzing the financial markets, and how price movements have a tendency to repeat in terms of pattern (amplitude) and time, it is this understanding that was the primary precept in the work of W. D. Gann , which to this day remains THE comprehensive / definitive template to unlocking the mystery of how markets work. The primary understanding then, is that price movements in markets have a tendency to repeat in pattern and time.
As mentioned the other day, they are not alone in this regard either, that being accelerating currency debasement policy. As a matter of fact, and contrary to claims by Goldman Sachs asserting the reason the dollar ($) will rally next year is because credit markets will be improving, the bailouts abroad are accelerating to the point money supply growth rates in the Eurozone are now outstripping those in the States as ‘the race to zero' ratchets up a notch or five. This is why the $ is in rally mode, and also why gold should not suffer as much as bearish speculators think at present. You see they are all looking over the deflation cliff, but what they fail to realize is that authorities still have the hyperinflation card to play.
Some of you may be thinking the above ideas are ‘fine and dandy', but with the reservation some empirical evidence to support this hypothesis would be better. And we could not agree more. So, we intend to do just that for you now, where the idea is to provide you with enough empirical evidence to make one feel comfortable about holding precious metals investments in coming weeks and months in spite of the fact deteriorating liquidity conditions and investor panic could erode prices considerably from current levels under the right conditions. What kind of conditions are we talking about? How about a good old fashioned panic, something we have not seen in quite some time as investors were lulled to sleep in this regard long ago with the protection of hedging related derivatives. Too bad these markets don't work when the chips are down however, no?
Anywho – and to the chase now, you may remember our article entitled The Need For Speed from earlier this year, where we first hinted at a contracting credit cycle , and that monetary debasement rates will need to accelerate at some point in the not too distance future in order to keep the USS Titanic afloat. Fast forward to today and here we are in exactly that situation, where monetary authorities are now debasing the currency at just shy of a 20-percent clip , and rising, in an ongoing effort to extend the larger credit cycle. And as alluded to above, there are numerous ways one can measure success in this regard, from currencies to asset bubbles, where to kick things off in terms of our examination of such variables, a look at the Swiss Franc is likely as good a place to start as any. Not talked about as often as it could be, as it stands today, the basic trading modus operandi behind movements in the Swissie is a function of perceptual pressure in the global economy's pipe, where the mere hint of deflationary forces coming down the pike can cause it to back off in short order, as it's doing right now. (See Figure 1)
Figure 1

And in looking above it's not difficult to see that in fact technical conditions appear stretched to the upside and at a minimum in need of consolidation, which appears to be exactly what is happening, we hope. Because if this is not the case, where the count indicated is correct, then this could be a far more profound end to the rally in the Swissie (and possibly the larger credit cycle), at least on the basis of a more healthy global growth metric. Here, and as you can also see above, we are placing both gold and commodities ($CCI) in the same camp as the Franc considering the extremely tight correlation between the three, where again, reversals here would indicate the larger credit cycle is failing, and that present day currency mechanisms are beginning to reflect this condition in deflating asset prices.
So, the question then arises (and many an informed observer is asking this exact question right now), ‘is this the way it is – deflation right now – or is there more inflation yet to come?' Answer: We know from our discussion above concerning official efforts to keep the money supply growing (which is happening by the way – but it's the pace that needs to keep accelerating), that as long as monetary authorities have blood coursing through their veins, they will inflate or die. And in fact if history is a good guide, they should be successful at least one more time, perhaps as MZM growth rates search for the highs seen back in the mid 80's, discussed in our opening. Of course you may remember prior to this we had a little problem in the stock market in the early 80's that prompted such a response, with the big question here today being, ‘do we repeat in this respect as the final justification in going to light-speed in monetary debasement rates?'
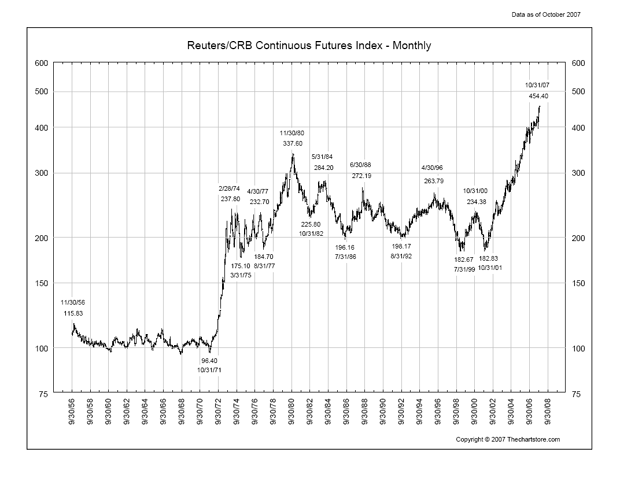
This is a distinct possibility in my books, that being a short but sweet stock market scare, where as with the echo-bubble top back in 1937, the market peeled off 50-percent of it's gains in approximately six-months. (See Figure 1 ) What's different about today is it's not likely World War III will come along formally to create the conditions (death and destruction) for another growth sequence like the one that's ending now, but without a doubt some like George Bush and friends will try. Of course the absence of a formal world war will not stop monetary authorities from accelerating currency debasement rates either, not with all the $50,000 hammers and $50 million war-planes to pay for these days. So you see we don't need a world war to spend this money. What we do need however is at least a few more years added to this commodity cycle if it is to match the 70's experience, which as you can see below lasted approximately nine-years as opposed to the seven we have seen thus far in the current commodities bull market. (See Figure 2)
Figure 2
Source: The Chart Store
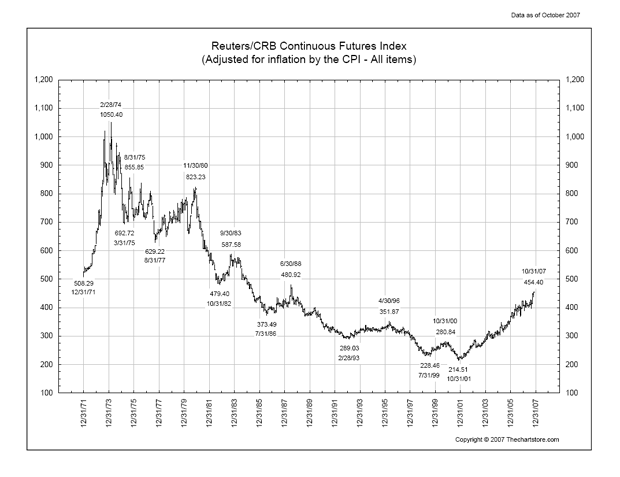
What's more, in terms of the current commodities bull market it should also be noted that along with the time element being deficient on a comparative basis to previous cycles, prices would also be deficient in just reflecting past inflation if they stopped here as well, never mind the future. This can be seen below on a CRB plot adjusted by the Consumer Price Index (CPI), which of course is deficient in its own right in terms of reflecting actual inflation / price increases over the past 30 to 40 years with official rates far removed from reality. That understood – it's interesting to note we're not even at the halfway point in terms of official price; and that if history is a good guide the next few years should see some quick catch-up in this respect. (See Figure 3)
Figure 3
Source: The Chart Store
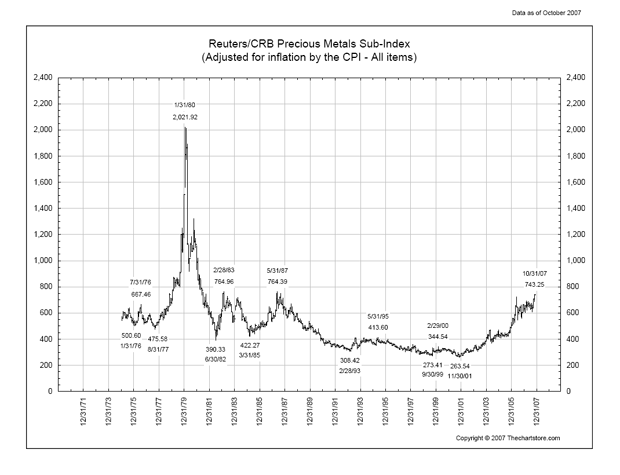
So why are precious metals doing a terrible job of discounting such an outcome? This is a valid question considering for example the Gold / Crude Oil Ratio is much closer to historic lows than highs. In this respect it had better get going if it's to signal higher prices down the road. And we expect this occur in coming days, even if nominal prices fade in coming months. As Einstein would say, ‘it's in the relativity you know.' So don't be fooled by falling nominal prices in coming days, it's the relativity that's projecting future outcomes, where as long as gold is outperforming commodities, higher prices should ultimately be anticipated down the road. Thus, after a brief respite which could last as long as spring of next year possibly taking the Reuters/CRB Precious Metals Index (and gold) lower, I would also expect to see prices take off here first in discounting a return to pricing power as another wave of accelerating inflation takes hold. (See Figure 4)
Figure 4
Source: The Chart Store
And while some will see this as an election ploy, in actuality efforts to revive the economy should be seen on a higher level, where future attempts in this regard might not be so successful as Super-Cycle Degree forces continue to conspire in shaping conditions for Grand scale change. That is to say eventually considerations such as availability of increasingly scare resources (pertaining more to developing countries) and demographics (pertaining more to developed countries) are forecast to limit population growth, meaning the demand for increasing currency will wane both naturally and beyond the ability of bankers to circumvent via increasingly complex derivative schemes. In a nutshell, and unlike Einstein, they will simply be unable to split fiat currencies (derivatives) any further or manufacture sufficient new takers. Largely, this would be the reverse of both the ‘oil age' and the US Dollar ($) empire fostered in carbon based technology.
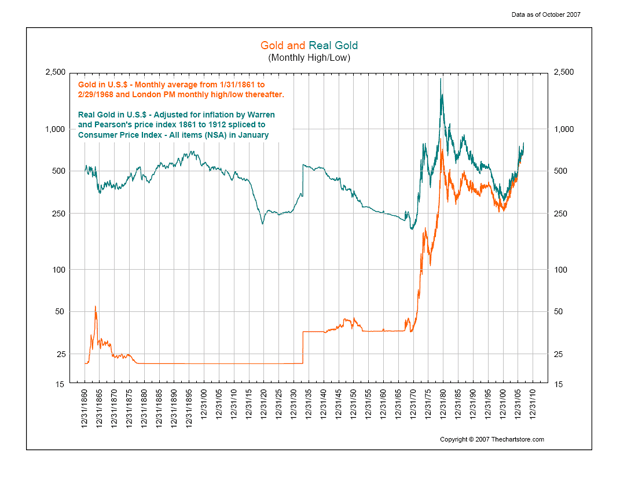
Again however, these are considerations for the future, and views that are subject to change in measuring man's ingenuity. That said, and in returning to the focus of today's study, along with measuring the impact of past monetary policy on present and future commodity pricing, as purported above such realizations should first be witnessed in precious metals prices, gold first, followed by silver. What's more, and contrary to the view a period of price weakness lies directly ahead signaled in ratio reversals across the equity complex discussed in our last meeting , it should be pointed out that if nominal precious metals pricing is to catch up to inflation adjusted values, this process should accelerate forthwith, not hesitate, which is the view most investors have today with all the deflationary forces coming down on the system at present. (See Figure 5)
Figure 5
Source: The Chart Store
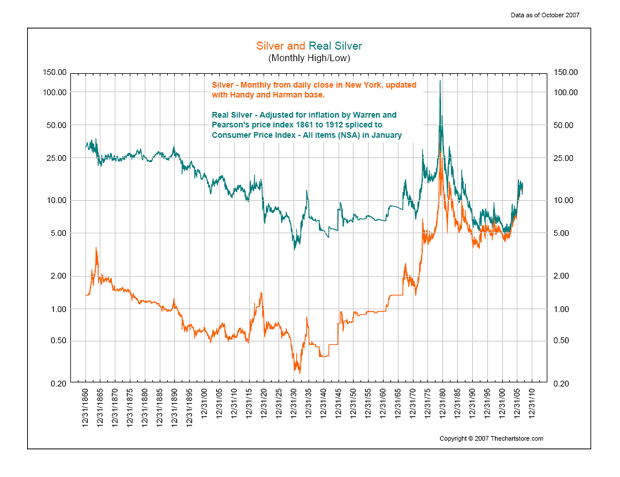
As can be seen above for gold and below for silver, as inflation works its way into the larger system in official measure precious metals prices respond by rising, but that even back at the top of the 1980 cycle nominal pricing failed to capture real values, which is a condition still with us today. Of course it's always been this way, as it's the inflation that leads prices higher, even if official pricing measures (CPI) are flawed. That being known, at some point you would think the market should reflect even these flawed numbers, where again, in order to do so in terms of 1980 $'s, the nominal price would need rise to almost $2500, and silver $150. (See Figure 6)
Figure 6
Source: The Chart Store
So, the question arises ‘what's holding this whole process back if monetary growth rates are accelerating higher , which of course is the definition of inflation ?' Well, for one thing officialdom attempts to have you believe their lying about actual price increase rates, as measured by CPI, is in everybody's best interest. (i.e. this is of course better for the bureaucracy than the public.) Corresponding then they feel justified in publishing bogus pricing data , which in turn apparently keeps a lid on inflation expectations as institutional managers play the game. This is the way it's been for some time now, living in our ‘Goldilocks economy', but could it be that an outside factor like ‘peak oil' comes along to prick our collective (monetary) bubble? Would crude oil at $200 finally create enough panic in the financial system to break precious metals free of paper pricing related constraints ?
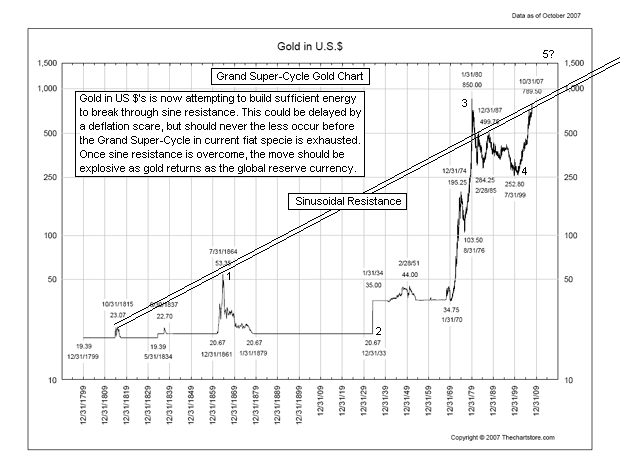
Without a doubt, and for one thing, it wouldn't hurt to finally see the Gold / Crude Oil Ratio attached above move higher on a sustained basis, perhaps returning to historic highs after plumbing new lows recently. But if not this – what? You know what? It's not important to know what factor(s) are going to prick our current monetary bubble. What is important to know however is it's going to happen, and that it will likely occur in conjunction with a period of extremes in pricing such that the public finally awakes from slumber to realize ‘the system' was not created to serve their needs, but to reward the ambitious and corrupt. This is when gold pricing will break away from management attempts to keep it ‘just right' as per the ‘Goldilocks economy'. That's when it will finally break above Grand Super-Cycle Degree sine resistance seen below. (See Figure 7)
Figure 7
Source: The Chart Store
Unfortunately we cannot carry on past this point, as the remainder of this analysis is reserved for our subscribers. However, if the above is an indication of the type of analysis you are looking for, we invite you to visit our newly improved web site and discover more about how our service can help you in not only this regard, but on higher level aid you in achieving your financial goals. For your information, our newly reconstructed site includes such improvements as automated subscriptions, improvements to trend identifying / professionally annotated charts , to the more detailed quote pages exclusively designed for independent investors who like to stay on top of things. Here, in addition to improving our advisory service, our aim is to also provide a resource center, one where you have access to well presented ‘key' information concerning the markets we cover.
On top of this, and in relation to identifying value based opportunities in the energy, base metals, and precious metals sectors, all of which should benefit handsomely as increasing numbers of investors recognize their present investments are not keeping pace with actual inflation, we are currently covering 68 stocks (and growing) within our portfolios . This is yet another good reason to drop by and check us out.
And if you have any questions, comments, or criticisms regarding the above, please feel free to drop us a line . We very much enjoy hearing from you on these matters.
Merry Christmas all, and Happy New Year.
By Captain Hook
http://www.treasurechestsinfo.com/
Treasure Chests is a market timing service specializing in value-based position trading in the precious metals and equity markets with an orientation geared to identifying intermediate-term swing trading opportunities. Specific opportunities are identified utilizing a combination of fundamental, technical, and inter-market analysis. This style of investing has proven very successful for wealthy and sophisticated investors, as it reduces risk and enhances returns when the methodology is applied effectively. Those interested in discovering more about how the strategies described above can enhance your wealth should visit our web site at Treasure Chests
Disclaimer: The above is a matter of opinion and is not intended as investment advice. Information and analysis above are derived from sources and utilizing methods believed reliable, but we cannot accept responsibility for any trading losses you may incur as a result of this analysis. Comments within the text should not be construed as specific recommendations to buy or sell securities. Individuals should consult with their broker and personal financial advisors before engaging in any trading activities, as we are not registered brokers or advisors. Certain statements included herein may constitute "forward-looking statements" with the meaning of certain securities legislative measures. Such forward-looking statements involve known and unknown risks, uncertainties and other factors that may cause the actual results, performance or achievements of the above mentioned companies, and / or industry results, to be materially different from any future results, performance or achievements expressed or implied by such forward-looking statements. Do your own due diligence.
Copyright © 2007 treasurechests.info Inc. All rights reserved.
Unless otherwise indicated, all materials on these pages are copyrighted by treasurechests.info Inc. No part of these pages, either text or image may be used for any purpose other than personal use. Therefore, reproduction, modification, storage in a retrieval system or retransmission, in any form or by any means, electronic, mechanical or otherwise, for reasons other than personal use, is strictly prohibited without prior written permission.
Captain Hook Archive |
Credit Collapse Domino Effect to Send Stocks Lower
 There's no reason to be short the stock market from a seasonal perspective anymore. And with all the giveaways these days, along with apparent ample money supply, again, if contemplating participation in the stock market, without a doubt the ‘rational man' would be compelled to be long given it appears authorities have the subprime mess under control – right? Correspondingly then, both short and put / call ratios should be falling, and in fact this is exactly what is happening as market participants get squeezed in a traditional Santa Claus rally. From a sentiment related perspective this is a bearish set-up along the lines of Dave's thoughts on the subject – The Grinch That Stole Christmas .
The following is an excerpt from commentary that originally appeared at Treasure Chests for the benefit of subscribers on.
So, in knowing this the question then arises, ‘does this mean 2008 could turn out to be a surprisingly bad year in both the stock market and economy, which unfortunately for us in giving banks and brokers so much power in our lives these days, are inextricably linked?' Of course market observers would point out the from a Decennial Pattern perspective years ending in an 8 have a tendency to be quite robust, but to them a reminder of Long-Term Capital Management (LTCM) and 1998 appears appropriate then, and that prior to this every year with a LTCM type event ending with a low in November was followed by a lower low the following year. Thus, since the subprime mess qualifies as LTCM event to the 'nth' degree, one should be expecting lower lows in stocks next spring if history is a good guide.
What's more, and as Alex Wallenwein skillfully points out in his latest, what the media is dubbing a ‘credit crunch' is actually a credit collapse , a reality that is now showing up not only in consumer credit stats, but commercial paper is also beginning to contract as well. And this is happening right into a period of seasonal strength for the economy. Does it end there? Heck no – one domino falling will lead to another (the domino effect ), where all forms of credit (debt) will in turn be affected by this collapse, from credit card debt to AAA mortgages before it's all over, right down (or up) the line as it may be. And of course the risks associated with all this becoming a problem they can't fix is also multiplied in the realization that lenders of all varieties (both foreign and domestic) will be far less willing to take on more US debt (both private and public) knowing the cake eaters in Washington think they can rewrite contracts to their own benefit after the fact. Do you think this might create an instance of unintended consequences, where price managers finally make the big blunder and get both stocks and bonds falling at the same time? (i.e. and for the same reason that even a first year economics student could understand?)
But won't all the steps being implemented by authorities prevent this from happening? While some think these measures will at least stall a severe downturn in the economy due to credit collapse, libor rates are telling a different story, where if they don't improve on this side of the pond after Tuesday's Fed meeting, things could get uglier faster in a race to zero in the bond market, never mind in currency devaluation. You will remember from our last meeting , we pointed to the possibility of an unexpectedly situation developing (perhaps coincident with the Fed meeting) where both stocks and bonds begin to fall at the same time, which as you may know is when the worst market declines occur, with true panic seen in various markets such as the CBOE Volatility Index (VIX) . Here, many do not know the VIX went to 150 in 1987. And others think it couldn't happen again, not with all the controls in place today.
Enter the Fed, where it has already signaled its intension to cut rates on Tuesday, and maybe by 50-basis points not only in the Discount Rate , but also possibly the Fed Funds Rate , which would be a surprise considering futures are only forecasting a quarter-point cut here. Why would the Fed surprise the market with a larger than anticipated cut in Fed Funds? Answer, because libor rates are still forecasting Armageddon, where widening spreads indicate liquidity (and the larger credit picture) continue to deteriorate in spite of all the measures authorities have taken thus far to relieve a stressed system. What's more, this means the market thinks the Fed is behind the curve, where if they were to do what the futures market is predicting this week, meaning only cut the Fed Funds Rate by a quarter, then even if they drop the Discount Rate by more (50-basis points) citing their desire to improve liquidity between financial institutions, the positive effects of such a move could last only seconds literally, that being the time it takes crazed speculators to jam S&P 500 (SPX) futures higher thinking this will matter.
And as you may know, this is especially true in consideration of the fact put / call ratios on the SPX have been dropping, and are in fact plumbing multi-year lows at this time. The significance of this observation is in just how overbought the stock market is in the big picture (looking at a monthly plot here), where stocks could fall dramatically with the loss of this very important support mechanism. But – who can be short with a big rate cut, 2008 (think Decennial Pattern ), and seasonal strength dead ahead right? Answer: Those who know how markets work, which is why we intend to get very short either on Fed day, and / or by week's end depending how things shake out. Of course stocks could already be plunging by week's end, but because the equity complex tends to strengthen as the week moves on, it might be wise to ‘feather in' positions gradually with this in mind.
Prior to Copernicus, and much like the US (or any other dynasty of the day) views itself today, mankind thought we were center of the universe, and that the sun revolved around the earth. And it's this brand of egocentric thinking that has most market participants hallucinating that because the US consumer needs it, interest will remain low in spite of credit unworthiness and / or the trust factor. So, change here would be a big shocker to most Americans not realizing this is already happening, along with all the other cake eaters in what has been dubbed ‘the West'. (i.e. Europe , etc.) And this is likely putting it mildly.
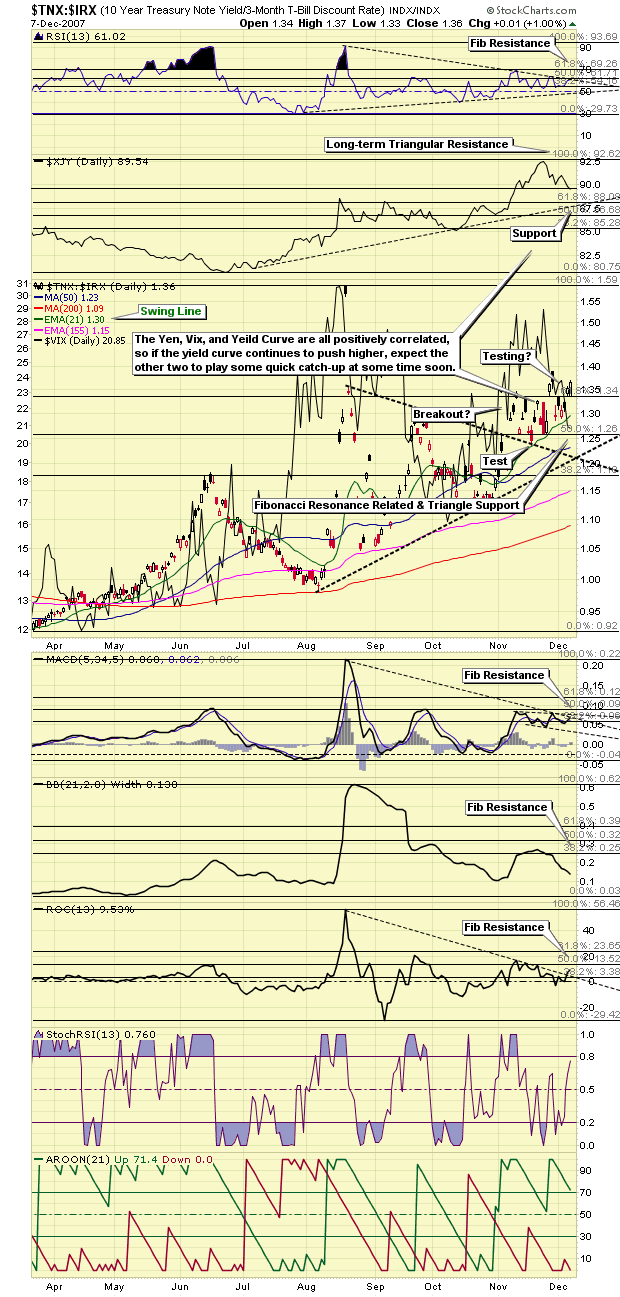
For this reason then, and in turning to the charts now to show you this is exactly what is happening, and what the consequences of such a change will likely be, one should note long-term market rates ( TNX ) took off with a vengeance on Friday, just when crazed stock market players saw fit to bang both the VIX and yen to new lows in what I view as their corrective moves currently underway. And it's this misplaced optimism with respect to the US condition created by stock market related euphoria that keeps both market rates (and monetizations of course) and yield curves lower (a rising curve means contracting liquidity), but as alluded to above, this could be set to change very soon. This is why the brokers and bankers are attempting to get a merger mania rolling once again (the need for speed ), because the machine needs to be fed soon or it will collapse onto it's own oversized and increasing indigent colossus. (i.e. the machine needs to be fed increasing amounts as the credit cycle matures, meaning hyperinflation is the only remedy left at this point to meet the simultaneously exploding needs of increasing interest payments to keep bankers fat and happy, along with grease in the wheels to keep us normal folks functioning.) (See Figure 1)
Figure 1
That was a mouthful, so I hope you take some time in attempting to understand the point I am conveying here. Again then, because the credit cycle needs increasing payments to maintain growth, all other things remaining constant, either a greater percentage of existing money supply growth must be assigned to this need at the expense of others or enough new money (more money) must be printed at an accelerating rate to meet all needs.
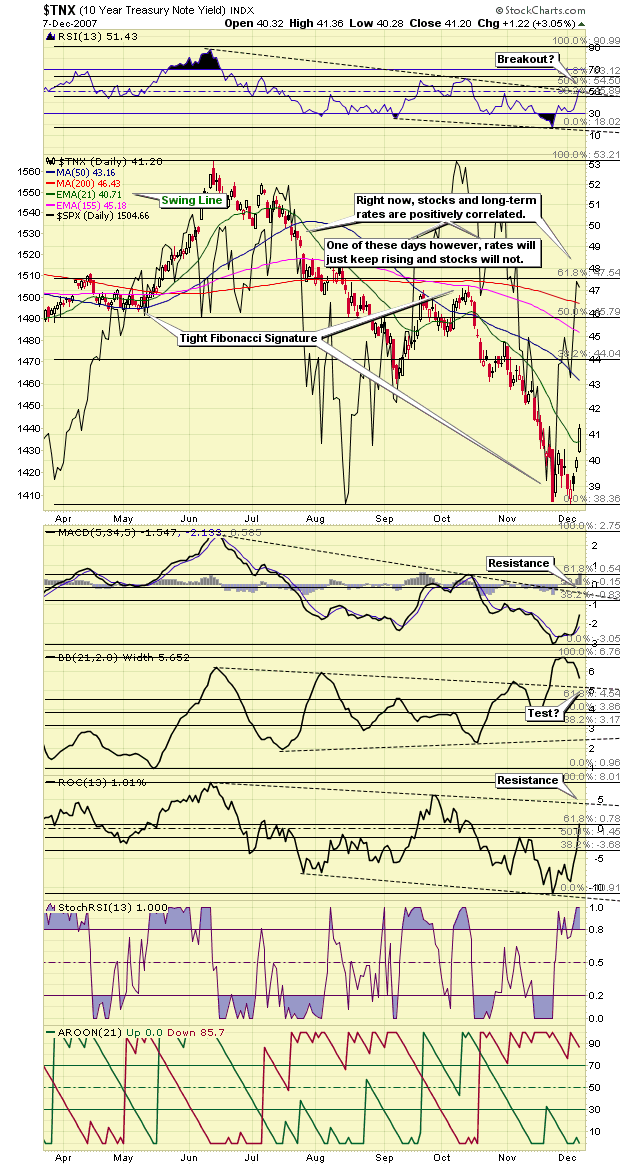
So, what happens if all needs are not met? Does this mean that if more of our incomes need go to pay interest payments things will be fine anyway? What about consumption – wouldn't consumption suffer under such circumstances? Obviously the answer to this last question is the one that deserves a ‘yes', where again then, it should be understood companies (and government with lower tax receipts) will soon have earnings crashes (if not already) if money supply growth rates do not keep accelerating here. Perhaps now then you might be better able to understand why a rising market rate (see below) / yield curve profile is so dangerous at this time. (See Figure 2)
Figure 2
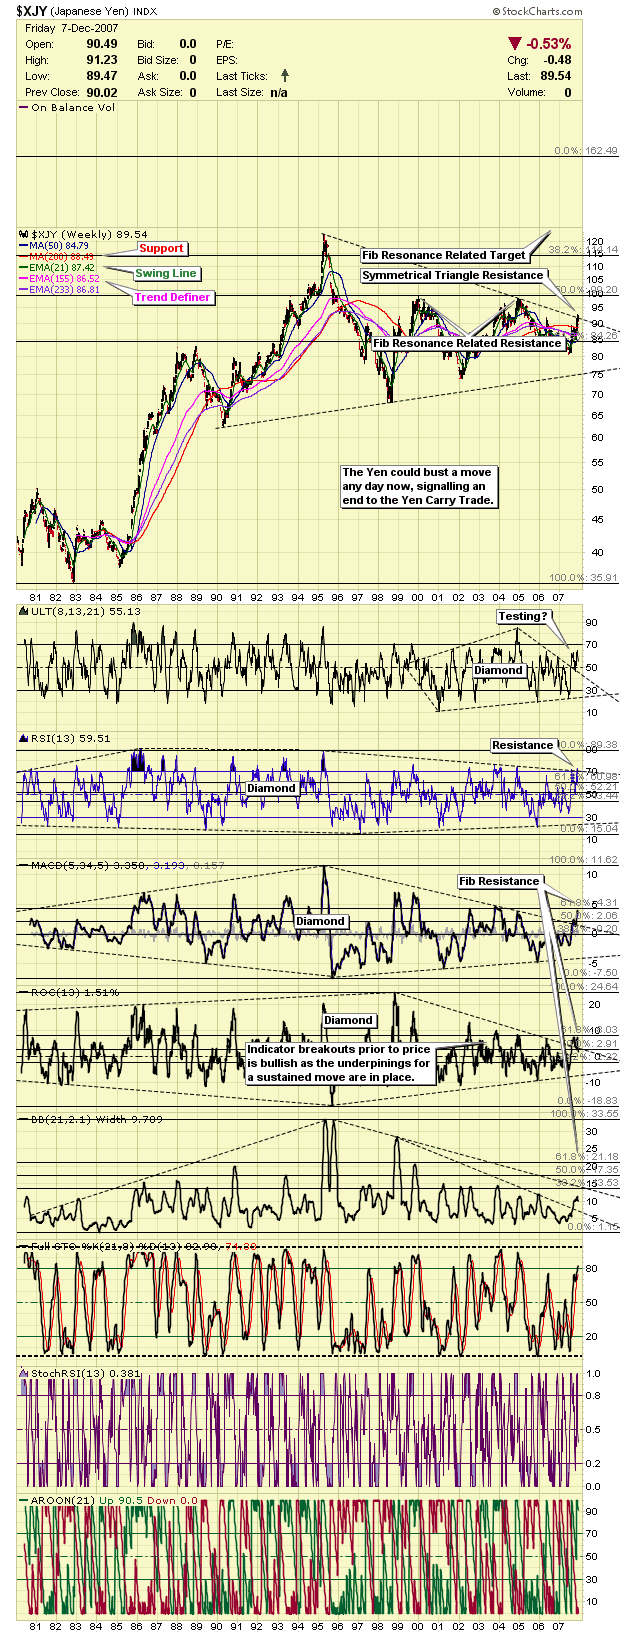
What's more, perhaps with this understanding you grasp the significance of a rising yen profile as well then, where again, basically the picture being painted by this circumstance set is one of contracting liquidity, not expanding (or even stable), which is of course not what an increasingly hungry credit cycle needs to survive. Here's another long-term look at the yen then, this time via a weekly plot because I wanted to show you the compelling bullish technicals coming to bare at present. In this respect, it shouldn't take you long to put two and two together if you've been paying attention, where while short-term anything is possible given the rate cut bone being waved in front of Pavlov's dogs, the fate of the larger equity complex is at best on shaky ground given it's hyperinflate time or die in the credit cycle. Furthermore, it should be noted the yen has already traced out a minimal (three-wave) retrace lower, where the bullish technicals associated with weekly and monthly plots could take over at anytime. (See Figure 3)
Figure 3
Unfortunately we cannot carry on past this point, as the remainder of this analysis is reserved for our subscribers. However, if the above is an indication of the type of analysis you are looking for, we invite you to visit our newly improved web site and discover more about how our service can help you in not only this regard, but on higher level aid you in achieving your financial goals. For your information, our newly reconstructed site includes such improvements as automated subscriptions, improvements to trend identifying / professionally annotated charts , to the more detailed quote pages exclusively designed for independent investors who like to stay on top of things. Here, in addition to improving our advisory service, our aim is to also provide a resource center, one where you have access to well presented ‘key' information concerning the markets we cover.
On top of this, and in relation to identifying value based opportunities in the energy, base metals, and precious metals sectors, all of which should benefit handsomely as increasing numbers of investors recognize their present investments are not keeping pace with actual inflation, we are currently covering 68 stocks (and growing) within our portfolios . This is yet another good reason to drop by and check us out.
And if you have any questions, comments, or criticisms regarding the above, please feel free to drop us a line . We very much enjoy hearing from you on these matters.
Good investing in 2008 all.
By Captain Hook
http://www.treasurechestsinfo.com/
Treasure Chests is a market timing service specializing in value-based position trading in the precious metals and equity markets with an orientation geared to identifying intermediate-term swing trading opportunities. Specific opportunities are identified utilizing a combination of fundamental, technical, and inter-market analysis. This style of investing has proven very successful for wealthy and sophisticated investors, as it reduces risk and enhances returns when the methodology is applied effectively. Those interested in discovering more about how the strategies described above can enhance your wealth should visit our web site at Treasure Chests
Disclaimer: The above is a matter of opinion and is not intended as investment advice. Information and analysis above are derived from sources and utilizing methods believed reliable, but we cannot accept responsibility for any trading losses you may incur as a result of this analysis. Comments within the text should not be construed as specific recommendations to buy or sell securities. Individuals should consult with their broker and personal financial advisors before engaging in any trading activities, as we are not registered brokers or advisors. Certain statements included herein may constitute "forward-looking statements" with the meaning of certain securities legislative measures. Such forward-looking statements involve known and unknown risks, uncertainties and other factors that may cause the actual results, performance or achievements of the above mentioned companies, and / or industry results, to be materially different from any future results, performance or achievements expressed or implied by such forward-looking statements. Do your own due diligence.
Copyright © 2007 treasurechests.info Inc. All rights reserved.
Unless otherwise indicated, all materials on these pages are copyrighted by treasurechests.info Inc. No part of these pages, either text or image may be used for any purpose other than personal use. Therefore, reproduction, modification, storage in a retrieval system or retransmission, in any form or by any means, electronic, mechanical or otherwise, for reasons other than personal use, is strictly prohibited without prior written permission.
Captain Hook Archive |
Inflation, Deflation - A Mexican Standoff
The inflation and deflation camps are now at completely opposite ends of the spectrum – each staring the other down in a Mexican Standoff of sorts. In this regard it's not uncommon to find articles telling us why inflation is the big concern right along side others that provide lucid arguments as to why 1929 is just around the corner. And as noted in our alert yesterday , not since the year 2000 have we witnessed such complacency in the trade considering what's happening out there, where if this keeps up at some point the equity complex will just snap-off one morning with big down days over seas leading the way. Of course on the flip-side of this, and as Dave pointed out the other day , history has proven that shorting technical set-ups like we have right now has proven expensive for the bears, and that most should abstain from shorting stocks. So, the 64 trillion dollar question arises, ‘who is right?'
The following is an excerpt from commentary that originally appeared at Treasure Chests for the benefit of subscribers on.
You would be amazed at the people who send us emails thinking we have the categorically correct answer to this question. In this regard I would just like to remind you what we are doing here is as much art as science, and that it's opinion not fact. What's more, if you think investing is an exercise in dealing with absolutes, and that proper portfolio / trading disciplines need not be followed, perhaps it would be a good idea for you to get a hold of a doctor expert in prescribing meds, because you will likely need them at some point. Here, anybody who has been at this game for a while should realize proper portfolio planning / trading strategies require constant monitoring for fidelity, especially in periods potentially characterized by rapid change due to smoke and mirrors conditions in a market place.
And that's exactly what we have today thanks to our moniker price managers that continue to manage the system to their own personal benefit. Now, economic imbalances and strains are so profound that under the right conditions financial markets could snap and / or cease to function, which is already the case within inter-bank markets, where we basically have a situation of the thieves rightfully not trusting each other. This of course brings to light a high degree of irony in the big picture considering the degree of trust the public still has for the banking community. Oh yes – I remember now – it's not that. No – I remember now – the public is either sleeping and / or brain dead. How could I have forgotten this?
Anywho – that's my rant for the day. Now it's time to get down to business. With respect to the stock market, and in qualifying the totality of comments made on this site with respect to our views regarding the future price movements in the broad stock market, while it may be true stocks could get squeezed higher from here, this does not mean a great deal of risk does not exist, and that precautions should be taken within your portfolios. In this regard yesterday's alert was a warning within this spirit and nothing more, where in previous instances such as this since 2003 a bunch of bearish speculators / hedgers show up on the scene and send short and put / call ratios right back up again, along with the stock market. And if they show up again over the next few days, we of course will not be surprised because there is technical evidence provided by Dave the other day (the positive reversal ) on the daily S&P 500 (SPX) plot suggestive a run to new highs is quite possible. Lest we forget the same technical set-up appeared in the TNX during summer however, which of course failed well before the measured move was traced out. As this understanding pertains to the stock market then, there is definitely no guarantee the SPX is on its way to 1612 (the measured move), and that unless some short sellers / hedgers show up very soon, stock markets will most likely continue to remain volatile, at a minimum.
Further to this, and why I am softening my view on just how fast stocks are destined to decline into the future, you should know that we are currently in the vicinity of options related floor pricing for all the US indexes. This means that even though open interest is declining, which is bearish and can supersede floor-pricing concerns, as options expiry approaches next week prices should get squeezed back up to current proximities if history is a good guide. If this does not occur, and especially if accompanied by low volumes over Christmas, January could be a very interesting month to say the least. As an aside, I still don't know what to make of the triangle / diamond in Goldman's chart (see Figure 4 ) other than they plan to squeeze stocks higher under the cover of low volumes over Christmas holidays in justifying their bonuses. Here, we still need to see that final lesser Degree 5 th wave traced out; so again, expect the unexpected, at least until January arrives and the truth of more normal volumes drive pricing once again.
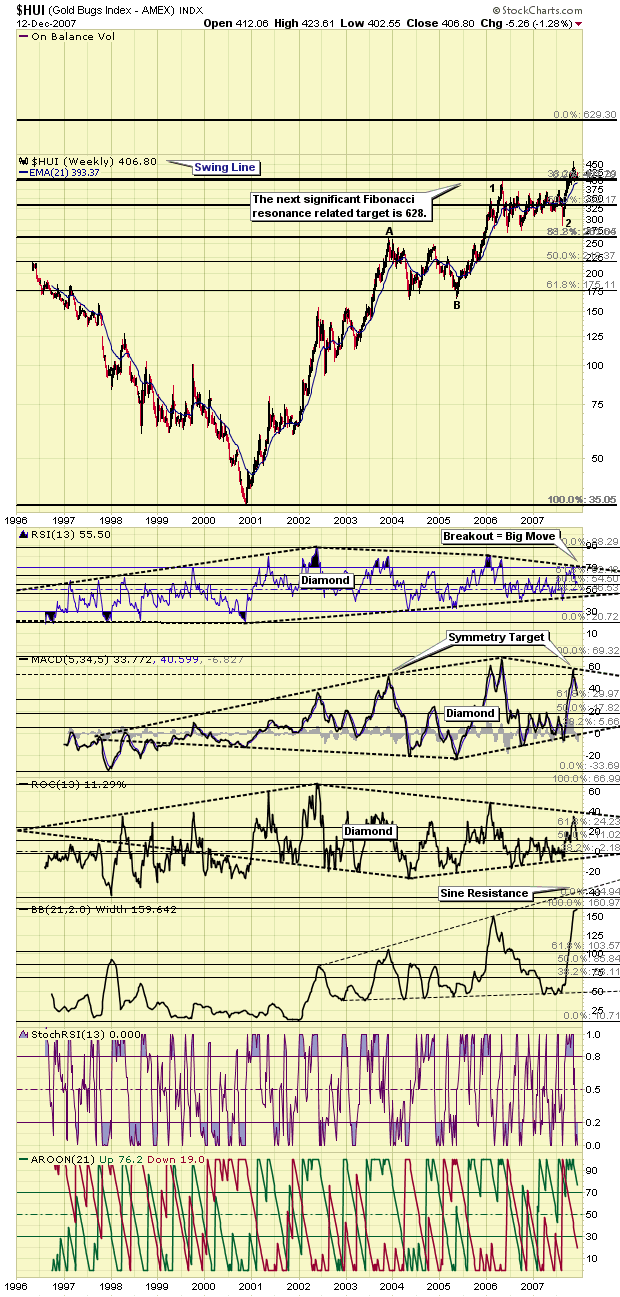
On to the precious metals markets now, where a Mexican Standoff of its own is currently being duked out, with not only the large round number at 400 [think Progressive Interval System (PI) ] on the Amex Gold Bugs Index (HUI) in play in this regard, but also $800 on gold, and $14 in silver. As for HUI technicals, they don't look bad at all, especially on the weekly shown below, where if one did not know the specter of a deflation scare could be directly upon us, you would think just a garden-variety correction was in the works. Of course prices do need hold current levels, where in looking at this plot, it would not be a good thing to see HUI prices travel too far away from the large round number at 400, as this would violate important Fibonacci resonance related support, and call into question the bull market in precious metals based on the preferred count at present. (See Figure 1)
Figure 1
And in bringing into the picture another significant technical consideration for the HUI, it just so happens that on top of being a large round number and important Fibonacci related support, the 400 metric also represent long-term trend line support, where without a doubt a trip down to 375 (daily trend definer and a 25-point interval a la our PI), and then 360 (200 MA) will not be much fun if one is long. As it stands today, given what I know about what's happening in the backdrop, and given gold will undoubtedly be the world's future reserve currency, meaning demand will go off the current scale at some point, in the meantime this does not mean a liquidity related event can't come along to scare the begeezes out of everybody. This means that if general price levels begin to decline in earnest, both gold, (and especially) silver would likely go along for the ride. Hence, precious metals shares would fall as well, with the big question being extent of course. (See Figure 2)
Figure 2
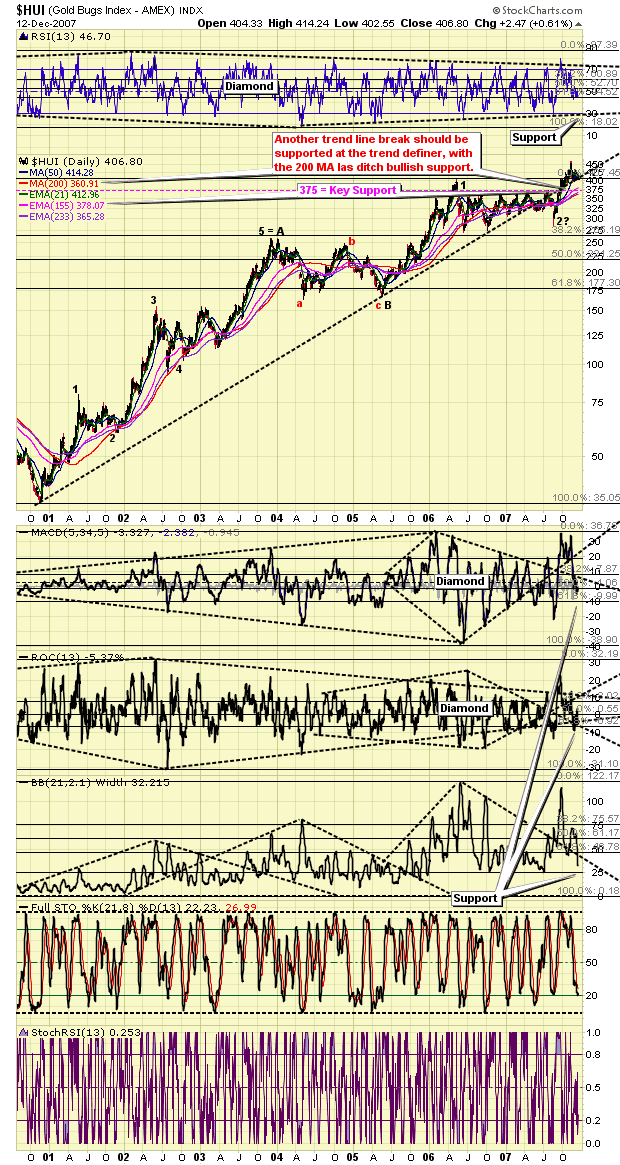
Apologies for not presenting the timeline analysis of the HUI discussed yesterday, but in already knowing we have a two-week correction window ahead of us if history is a good guide, upon review of a broad range of charts it quickly became apparent the ‘big picture' charts presented above were more important, so the time was spent on them. In summing up our current view on what the HUI is up to here then, it's most likely on its way down to test moving averages in the 360 to 375 area in coming days. Let's hope support holds no?
Unfortunately we cannot carry on past this point, as the remainder of this analysis is reserved for our subscribers. However, if the above is an indication of the type of analysis you are looking for, we invite you to visit our newly improved web site and discover more about how our service can help you in not only this regard, but on higher level aid you in achieving your financial goals. For your information, our newly reconstructed site includes such improvements as automated subscriptions, improvements to trend identifying / professionally annotated charts , to the more detailed quote pages exclusively designed for independent investors who like to stay on top of things. Here, in addition to improving our advisory service, our aim is to also provide a resource center, one where you have access to well presented ‘key' information concerning the markets we cover.
On top of this, and in relation to identifying value based opportunities in the energy, base metals, and precious metals sectors, all of which should benefit handsomely as increasing numbers of investors recognize their present investments are not keeping pace with actual inflation, we are currently covering 68 stocks (and growing) within our portfolios . This is yet another good reason to drop by and check us out.
And if you have any questions, comments, or criticisms regarding the above, please feel free to drop us a line . We very much enjoy hearing from you on these matters.
Good investing in 2008 all.
Captain Hook
By Captain Hook
http://www.treasurechestsinfo.com/
Treasure Chests is a market timing service specializing in value-based position trading in the precious metals and equity markets with an orientation geared to identifying intermediate-term swing trading opportunities. Specific opportunities are identified utilizing a combination of fundamental, technical, and inter-market analysis. This style of investing has proven very successful for wealthy and sophisticated investors, as it reduces risk and enhances returns when the methodology is applied effectively. Those interested in discovering more about how the strategies described above can enhance your wealth should visit our web site at Treasure Chests
Disclaimer: The above is a matter of opinion and is not intended as investment advice. Information and analysis above are derived from sources and utilizing methods believed reliable, but we cannot accept responsibility for any trading losses you may incur as a result of this analysis. Comments within the text should not be construed as specific recommendations to buy or sell securities. Individuals should consult with their broker and personal financial advisors before engaging in any trading activities, as we are not registered brokers or advisors. Certain statements included herein may constitute "forward-looking statements" with the meaning of certain securities legislative measures. Such forward-looking statements involve known and unknown risks, uncertainties and other factors that may cause the actual results, performance or achievements of the above mentioned companies, and / or industry results, to be materially different from any future results, performance or achievements expressed or implied by such forward-looking statements. Do your own due diligence.
Copyright © 2007 treasurechests.info Inc. All rights reserved.
Unless otherwise indicated, all materials on these pages are copyrighted by treasurechests.info Inc. No part of these pages, either text or image may be used for any purpose other than personal use. Therefore, reproduction, modification, storage in a retrieval system or retransmission, in any form or by any means, electronic, mechanical or otherwise, for reasons other than personal use, is strictly prohibited without prior written permission.
Captain Hook Archive |
Central Banks Entering Hyper Inflationary Money Supply End Game
 Central banks are now showering the economy with accelerating quantities of fiat digits like never before , which is having the effect of extending the current boom cycle even longer in spite of the natural tendency for system failure. Not too long from now however, and in spite of these efforts then, like a game of musical chairs enough participants will be expelled from the festivities in natural process, which is an eventuality that cannot be avoided no matter how much intervention is exercised. Moreover, it's the fact monetary debasement rates need be accelerated to this point that is the signal we are now in the final rounds of the game (end game dynamics), where like in musical chairs, if you are prepared and with a little luck one might be the one left standing at the end. And while this might sound fine for those prepared people, don't kid yourself, what's coming here is not going to be pleasant for anyone, as the hangover from the credit binge we have been on for some 25-years now will not pass in a day or two, meaning living standards are set to decay rapidly.
The following is an excerpt from commentary that originally appeared at Treasure Chests for the benefit of subscribers on.
The musical chairs analogy was used above because quite frankly I could not think of a better one, but at the same time it may not fit the bill in capturing the essence of what could occur as we move into the future either. In this regard, what I am referring to is true on two levels as well, those being this is not a child's game being played; and secondly, I'm not sure if a game of musical chairs captures the essence of an implosion, which is more akin to what is happening to our financial system at present in my opinion. Here, what's happening in the bond insurer arena at present is a good example of just how fast things can change in terms of institutional underpinnings, where all of a sudden investors are waking up to the fact this insurance isn't worth the paper it's written on , and that for this reason neither are the contingent guarantees (credit worthiness) of all the companies being covered. This of course has system wide ramifications as a result, with the primary side effect of the bugaboo being the days of cheap money for corporations have now passed.
One does need wonder just what is going through a rational bond investor's mind now then, where in spite of hot inflation data traders appear sanguine with respect to holding treasuries this year, as evidenced in capped 10-Year Treasury Bond Yields (TNX) and a restrained yield curve . Once we hit January however, things could be very different, which would provide impetus for a resumption of the stock market sell-off with overly optimistic gamers needing to purge stale positions from 2007, along with long-term investors selling profitable positions now that taxes will be deferred until 2009. What's more, at issue here is just how long foreign bondholders will remain sanguine with respect to their holdings, where even if they were to simply continue slowing purchases of US issues this would be enough to push market rates higher at the margin. And one of these days market rates will push past the ability of authorities to keep them contained through monetization efforts , with the season of discontent in this regard now upon us .
Not surprisingly then, the great deflation / hyperinflation debate continues in real time, with forces at opposing ends of the spectrum both intensifying, but with mother nature the sure winner in the end, meaning gravity will eventually prevail. Here, we all know about how monetary authorities are attempting to make it appear ‘all is within hand', and that they will paper over whatever comes our way. Unfortunately for them however, history has proven such an attitude naïve in the full measure of time, where other forces, such as changes in speculative tendencies within the investing population, come to light. And while I am not professing to know exactly when a combination of exhausted monetary stimulus efforts combined with altered speculative trends will be sufficient to tip the equity complex over, I can tell you we are getting closer by the day, along with the fact more and more people are beginning to notice .
In this respect then, at present we all know monetary growth rates are through the roof (with growth rates approaching historic highs ); and that sentiment, as measured by short sellers , is also at historically high extremes. So, for those observers / investors tuned into this frequency, attitudes remain positive with respect to the future based on these metrics, along with the fact year-end window dressing is surely a concern for distressed money managers . And while others would be quick to point out year-end tax related selling and continued pressure in the credit markets are holding prices back, as you may know we would not agree with such an assessment. In fact, we would tend to view things from the opposite side of the street, where were it not for seasonal / tax related / year-end buying the stock market would be imploding right now. Don't blink however, because as alluded to above once this buying dries up gravity should take hold to bring prices back down to earth. And if observations associated with the charts below are any indication, this could occur anytime after January Effect buying should dry up in the second week of the New Year. (See Figure 1)
Figure 1
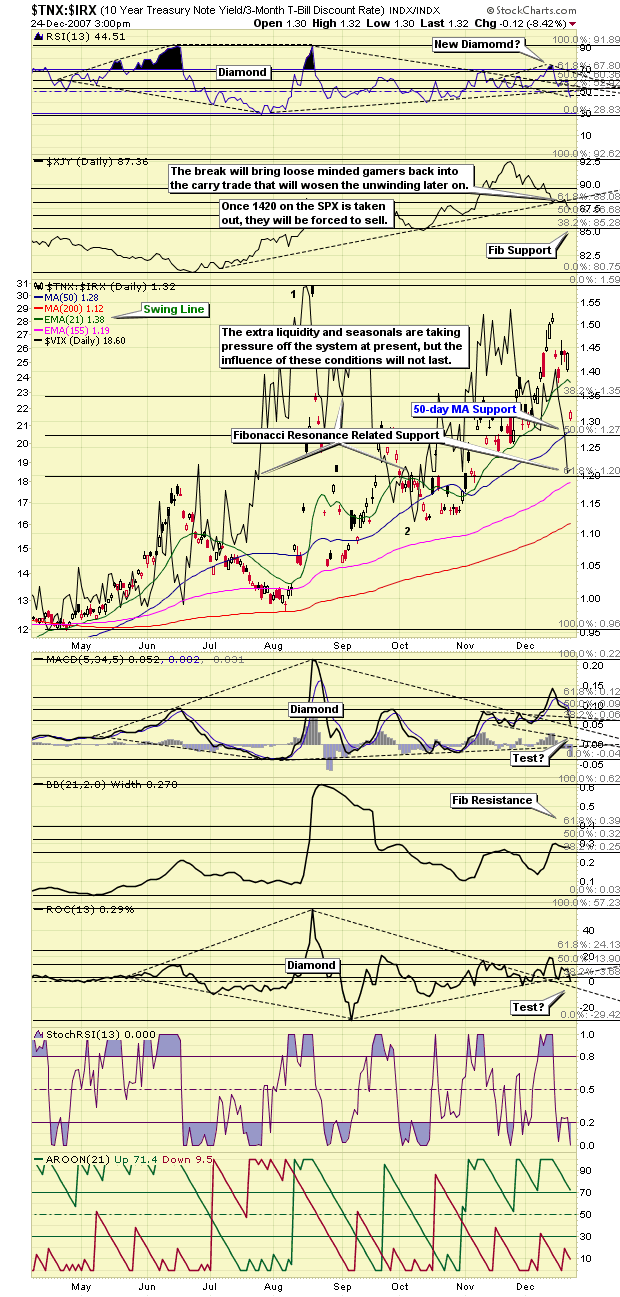
And if observations contained in the above have merit, in spite of all the liquidity injections occurring and promised into the future , it appears overall (liquidity) conditions may have already improved as much as can be reasonably expected measured by yield spreads, meaning both the yen (the primary global liquidity measure) and CBOE Volatility Index (VIX) would turn higher if yield curves did the same. What's more in this respect, it should be noted libor rates are now heading lower all right, which is taking pressure off the system temporarily, but that spreads between short and long dated contracts remain high, implying more trouble is on the way. This is why when we isolate our conversation to expectations associated with volatility, and as highlighted in the VIX plot below, while managed efforts to dance prices higher in coming days may continue to be marginally successful, it should be noted most of the gains have already occurred, and that the prudent investor need be more worried about gravity at this time, not hot air. (See Figure 2)
Figure 2
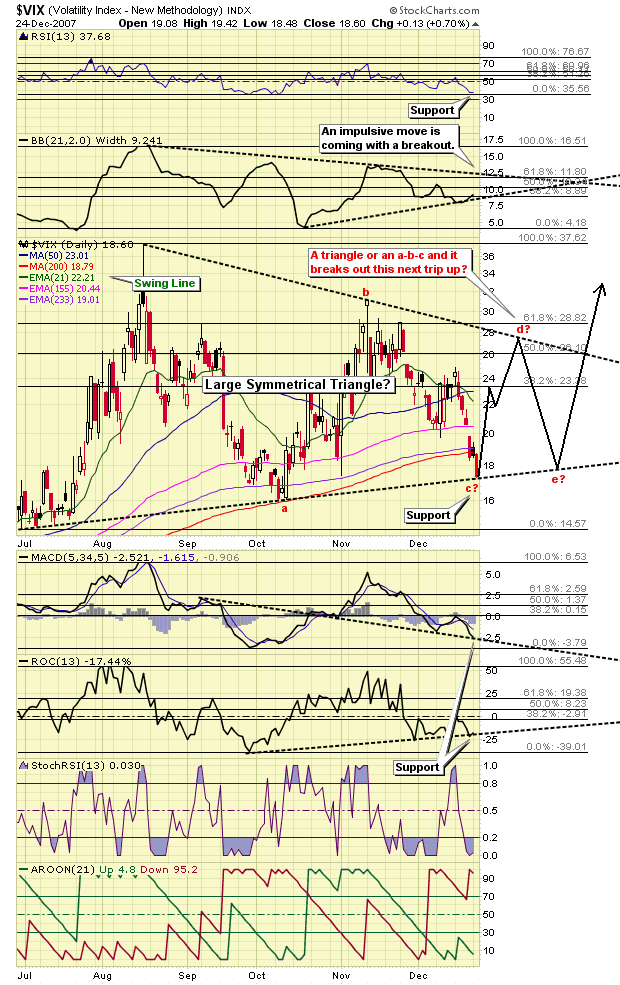
Moreover, and to emphasize this point, it should be noted this volatility will likely not be limited to the equity markets, but to debt markets as well, with seasonal weakness for US Treasuries dead ahead. So, while price managers may have brought the dollar ($) back up (allowing room for it to fall again), which would compensate for rising bond yields somewhat, it should be recognized that the US can ill-afford any disruption to its mushrooming foreign capital needs, even though official statistics continue to do a sorry job of measuring reality in this respect. Here, the true measure as to what is actually happening behind the scene is better monitored in yield spreads for forecasting purposes, where even if rates magically (due to monetization) remain subdued, stress in the system will still be reflected. And again, this also applies to trends in the yen and VIX, as noted above, where as with yield spreads unexpected reversals higher in coming days (after the first week in January) should be anticipated.
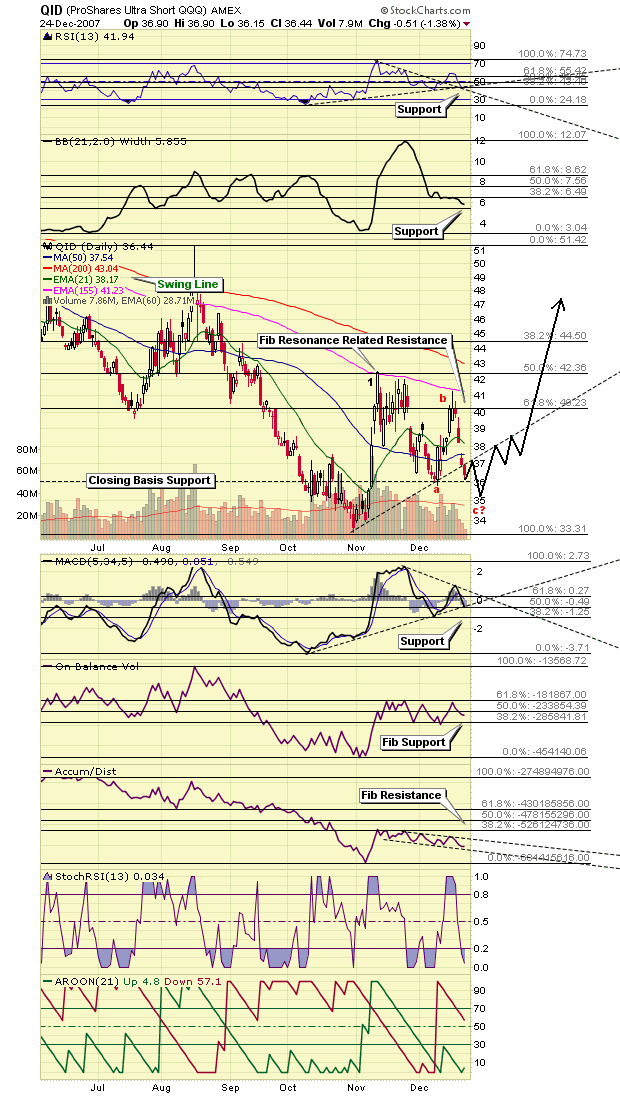
Further to this, and in refining comments made the other day in reference to patterning in the Dow, it's not a head and shoulders pattern being traced out, but that of a diamond, considered by some to be the most profound reversal pattern in technical analysis. And just like in the 1999 / 2000 sequence, with all the same timing and Dow Theory considerations confirming this thinking, if history is a good guide, then a top in the blue chips should be expected at options expiry this coming month, with the same for large cap tech heavy indices (think NASDAQ 100) in March. This patterning / timing possibility is reflected in the VIX plot above with a potential triangle (ending diagonal?) being traced out in coming months, but where it should be remembered that history does not always repeat (although it often rhymes), meaning a more extended topping process is not a prerequisite to a meaningful break lower in stocks anytime after early January. This possibility is reflected in potential patterning denoted in the ProShares UltraShort QQQ ETF (QID:AMEX) plot shown below. (See Figure 3)
Figure 3
Unfortunately we cannot carry on past this point, as the remainder of this analysis is reserved for our subscribers. However, if the above is an indication of the type of analysis you are looking for, we invite you to visit our newly improved web site and discover more about how our service can help you in not only this regard, but on higher level aid you in achieving your financial goals. For your information, our newly reconstructed site includes such improvements as automated subscriptions, improvements to trend identifying / professionally annotated charts , to the more detailed quote pages exclusively designed for independent investors who like to stay on top of things. Here, in addition to improving our advisory service, our aim is to also provide a resource center, one where you have access to well presented ‘key' information concerning the markets we cover.
On top of this, and in relation to identifying value based opportunities in the energy, base metals, and precious metals sectors, all of which should benefit handsomely as increasing numbers of investors recognize their present investments are not keeping pace with actual inflation, we are currently covering 68 stocks (and growing) within our portfolios . This is yet another good reason to drop by and check us out.
And if you have any questions, comments, or criticisms regarding the above, please feel free to drop us a line . We very much enjoy hearing from you on these matters.
Good investing in 2008 all.
By Captain Hook
http://www.treasurechestsinfo.com/
Treasure Chests is a market timing service specializing in value-based position trading in the precious metals and equity markets with an orientation geared to identifying intermediate-term swing trading opportunities. Specific opportunities are identified utilizing a combination of fundamental, technical, and inter-market analysis. This style
© 2005-2022 http://www.MarketOracle.co.uk - The Market Oracle is a FREE Daily Financial Markets Analysis & Forecasting online publication.


