


Will Stock Market 2019 be like 1999?
Stock-Markets / Stock Markets 2019 Feb 14, 2019 - 05:46 PM GMTBy: Troy_Bombardia

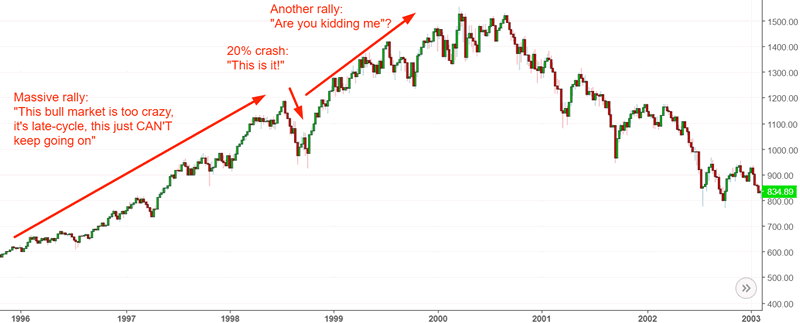
 As the stock market pushes higher, the year “1998” keeps popping up in our market studies recently. 1998 saw a rapid stock market crash, a retest (something we have yet to see today), followed by a massive nonstop rally. Everyone at the time thought that the 1998 crash was the start of a much bigger crash. To their surprise, the bull market (already late-cycle) surged for another 1.5 years before topping.
There is indeed the possibility that today is similar to 1998. There are fundamental and technical parallels.
Fundamental parallel
Towards the end of a bull market and economic expansion, there is usually a sharp growth scare that convinces market watchers “this is the start of a mega-crash”. In reality, big bear markets typically start off more slowly.
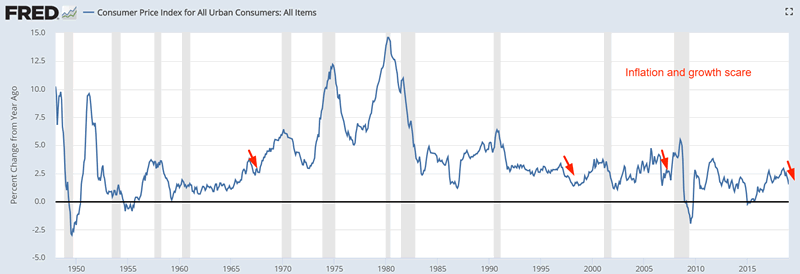
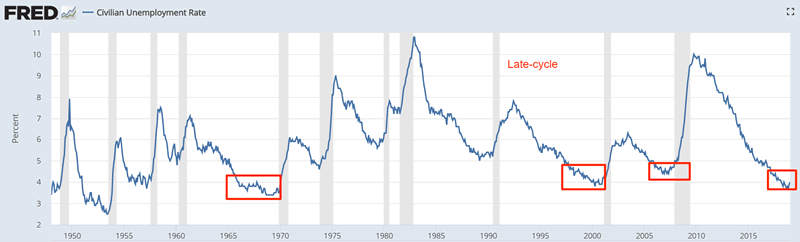
Inflation has dropped more than -1% over the past 6 months (a rapid decline thanks to oil’s crash), while unemployment is under 5% (i.e. late cycle).
Here are similar cases, and what happened next to the S&P 500
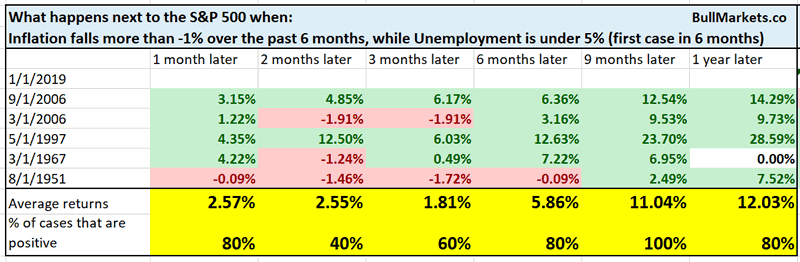
Note the late-cycle cases:
- March 2006: the bull market lasted another 1.5 years
- 1997: the bull market lasted another 3 years
- March 1967: the bull market lasted another 1.5 years
Late-cycle indeed, but not an immediately long term bearish sign for stocks
Breadth
This will be our last breadth study for a while because there’s no point in constantly talking about “extremely strong breadth”.
The NYSE McClellan Summation Index is extremely high right now, above 960. Bear market rallies typically do not see such strong breadth.
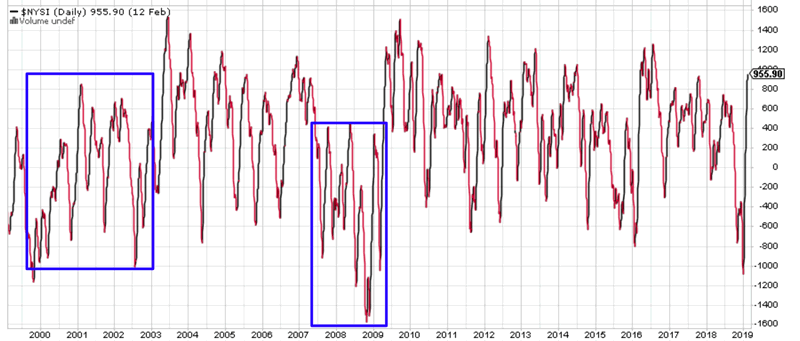
Here’s what happens next to the S&P 500 when the NYSE McClellan Summation Index exceeds 960
*Data from 1998 – present
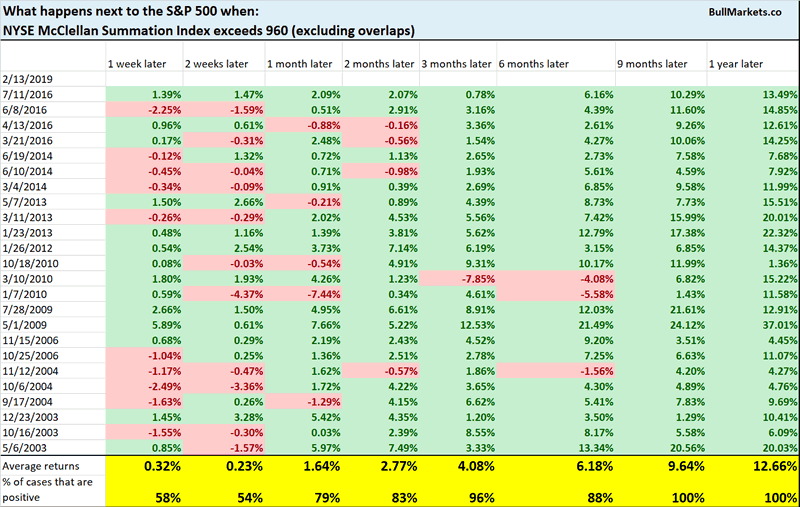
The S&P’s 6-12 month forward returns are quite bullish.
VIX’s “non-confirmation”
I follow a bunch of conventional traders because I want to know how conventional technical analysis views the stock market right now.
VIX went up today even though the S&P 500 went up. Some of these conventional traders see this as “VIX isn’t buying the stock market’s rally. BEARISH!”
From 1990 – present, there have been 812 days in which both the VIX and S&P went up on the same day.
This happens in bull markets and bear markets. This isn’t consistently bearish for stocks
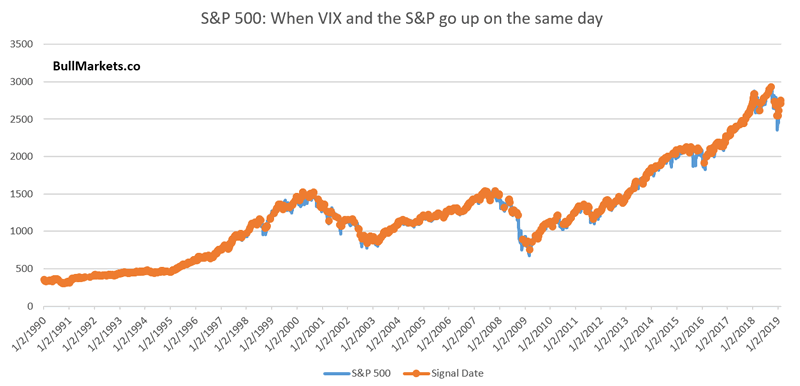
What’s more useful is if VIX and the S&P CONSISTENTLY go up together over several days. This has yet to happen, so let’s wait and see if it does happen.
U.S. Dollar Index
Among financial professionals, it’s popular to be bearish on the USD. Just look at the number of books mocking “fiat currency” and hoping for a U.S. Dollar crash (buy gold, get rid of USD – you know the drill).
Living in Australia, I would prefer it if the U.S. Dollar fell.
But that’s not what the data is suggesting right now.
The USD Index has swung in a very narrow range over the past 9 months.
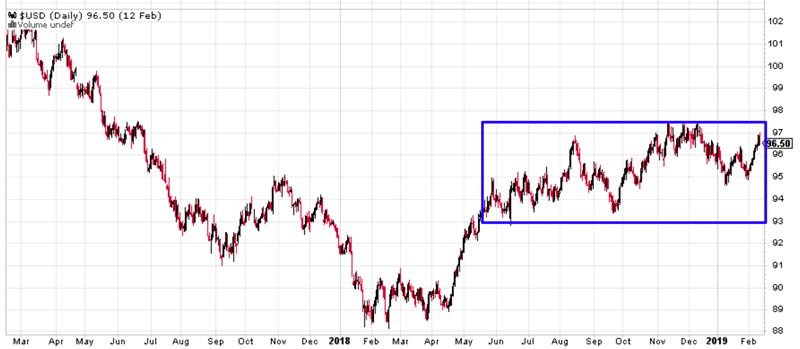
Here’s what happens next to the USD Index when it swings in a <4.5 point range over the past 9 months
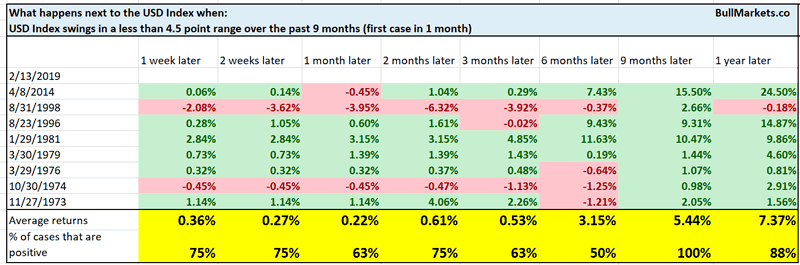
As you can see, these cases were not bearish for the USD 9-12 months later.
It seems that these narrow ranges are usually a consolidation pattern for the USD, to be followed by an upside breakout.
Here’s what the S&P 500 does next.

This is not consistently long term bearish for the S&P.
In my mind, the fundamentals support a long term bullish case for the USD as well.
- Debt is a much bigger problem ex-U.S. than within the U.S. Emerging markets, Europe, etc are weighed down by their debts.
- And right now, ex-U.S. economies are much weaker than the U.S. economy.
We feel this acutely here in Australia.
In many ways, Australia’s boom over the past 20 years is a result of China’s boom. From 1990 – 2011, Australia boomed as China sucked in raw materials from all around the world. Like Canada, Australia is a big commodities exporter. This commodities boom ended in 2011 when China’s economy slowed down (there are only so many skyscrapers, buildings, roads, and bridges you can build).
But Australia’s economy kept growing. As the Chinese economy weakened, masses of wealthy Chinese immigrated to other countries. Their immigration propped up the economies that they immigrated to.
Think about it this way. A wealthy Chinese immigrant moves to Australia. Using money that he made in China, he buys a $2 million mansion, BMW’s, LV bags, Rolex watches, and sends his kids to school in Australia. That’s a multi-million dollar injection into the Australian economy. Now imagine that wealthy Chinese immigrant and 100,000 others just like him. You can quickly see the wealth effect this has on Australia and other popular destinations for wealthy Chinese. Dont forget the money multiplier: a $1 million injection = more than a $1 million injection into Australian GDP.
This has driven Australia’s massive real estate bubble, which is evident in major coastal cities like Sydney and Melbourne. Not many locals can afford real estate at such stratospheric prices. (In Sydney, a 1 bedroom apartment costs $500k).
However, China does not have an infinite supply of millionaires and billionaires. Once most of the ones that want to leave China have left, the boom in ex-Chinese countries such as Australia slows down.
And that’s exactly what we’re seeing in Australia right now. Real estate activity fell in 2017, which led to falling real estate prices in 2018. Housing leads the economy. And now in 2019, the Australian labor market is deteriorating.
What’s the point behind this anecdote? Ex-U.S. economies are weakening faster than the U.S., especially the ones that are economically tied to China. This is a long term bullish factor for the USD.
*Take these thoughts with a grain of salt. I do not trade currencies. Just sharing what I’m observing and piecing a puzzle together.
Interest rates
Many market watchers attribute the recent stock market surge to Fed chairman Powell’s dovish shift. I disagree with this assertation, but that’s how many others see it.
Here’s what happens next to the S&P when it goes up more than 15% over the past 35 days, while the 3 month Treasury yield does not go up (i.e. dovish Fed).
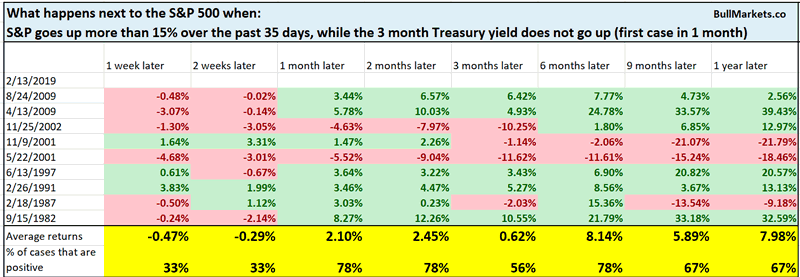
Except for a short term bearish lean, this is not consistently bullish or bearish for stocks.
Here’s what the 3 month Treasury yield itself does next
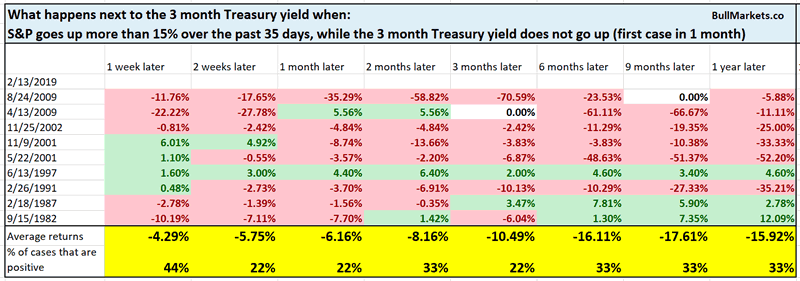
As you can see, the 3 month Treasury yield is consistently bearish. Perhaps Powell will cut rates later in 2019 or 2020
Nonstop rally
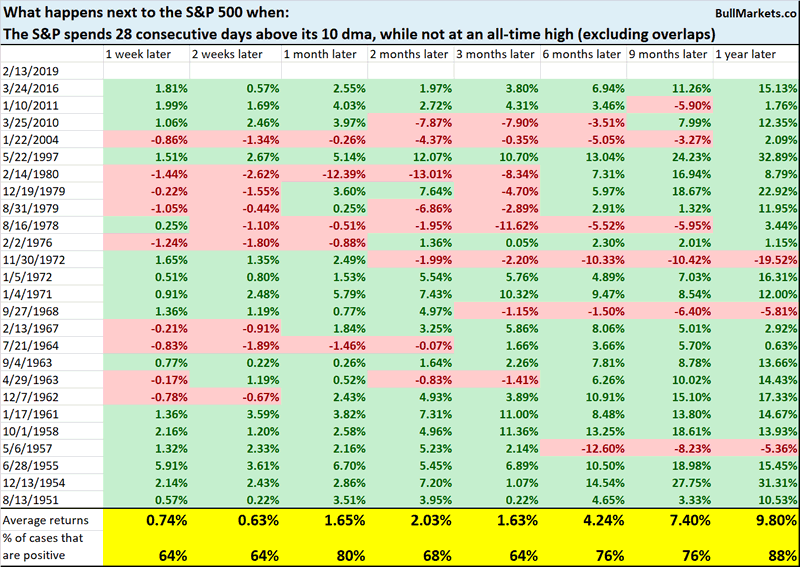
The S&P has now been above its 10 day moving average for 28 consecutive days.
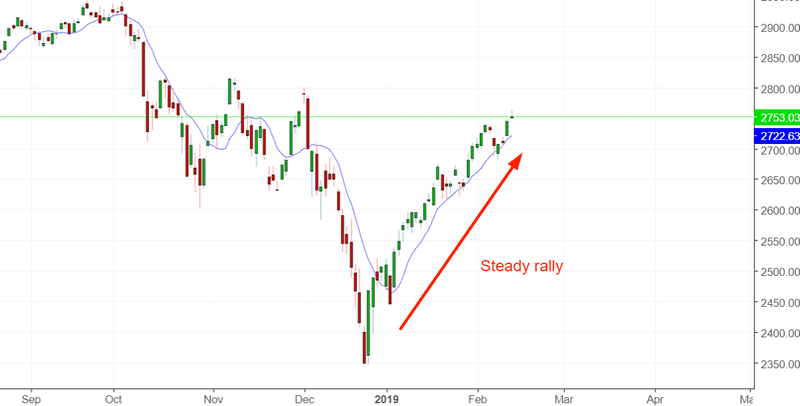
This is not consistently bullish or bearish for stocks on any time frame.
Click here for yesterday’s market study
Conclusion
Here is our discretionary market outlook:
- The U.S. stock market’s long term risk:reward is no longer bullish. This doesn’t necessarily mean that the bull market is over. We’re merely talking about long term risk:reward. Long term risk:reward is more important than trying to predict exact tops and bottoms.
- The medium term direction (i.e. next 6 months) is neutral. Some market studies are medium term bullish while others are medium term bearish
- The stock market’s short term has a bearish lean due to the large probability of a pullback/retest. Focus on the medium-long term (and especially the long term) because the short term is extremely hard to predict.
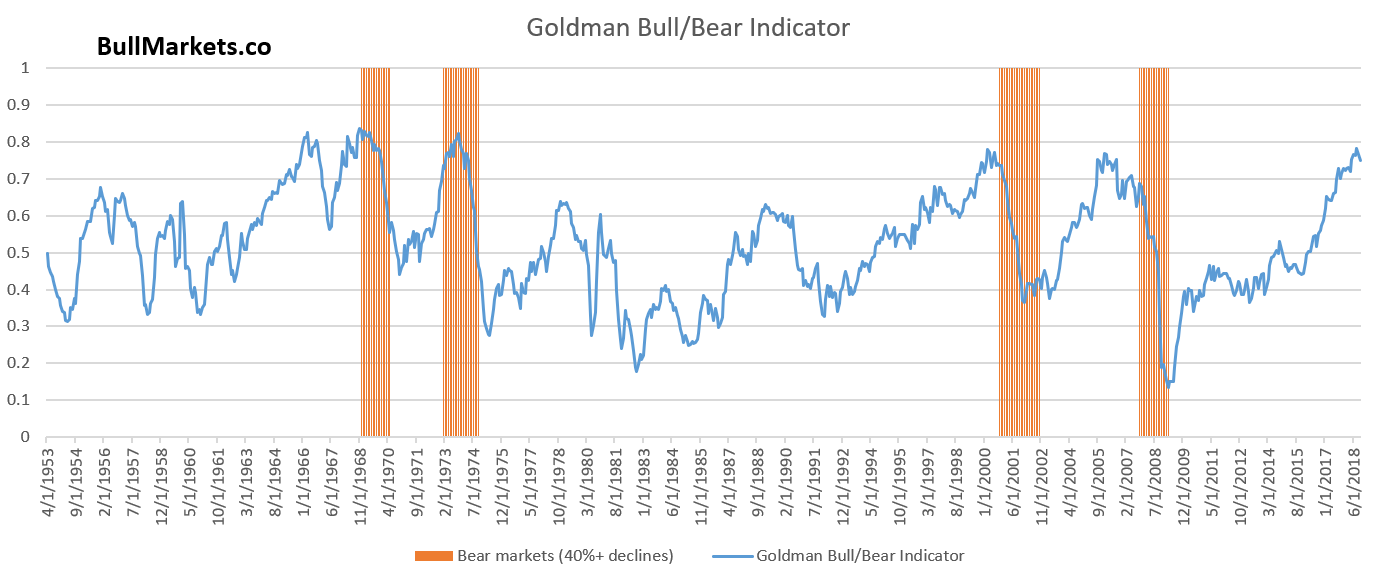
Goldman Sachs’ Bull/Bear Indicator demonstrates that while the bull market’s top isn’t necessarily in, risk:reward does favor long term bears.
Our discretionary outlook is not a reflection of how we’re trading the markets right now. We trade based on our quantitative trading models.
Members can see exactly how we’re trading the U.S. stock market right now based on our trading models.
Click here for more market studies
By Troy Bombardia
I’m Troy Bombardia, the author behind BullMarkets.co. I used to run a hedge fund, but closed it due to a major health scare. I am now enjoying life and simply investing/trading my own account. I focus on long term performance and ignore short term performance.
Copyright 2019 © Troy Bombardia - All Rights Reserved
Disclaimer: The above is a matter of opinion provided for general information purposes only and is not intended as investment advice. Information and analysis above are derived from sources and utilising methods believed to be reliable, but we cannot accept responsibility for any losses you may incur as a result of this analysis. Individuals should consult with their personal financial advisors.
© 2005-2022 http://www.MarketOracle.co.uk - The Market Oracle is a FREE Daily Financial Markets Analysis & Forecasting online publication.