


Right Now, the Bullish S&P 500 Ride Goes On No Matter What
Stock-Markets / Stock Markets 2020 May 09, 2020 - 08:52 PM GMTBy: P_Radomski_CFA

Yesterday, we’ve pointed out the many bullish signals going for stocks, and saw them open higher, and extend their gains. Well, that was true about the first half of the session, as the S&P 500 returned to trading close to unchanged before the closing bell. Is the upswing over now?
In short, we doubt that.
S&P 500 in the Short-Run
Let’s start with the daily chart analysis (charts courtesy of http://stockcharts.com ):
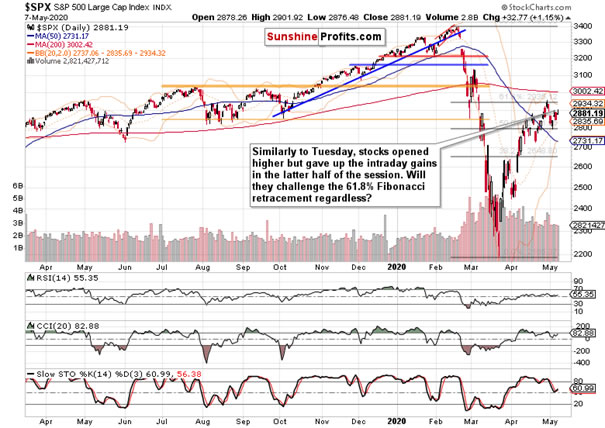
Yesterday’s volume wasn’t too high or too low – it’s actually quite consistent with what you would expect to see during an unfolding uptrend. As a result, the upswing has a pretty good chance of continuation – especially when you consider that stocks made another closing high yesterday. True, it’s still below the previous high, but we haven’t seen any sign of a reversal.
That’s why there can be no talk of a head-and-shoulders pattern reversal. First, the right shoulder isn’t completed – and we haven’t seen a breakdown below the neckline of this potential pattern-in-progress either. As it’s not completed, it carries no implications – and in our opinion, taking on the 61.8% Fibonacci retracement is more likely than breaking below the 50% one. So much for the bearish pattern.
But today, we’ll get the non-farm payrolls data, and they’ll be horrendous, you might say.
Yes, they will be indeed ugly. Uglier than ugly. But we’ve seen this story on Wednesday already – the market took a hit initially, but refused to decline for much longer. Accompanied by the credit market signals, this has made us enter into a long position, and we’re still profitably riding it this very moment. The point is that stocks have risen like phoenix from the ashes, and continue taking bad news in their stride. That’s what bull markets do, by the way.
Let’s recall our yesterday’s notes - they might turn out handy later today should we get a really bad number:
(…) It would be easy to jump to conclusions and cry that the sky is falling – but would that be justified? As they say, don’t throw the baby out with the bathwater.
The measured way of dealing with such a curveball would be to ask whether the outlook has changed.
Should the outlook as we assess it in its complexity indeed change, we’ll make an appropriate decision.
Preaching to the choir, we went on to write these timeless thoughts:
(...) What is the lesson here?
As for each and every trade, it’s to interpret the signals in their entirety – that’s the only way to get odds in your favor as much as reasonably possible.
As for trading performance over the long run, it’s to dutifully and attentively listen to the market’s many messages on a daily basis – with an open and flexible mind. It’s only over a long enough period of time and with sufficiently large a trade sample collection, that you see the edge you’re working with bring fruits. Christmas doesn’t come regularly in trading, and it would be foolish to jump out of the window because of any single trade.
Coupled with a money management lesson, you must give the edge enough breathing space to work its magic, and risk only as much (or even better, as little) so as to mount the next trade where the odds are again in your favor. And after that, the next one – regardless of the preceding day‘s result. And so on – trading is a marathon, not a sprint.
With that in mind, let’s dive into the credit markets now.
The Credit Markets’ Point of View
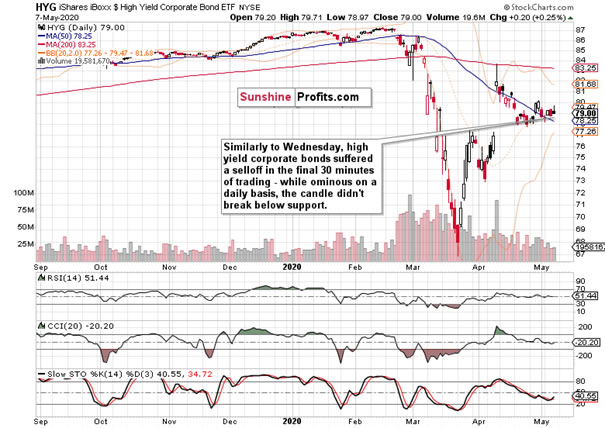
Opening with a bullish gap, high yield corporate debt (HYG ETF) gave up most of its intraday gains during the day, taking a dive in the last 30 minutes of trading. While the long upper knot looks sinister, the outlook again hasn’t changed – they haven’t broken below their recent lows.
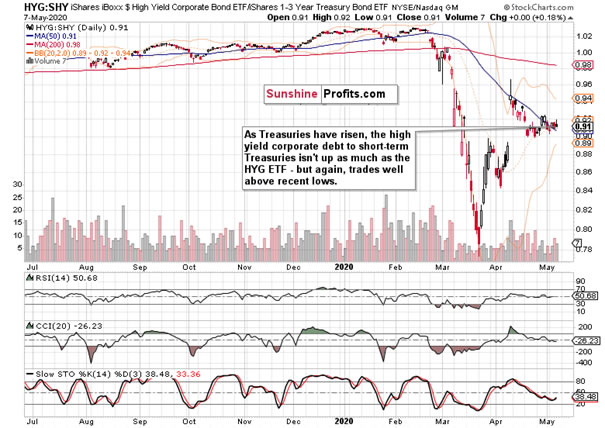
The ratio of junk corporate bonds to short-dated Treasuries (HYG:SHY) has performed slightly worse yesterday, driven by rising Treasuries across the board. Yes, not only the short-term ones (SHY ETF) went up, the same goes for long-dated ones (IEI ETF) too.
Again, unless we get a break below the recent lows, this charts’ outlook hasn’t changed either.
Let’s move to the key sectors next.
Key S&P 500 Sectors and Ratios in Focus
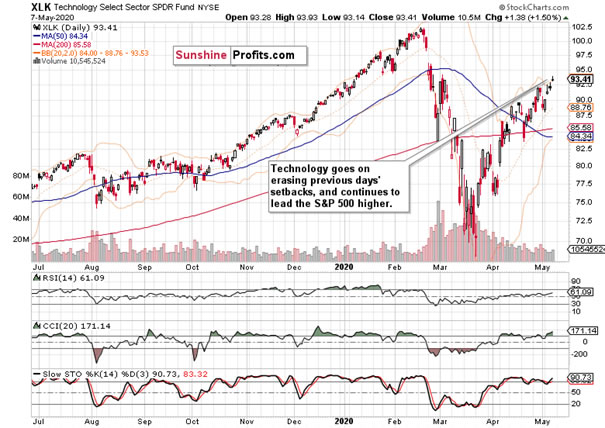
Another day, another new closing high in the tech sector (XLK ETF). Regardless of the upper knots of recent days, technology just continues to open higher the next day. While yesterday’s volume has been heavier that the days before, it would be premature to talk about a reversal. As things stand currently, technology continues to lead the S&P 500 upwards.
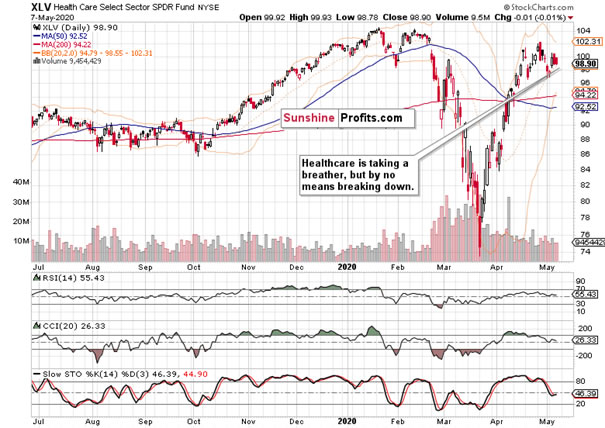
Healthcare (XLV ETF) isn’t performing as strongly, but it isn’t breaking down either. The sector appears just consolidating. Should we see higher volume with yesterday’s candle, that would be bearish – but it wasn’t there. Thus, consolidation appears to be the most probable scenario here.
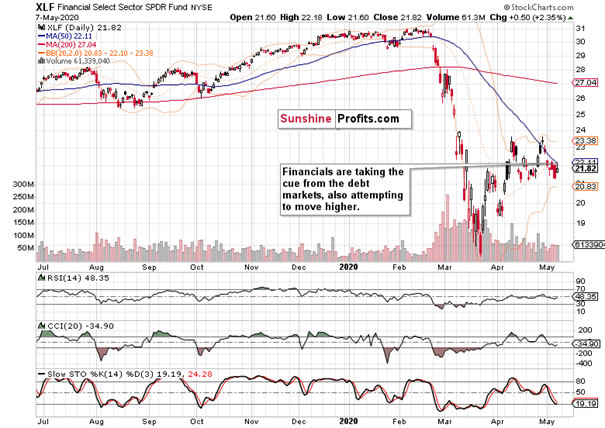
Supported by the bullish action in the HYG ETF early in the day, financials (XLF ETF) also opened with a bullish gap and extended gains. Unlike junk corporate bonds though, they haven’t given them up before the session was over, which is a bullish sign for the sector – and thanks to its ratio to utilities (XLF:XLU), also for the whole index.
As for the stealth bull market trio of sectors (energy, materials and industrials), their performance was somewhat mixed yesterday. Both energy (XLE ETF) and industrials (XLI ETF) opened higher, gave up their intraday gains, and closed virtually unchanged on the day. Only materials (XLB ETF) did better and held onto around half of their regular session’s gains.
Overall though, their message is bullish – and it’s also supported by yet another monthly high in the consumer staples to discretionaries ratio (XLY:XLP). By the way, this leading indicator is already trading well above where it was throughout each and every day in March.
Summary
Summing up, stocks again proved resilient in the face of grim employment data yesterday. While high yield corporate bonds wavered in the final 30 minutes of trading, their outlook hasn’t been invalidated – they continue to support the stock upswing. Coupled with the sectoral performance and key ratios, it’s likely we’ll see stocks shake off today’s bad employment data, and continue their grind higher. Our open and increasingly profitable long position remains justified.
If you enjoyed the above analysis and would like to receive daily premium follow-ups, we encourage you to sign up for our Stock Trading Alerts to also benefit from the trading action we describe – the moment it happens. The full analysis includes more details about our current positions and levels to watch before deciding to open any new ones or where to close existing ones. Check more of our free articles on our website – just drop by and have a look. We encourage you to sign up for our daily newsletter, too - it's free and if you don't like it, you can unsubscribe with just 2 clicks. If you sign up today, you'll also get 7 days of free access to our premium daily Stock Trading Alerts as well as our other Alerts. Sign up for the free newsletter today!
Thank you.
Monica Kingsley
Stock & Oil Trading Strategist
Sunshine Profits - Effective Investments through Diligence and Care
Monica Kingsley is a trader and financial markets analyst. Apart from diving into the charts on a daily basis, she is very much into economics, marketing and writing as well. Naturally, she has found home at Sunshine Profits - a leading company that has been publishing quality analysis for more than a decade. Sunshine Profits has been founded by Przemyslaw Radomski, CFA - a renowned precious metals investor and analyst.
Disclaimer
All essays, research and information found above represent analyses and opinions of Przemyslaw Radomski, CFA and Sunshine Profits' associates only. As such, it may prove wrong and be a subject to change without notice. Opinions and analyses were based on data available to authors of respective essays at the time of writing. Although the information provided above is based on careful research and sources that are believed to be accurate, Przemyslaw Radomski, CFA and his associates do not guarantee the accuracy or thoroughness of the data or information reported. The opinions published above are neither an offer nor a recommendation to purchase or sell any securities. Mr. Radomski is not a Registered Securities Advisor. By reading Przemyslaw Radomski's, CFA reports you fully agree that he will not be held responsible or liable for any decisions you make regarding any information provided in these reports. Investing, trading and speculation in any financial markets may involve high risk of loss. Przemyslaw Radomski, CFA, Sunshine Profits' employees and affiliates as well as members of their families may have a short or long position in any securities, including those mentioned in any of the reports or essays, and may make additional purchases and/or sales of those securities without notice.
© 2005-2022 http://www.MarketOracle.co.uk - The Market Oracle is a FREE Daily Financial Markets Analysis & Forecasting online publication.