


Are Small-Cap Stocks (Russell 2k) Headed For A Double Dip?
Stock-Markets / Stock Markets 2020 May 15, 2020 - 09:22 PM GMTBy: Chris_Vermeulen

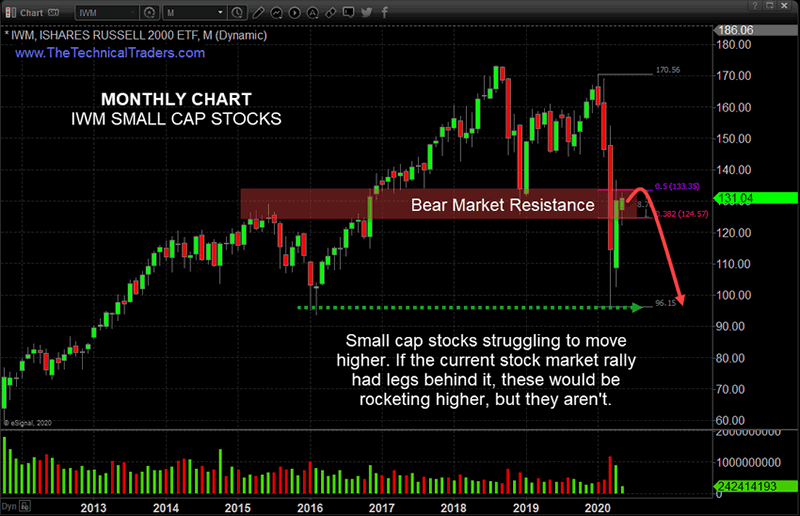
Our research team believes the Russell 2000 is leading the way in terms of technical analysis and future expectations. While the NASDAQ has rallied as a result of US Fed stimulus and foreign investor activity, the Russell 2000 has set up a very clear price resistance level near $131~132 that presents very real potential for a double-dip downward price trend in the near future.
Monthly IWM ETF Chart
The resistance level near $131~132 suggests the IWM may rotate downward, creating a right-shoulder, and likely attempt to move down to the $96 previous lows. If this resistance area can’t be breached by further upside price activity, then the price will likely attempt to rotate lower and rests multiple levels as price collapses back below $100 again. The lack of upward price activity in the Russell 2000, and other market sectors, suggests the rally is isolated to the NASDAQ and certain other symbols – not broad-based.
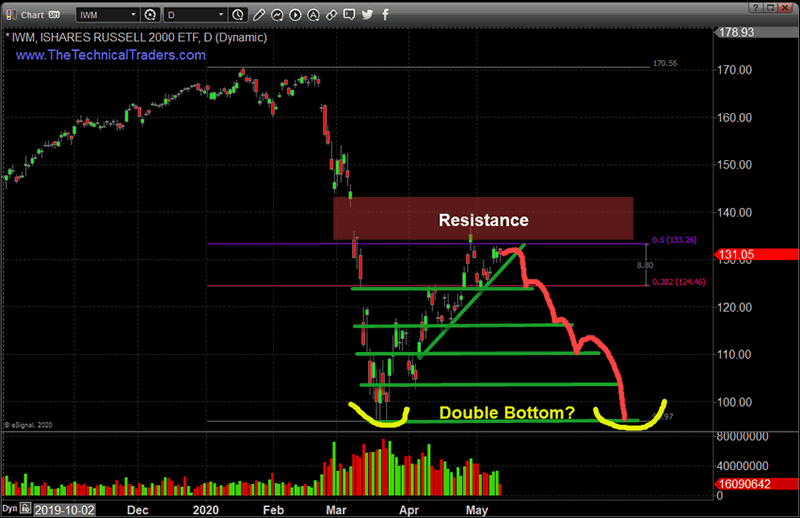
Daily IWM ETF Chart
This Daily IWM chart highlights the multiple levels of support below the current price levels. Each of these may act as some form of a soft floor in price as price attempts to move lower. Again, the lack of price to attempt to rally above the RED Resistance level on this chart suggests the Russell 2000 may have found a top and may begin to “rollover” as momentum diminishes.
If stocks are set to fall something else should start to rally. Check out my trade idea on silver!
Before you continue, be sure to opt-in to our free-market trend signals before leaving this page, so you don’t miss our next special report & signal!
Concluding Thoughts
Technical Traders watch for these types of patterns because they provide an A or B type of scenario for profits. Either, A, upper Resistance will be broken and the IWM will really past $140 and attempt a further upside price rally.. or, B, this resistance level will hold price below $140 and present a very real downside price opportunity where price may attempt to fall well below $110.
Our concern is that the initial downside price move in the markets, as a result of the COVID-19 virus event and global shutdown event, was followed by a Fed-induced “relief rally” that may be ending. Most of the time, these big impulse moves result in a “relief recovery” before further trending takes place. We believe the relief recovery is nearly over and the global markets may be setting up for a much bigger trending move.
If you are using our free public research for your own trading decision-making and/or using it as an opportunity to find and execute successful trades, please remember you are the one ultimately making the decisions to trade based on our interpretation and free research posts. We, as technical traders, will continue to post new research articles and content that we believe is relevant to the current market setups.
If you want to improve your accuracy and opportunities for success, then we urge you to visit www.TheTechnicalTraders.com to learn how you can enjoy our research and our members-only trading triggers (see the first chart in this article). If you are managing your retirement account or 401k, then we urge you to visit www.TheTechnicalInvestor.com to learn how to protect your assets and grow your wealth using our proprietary longer-term modeling systems. Our goal is to help you find and create success – not to confuse you.
Our researchers will generate free research on just about any topic that interests them. As technical traders, we follow price, predict future price moves, tops, bottoms, and trends, and attempt to highlight incredible setups that exist on the charts. What you do with it is up to you. Visit www.TheTechnicalTraders.com/FreeResearch/ to review all of our detailed free research posts.
In closing, we would like to suggest that the next 5+ years are going to be incredible opportunities for skilled traders. Remember, we’ve already mapped out price trends 10+ years into the future that we expect based on our advanced predictive modeling tools. If our analysis is correct, skilled traders will be able to make a small fortune trading these trends and Metals will skyrocket. The only way you’ll know which trades to take or not is to become a member.
Chris Vermeulen
www.TheTechnicalTraders.com
Chris Vermeulen has been involved in the markets since 1997 and is the founder of Technical Traders Ltd. He is an internationally recognized technical analyst, trader, and is the author of the book: 7 Steps to Win With Logic
Through years of research, trading and helping individual traders around the world. He learned that many traders have great trading ideas, but they lack one thing, they struggle to execute trades in a systematic way for consistent results. Chris helps educate traders with a three-hour video course that can change your trading results for the better.
His mission is to help his clients boost their trading performance while reducing market exposure and portfolio volatility.
He is a regular speaker on HoweStreet.com, and the FinancialSurvivorNetwork radio shows. Chris was also featured on the cover of AmalgaTrader Magazine, and contributes articles to several leading financial hubs like MarketOracle.co.uk
Disclaimer: Nothing in this report should be construed as a solicitation to buy or sell any securities mentioned. Technical Traders Ltd., its owners and the author of this report are not registered broker-dealers or financial advisors. Before investing in any securities, you should consult with your financial advisor and a registered broker-dealer. Never make an investment based solely on what you read in an online or printed report, including this report, especially if the investment involves a small, thinly-traded company that isn’t well known. Technical Traders Ltd. and the author of this report has been paid by Cardiff Energy Corp. In addition, the author owns shares of Cardiff Energy Corp. and would also benefit from volume and price appreciation of its stock. The information provided here within should not be construed as a financial analysis but rather as an advertisement. The author’s views and opinions regarding the companies featured in reports are his own views and are based on information that he has researched independently and has received, which the author assumes to be reliable. Technical Traders Ltd. and the author of this report do not guarantee the accuracy, completeness, or usefulness of any content of this report, nor its fitness for any particular purpose. Lastly, the author does not guarantee that any of the companies mentioned in the reports will perform as expected, and any comparisons made to other companies may not be valid or come into effect.
Chris Vermeulen Archive |
© 2005-2022 http://www.MarketOracle.co.uk - The Market Oracle is a FREE Daily Financial Markets Analysis & Forecasting online publication.