


Stock Market Gap Fills Suggests Market Momentum May Stall
Stock-Markets / Stock Markets 2020 Aug 14, 2020 - 02:34 PM GMTBy: Chris_Vermeulen

Technical Analysis teaches us that price Gaps tend to be filled by future price action. This is not something new for many of our readers, whom may be familiar with our mantra ‘Gaps always get filled!’. The big Gap created near February 24, 2020, the start of the COVID-19 market collapse, has recently been filled in the SPY and the TRAN (Transportation Index). We believe this “filling of the Gap” may be a sign that the upside market trend may begin to stall and potentially reverse.
Yesterday, we highlighted the potential for a continued upside bullish trend in the SPY pushing possibly 2% to 4% higher based on our Measured Move technique in our article entitled “President Trump Signs Additional Covid Relief – What to Expect From the Markets“. Today, with the TRAN gapping higher to fill the February 24, 2020, price Gap, we believe the upside move may be exhausting itself and nearing a period of congestion or reversal.
GAP FILLS MAY WARN OF TREND REVERSALS
Gaps are very interesting patterns where price momentum creates a “void” on the chart – essentially where price skips a price range because of momentum. Typically, these types of Gaps are often found in highly volatile periods of price action or strong momentum trends. Technical Analysis teaches us that most Gaps tend to be “filled” by future price action over time. This technical pattern should be viewed as a warning that the highest, most recent upside price Gap has currently been filled and would suggest that the markets are either going to continue to trend higher or reach an exhaustion point, stall and potentially reverse into a downside price trend.
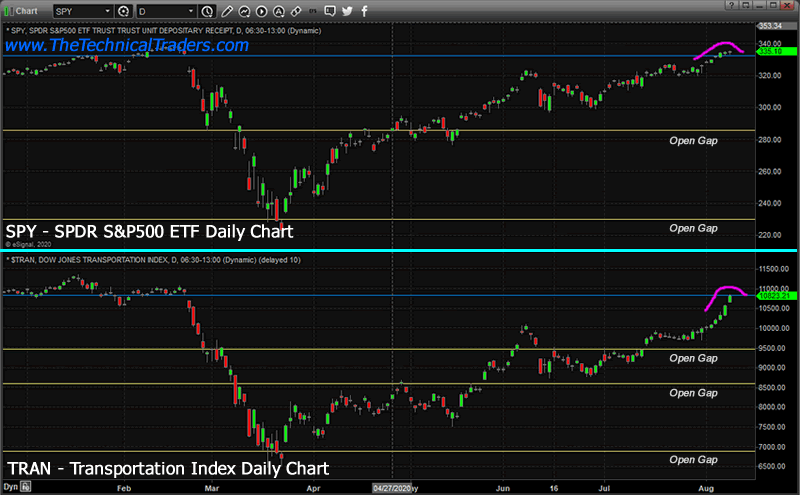
This SPY/TRAN chart above clearly highlights the upper Gap Fill that has recently taken place with the MAGENTA Arcing area on the charts. Both the SPY and the TRAN filled the Gap over a 4+ trading day range – with the TRAN Gapping higher on August 10 to properly fill the Gap. We’ve also highlighted “Lower Open Gaps” that are still unfilled. We wanted to point out that these lower gaps may become downside price targets if the trend changes into a Bearish Price Trend.
Before you continue, be sure to opt-in to our free-market trend signalsnow so you don’t miss our next special report!
The Weekly Custom Smart Cash Index chart, below, highlights what our research team believes is an early indication that global markets are stalling in an “Island Top” type of pattern after a very clear upside price gap on July 20, 2020. This Custom Smart Cash Index also shows how weak the upside Smart Cash price trend has become after the July 20, 2020 upside gap even though the trends in the SPY/TRAN chart, above, appear to be accelerating upward quite quickly. We believe the difference between these trends relates to institutional investors moving away from risks near these elevated levels while retail traders are still pounding away trading the shorter-term trends.
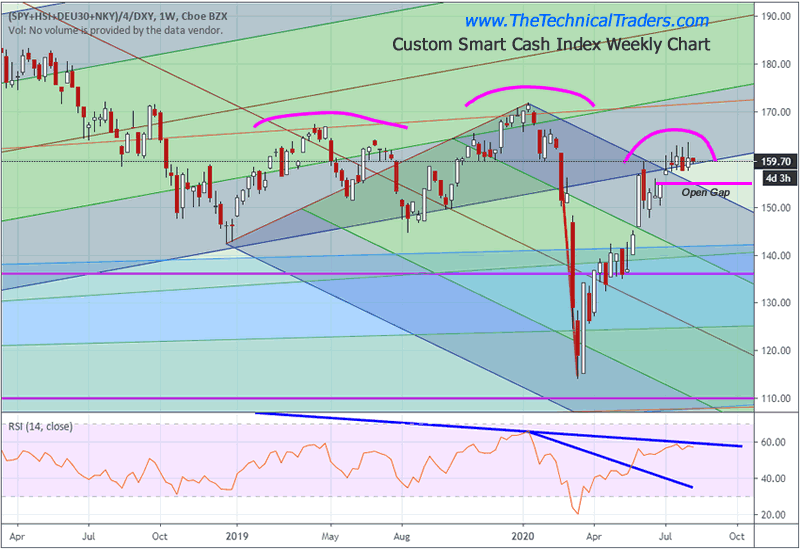
One thing is certain, the Custom Smart Cash Index suggests price has been unable to rally above recent highs over the past 5+ weeks while the SPY and TRAN have moved dramatically higher – something seems disconnected right now. Our research team believes the move in Gold and Silver is clearly illustrating that institutional and traditional investors are moving away from the perceived risks near these ultra-high price levels – leaving many retail traders chasing the tail end of this rally.
We are still moderately confident that the SPY will continue to attempt to move above the $337.50 level before reaching a peak in price – yet we are also keenly aware that upside potential relates to only +0.68% from current levels. Once the $337.50 level is reached, we believe the SPY, and the US major indexes, are likely to stall and potentially reverse after completing another 100% Measured Price Move higher. Our suggestion would be to protect open long positions and prepare for the potential breakdown in price should the “Island Top” pattern complete. The downside potential is clearly evident by the number of Open Gaps that are present below current price levels. Each one of these becomes a potential downside price target.
Learn how www.TheTechnicalTraders.com can help you find better trades and stay ahead of the biggest market moves. We just caught a beautiful trade in Silver and are still actively involved in another big trade. Learn how to trade with precision and accuracy by following our team of professionals.
If you found this informative, then sign up now to get a pre-market video every day before the opening bell that walks you through the charts and my proprietary technical analysis of all of the major assets classes. You will also receive my easy-to-follow ETF swing trades that always include an entry price, a stop, two exit targets, as well as a recommended position sizing. Visit my Active ETF Trading Newsletter to learn more.
While many of you have trading accounts, the most important accounts are long-term investment and retirement accounts. Why? Because these accounts are, in most cases, an individual’s largest store of wealth (other than home equity) and if they are not protected during a time like this, you could lose 25-50% or more of your entire net worth in a few days. We can help you preserve and even grow your long term capital when things get ugly (like they are now) and scary (as we expect them to soon be).
If you have any type of retirement account and are looking for signals when to own equities, bonds, or cash, be sure to become a member of my Long-Term Investing Signals, which includes a weekly market update and trade alerts.
Stay healthy and rest easy at night by staying informed through our services – sign up today!
Chris Vermeulen
www.TheTechnicalTraders.com
Chris Vermeulen has been involved in the markets since 1997 and is the founder of Technical Traders Ltd. He is an internationally recognized technical analyst, trader, and is the author of the book: 7 Steps to Win With Logic
Through years of research, trading and helping individual traders around the world. He learned that many traders have great trading ideas, but they lack one thing, they struggle to execute trades in a systematic way for consistent results. Chris helps educate traders with a three-hour video course that can change your trading results for the better.
His mission is to help his clients boost their trading performance while reducing market exposure and portfolio volatility.
He is a regular speaker on HoweStreet.com, and the FinancialSurvivorNetwork radio shows. Chris was also featured on the cover of AmalgaTrader Magazine, and contributes articles to several leading financial hubs like MarketOracle.co.uk
Disclaimer: Nothing in this report should be construed as a solicitation to buy or sell any securities mentioned. Technical Traders Ltd., its owners and the author of this report are not registered broker-dealers or financial advisors. Before investing in any securities, you should consult with your financial advisor and a registered broker-dealer. Never make an investment based solely on what you read in an online or printed report, including this report, especially if the investment involves a small, thinly-traded company that isn’t well known. Technical Traders Ltd. and the author of this report has been paid by Cardiff Energy Corp. In addition, the author owns shares of Cardiff Energy Corp. and would also benefit from volume and price appreciation of its stock. The information provided here within should not be construed as a financial analysis but rather as an advertisement. The author’s views and opinions regarding the companies featured in reports are his own views and are based on information that he has researched independently and has received, which the author assumes to be reliable. Technical Traders Ltd. and the author of this report do not guarantee the accuracy, completeness, or usefulness of any content of this report, nor its fitness for any particular purpose. Lastly, the author does not guarantee that any of the companies mentioned in the reports will perform as expected, and any comparisons made to other companies may not be valid or come into effect.
Chris Vermeulen Archive |
© 2005-2022 http://www.MarketOracle.co.uk - The Market Oracle is a FREE Daily Financial Markets Analysis & Forecasting online publication.