


Gold And Silver Follow Up & Future Predictions For 2020 & 2021 – Part I
Commodities / Gold & Silver 2020 Sep 29, 2020 - 10:40 AM GMTBy: Chris_Vermeulen

RESEARCH HIGHLIGHTS:
- Uncertainty and cycle events will likely lead to continued Gold and Silver price appreciation until the cycle events end (likely in 2024 or 2025).
- The gold/silver ratio chart shows very clear levels of support and resistance. With the next targets $2,000-$2,250, $3,200 then $5,500+.
- Extended basing may continue for the next 2 to 4+ months.
I have received many comments and questions related to our Gold and Precious Metals predictions originating from research posts we have made recently. Today’s research article is Part 1 of a two-part series, which will revisit some of our past forecasts and showcase what my research team and I believe will be the most likely outcome for Gold as we push through the end of 2020 and into early 2021.
A CONFLUENCE OF TECHNICAL AND CYCLE PATTERNS CONVERGE
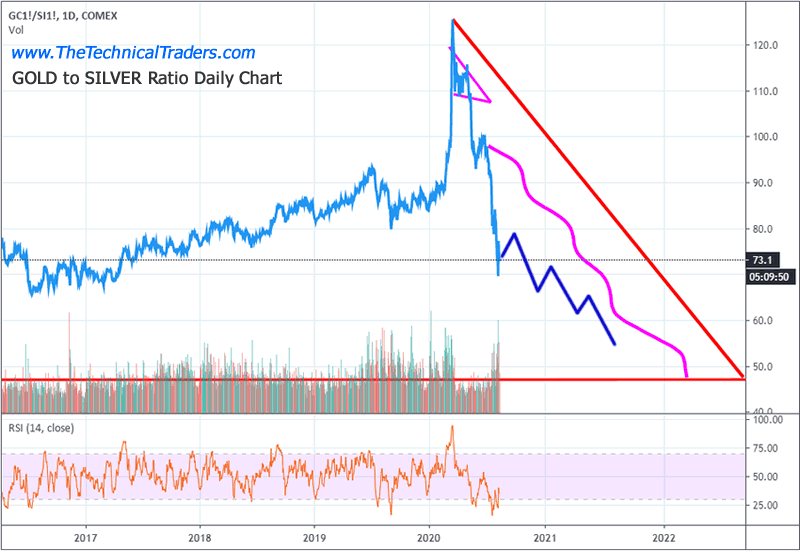
I will be referencing two of my team’s earlier research articles in this follow-up article. Our June 2020 article entitled All That Glitters When the World Jitters is Probably Gold put forth a bold prediction that the spike in the Gold to Silver ration during COVID-19 would collapse into a Flag formation, then collapse lower, resulting in a strong upside move for both Gold and Silver. In August 2020, our next piece of related research, Detailed 2020/2021 Price Forecasts for Gold & Silver, suggested detailed “100% Measured Moves” would continue to drive Gold and Silver prices higher in block-like advances until a true parabolic upside rally broke away from these 100% Measured Move price events.
The chart below from the August research article highlights how our predictions translated into reality as the spike in the Gold to Silver ratio broke lower after the March 20, 2020 bottom, then executed a series of 100% Measured Moves resulting in a deeper price breakdown in the Gold to Silver ratio chart. It also highlights the future expectations as of August 2020 – where we suggested a more moderate sideways decline in the ratio would likely take place resulting in more moderate measured moves lower.
There are a number of factors related to precious metals and the fragility of the global markets in the current market environment. To this end, we have also recently posted a research article suggesting the major Super Cycles are aligning in a way that suggests we may experience 3 to 5+ years of very odd price cycles. This is something that we have not seen in well over 75 years. We are also in an election year cycle. Please review the following articles for more information on the cycle events that are currently playing out.
April 2, 2020: STOCKS HAVE ENTERED A 25-35 YEAR CRISIS CYCLE RE-EVALUATION EVENT
June 1, 2020: ELECTION YEAR CYCLES – WHAT TO EXPECT?
What does all of this mean for Precious Metals? It means the uncertainty and cycle events will likely lead to continued Gold and Silver price appreciation until the cycle events end (likely in 2024 or 2025). Below, we will share our thinking related to the future price actions in Gold, and how the Gold to Silver ratio will react over the next 6 to 12+ months, to help you better understand the opportunity we believe will continue to persist in Precious Metals for some time to come.
Before you continue, be sure to opt-in to our free-market trend signalsnow so you don’t miss our next special report!
The recent downside price move in Gold and Silver is suggestive of the COVID-19 price collapse in Precious Metals. As the markets have fallen over the past 2 to 3+ weeks, Gold and Silver fell from support levels and set up a moderately deep price low , similar to what happened when COVID-19 took hold. My research team believes this downside “washout” is the same type of reactive price move as we saw in February/March 2020 when the broad US and global markets collapsed. We see a deep washout low price rotation well below reasonable support levels.
Although it may be difficult to see on the Monthly Gold to Silver ratio chart below, the right side of the chart shows the recent upward spike in the ratio (follow the END of the BLUE LINE). Because of the current rally in both Gold and Silver followed by the recent moderate downside price move in metals, the Gold to Silver ratio has yet to spike above the SUPPORT level on this chart. What happened back in March 2020, after the COVID-19 collapse was that Gold rallied back to near recent high levels while Silver languished near low price levels – that is what caused the spike in the Gold to Silver ratio.
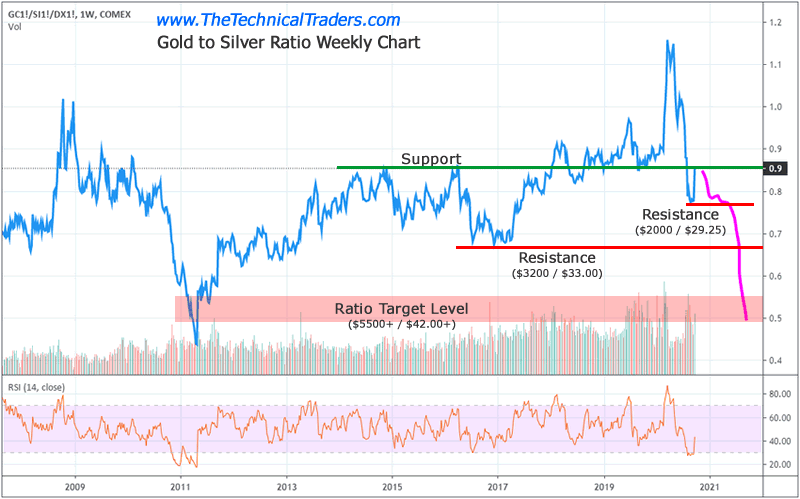
Currently, both Gold and Silver have collapsed nearly equally, resulting in a more moderate spike in the Gold to Silver ratio. We believe the SUPPORT level on this chart will act as a ceiling for the ratio going forward. We believe the two downside RESISTANCE levels will become the next targets for Gold. The $2000 to $2250 level is very clearly the next upside price target. Once this level is reached, then we believe Gold will attempt to move to $3200 or higher. Ultimately, the $5500 level is on our radar as an eventual parabolic price trend takes place (this may be well into 2022 or later).
Our research suggests a new BASE is setting up in the US stock market and in Gold and Silver. This new base may become the future launch pad for a very big price move higher. Our researchers believe this new basing pattern will start to complete near the middle/end of 2021 (possibly extending into early 2022). We are watching the current price action in the US stock market and precious metals to better determine where and when this incredible setup initiates the next big upside price move.
We believe extended basing may continue for the next 2 to 4+ months in the US stock market and precious metals. This does not mean that precious metals will trade sideways – it is very likely that metals may continue to push higher from the current base levels. We believe this new basing pattern will prompt a big upside move eventually, but right now we believe the moves to be more moderate and prompt more of an upside “drift” in metals.
In Part II of this research post, we’ll highlight more of our expectations and attempt to highlight the new FUTURE BASE that is setting up in the US stock market and precious metals.
As a technical analyst and trader since 1997, I have been through a few bull/bear market cycles in stocks and commodities. I believe I have a good pulse on the market and timing key turning points for investing and short-term swing traders. Subscribers of my Active ETF Swing Trading Newsletter can ride my coattails as I navigate these financial markets and build wealth. My research and trading team are here to help you find better trades and navigate these incredibly crazy market trends.
While most of us have active trading accounts, our long-term investment and retirement accounts are equally at risk. We can also help you preserve and even grow your long term capital when things get ugly (likely now) with our Passive Long-Term ETF Investing Signals. Don’t wait until it is too late – subscribe today!
Chris Vermeulen
www.TheTechnicalTraders.com
Chris Vermeulen has been involved in the markets since 1997 and is the founder of Technical Traders Ltd. He is an internationally recognized technical analyst, trader, and is the author of the book: 7 Steps to Win With Logic
Through years of research, trading and helping individual traders around the world. He learned that many traders have great trading ideas, but they lack one thing, they struggle to execute trades in a systematic way for consistent results. Chris helps educate traders with a three-hour video course that can change your trading results for the better.
His mission is to help his clients boost their trading performance while reducing market exposure and portfolio volatility.
He is a regular speaker on HoweStreet.com, and the FinancialSurvivorNetwork radio shows. Chris was also featured on the cover of AmalgaTrader Magazine, and contributes articles to several leading financial hubs like MarketOracle.co.uk
Disclaimer: Nothing in this report should be construed as a solicitation to buy or sell any securities mentioned. Technical Traders Ltd., its owners and the author of this report are not registered broker-dealers or financial advisors. Before investing in any securities, you should consult with your financial advisor and a registered broker-dealer. Never make an investment based solely on what you read in an online or printed report, including this report, especially if the investment involves a small, thinly-traded company that isn’t well known. Technical Traders Ltd. and the author of this report has been paid by Cardiff Energy Corp. In addition, the author owns shares of Cardiff Energy Corp. and would also benefit from volume and price appreciation of its stock. The information provided here within should not be construed as a financial analysis but rather as an advertisement. The author’s views and opinions regarding the companies featured in reports are his own views and are based on information that he has researched independently and has received, which the author assumes to be reliable. Technical Traders Ltd. and the author of this report do not guarantee the accuracy, completeness, or usefulness of any content of this report, nor its fitness for any particular purpose. Lastly, the author does not guarantee that any of the companies mentioned in the reports will perform as expected, and any comparisons made to other companies may not be valid or come into effect.
Chris Vermeulen Archive |
© 2005-2022 http://www.MarketOracle.co.uk - The Market Oracle is a FREE Daily Financial Markets Analysis & Forecasting online publication.