


First year of a Stocks bull market, or End of a Bubble?
Stock-Markets / Stock Market 2021 Feb 17, 2021 - 05:41 PM GMTBy: Troy_Bombardia

This bull market is unique because unlike past bull markets, this one began with extreme speculation. Historically, extreme speculation occurred at the end of multi-year bull markets. This is why the markets are currently exhibiting extremely bullish signs (e.g. breadth today is similar to what you see at the start of multi-year bull markets) and extremely bearish signs (e.g. speculation today is similar to what you see at the end of multi-year bull markets). How do we reconcile these two opposites?
Let’s take a look at some bullish & bearish factors:
Subsiding volatility
VIX closed below 20 for the first time in almost a year. The past year was a nervous one for markets: stocks rallied, but investors and traders were consistently on edge.
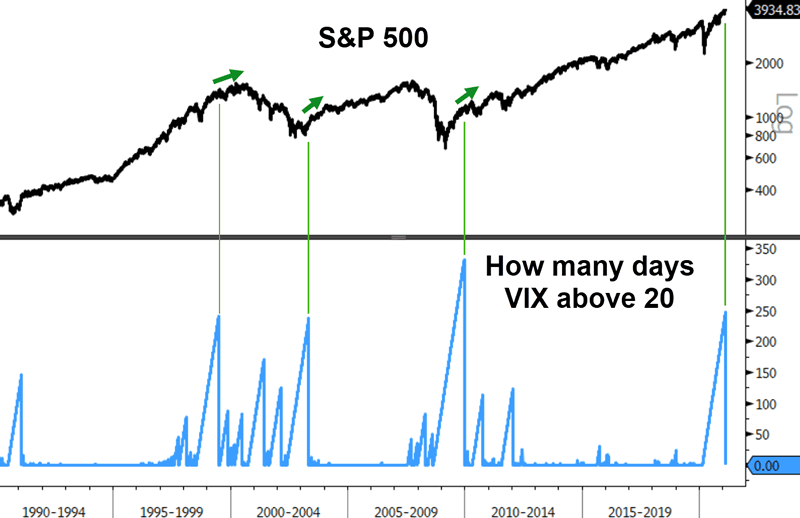
Historical cases of elevated but subsiding volatility led to more gains for stocks over the next 6-12 months:
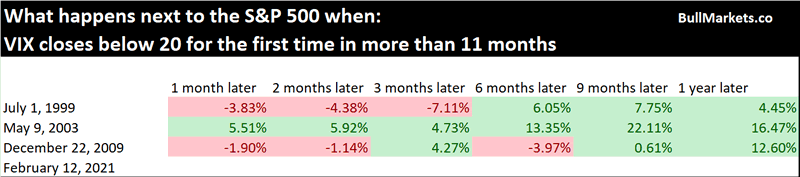
- July 1999: the dot-com bubble lasted for another 9 months.
- May 2003: stocks rallied significantly over the next 9 months:
- December 2009: stocks rallied over the next year, but there was a significant correction along the way
Fund flows
The recent VIX spike saw record inflows into the leveraged VIX ETF (UVXY).
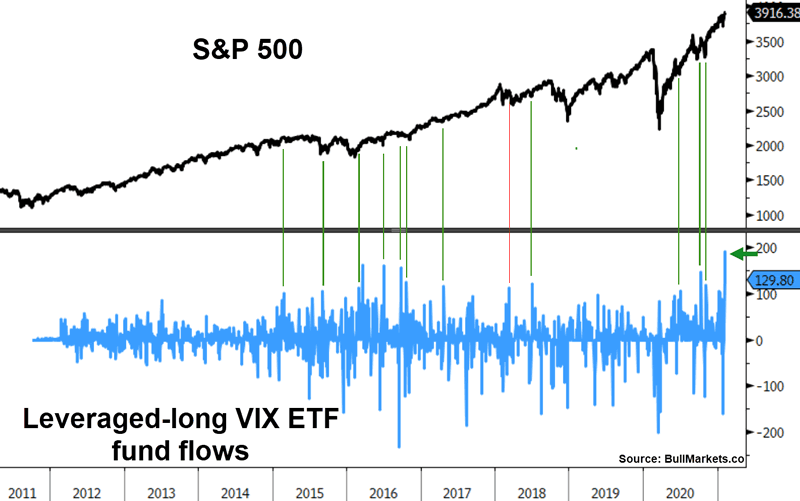
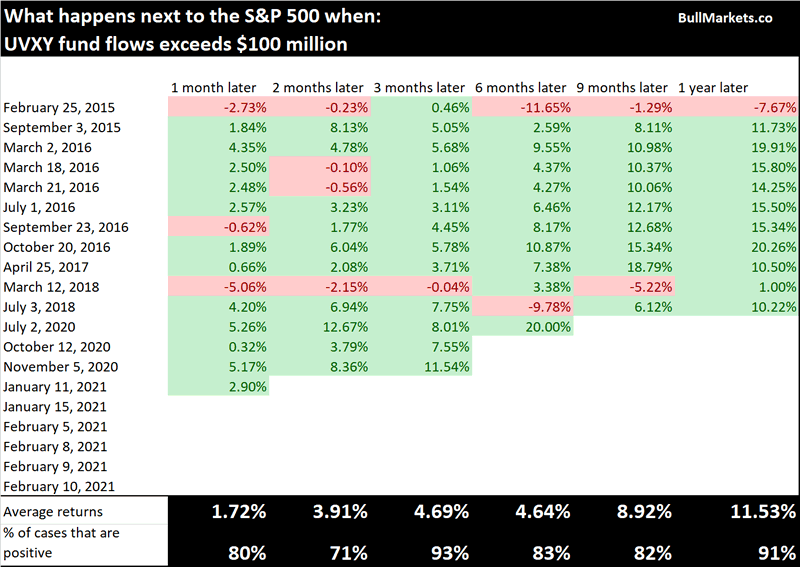
Such strong inflows typically occurred after a VIX spike. Since VIX spikes when stocks fall, the S&P usually rallied higher over the next 3 months:
Bonds
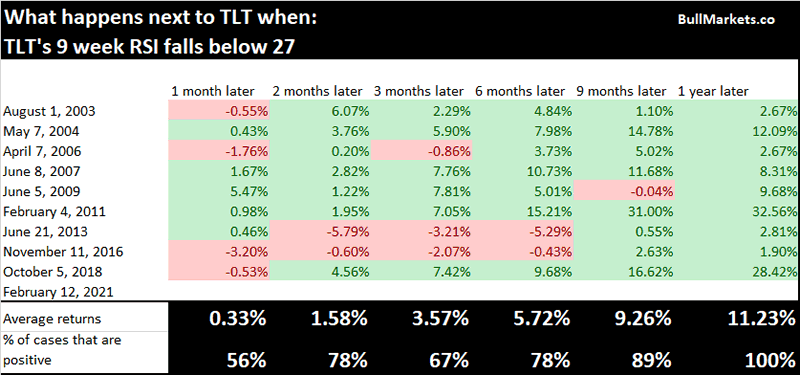
Rising interest rates are pushing bond prices down. The Treasury Bond ETF TLT’s 9 week RSI is extremely low:
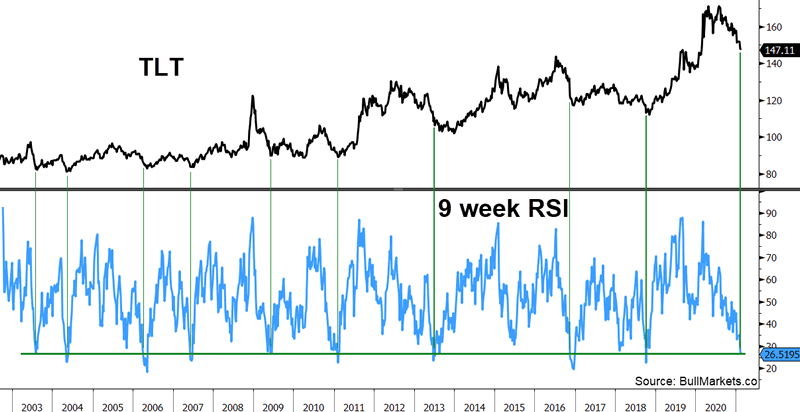
TLT could fall a little further over the next few months, but historically this was bullish over the next 9-12 months:
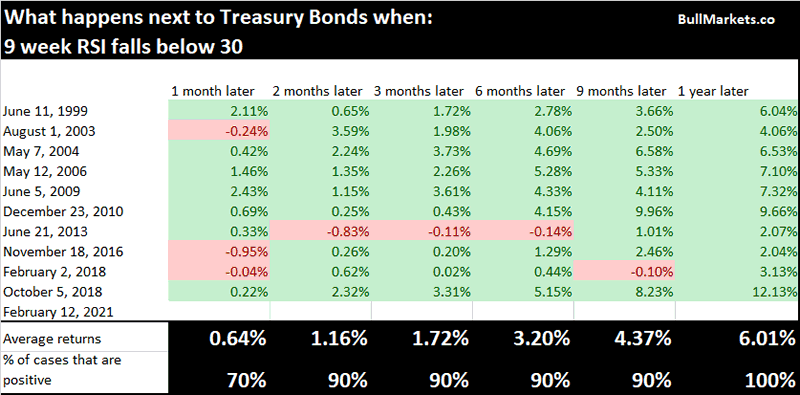
TLT’s historical data is limited. The Bloomberg Barclays U.S. Treasury Bond Index has more historical data. Once again, this was bullish for Treasury bonds:
Correlation
Plenty of traders have compared the S&P 500 over the past year to 1999, 2009, 1987, or (insert random year here). From a statistical point of view, the S&P 500 over the past year is most correlated to these other 1 year periods in history:
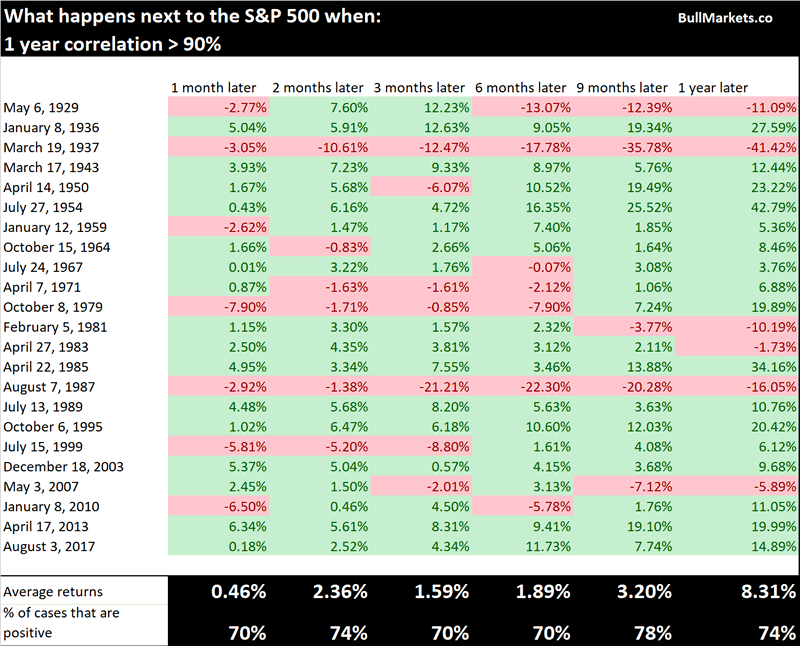
These historical cases saw a slightly greater than average chance of the S&P pushing higher over the next 2 months:
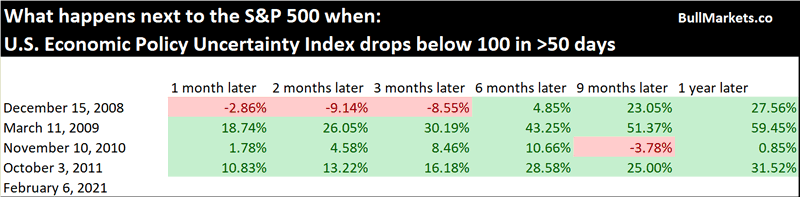
Falling economic uncertainty
As I noted on Tuesday, economic & policy uncertainty in the U.S. is decreasing:
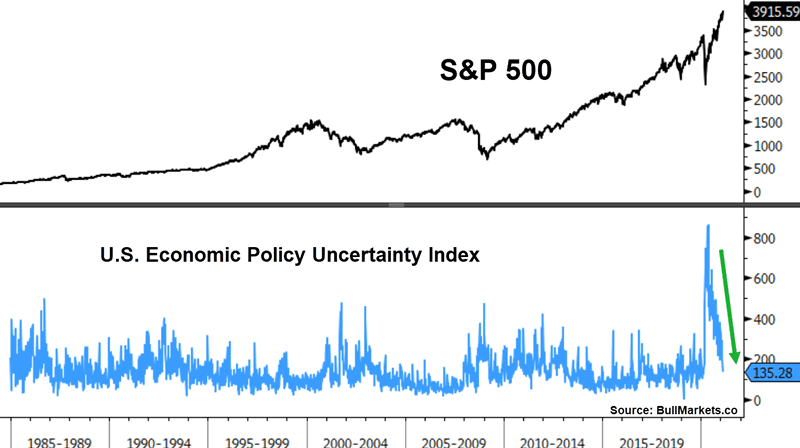
The Uncertainty Index has dropped below 100 for the first time in almost a year. Historically, long periods of high (but easing) uncertainty led to more gains for stocks:
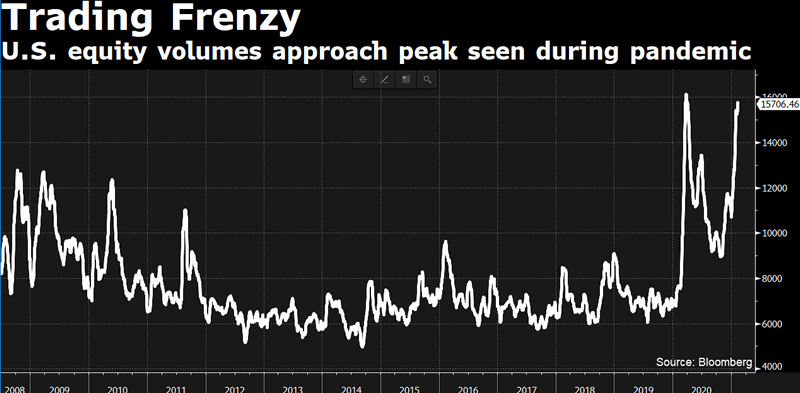
Rampant trading & speculation
Now that we’ve covered the bullish signs, let’s look at the bearish signs. It’s not hard to see signs of extreme risk taking.
U.S. equity volume has surged to its March 2020 highs. The only difference? Volume surged in March 2020 as stocks crashed (which is normal). Volume is surging today as stocks rally. Typically, volume goes up in a crash and volume goes down in a rally.
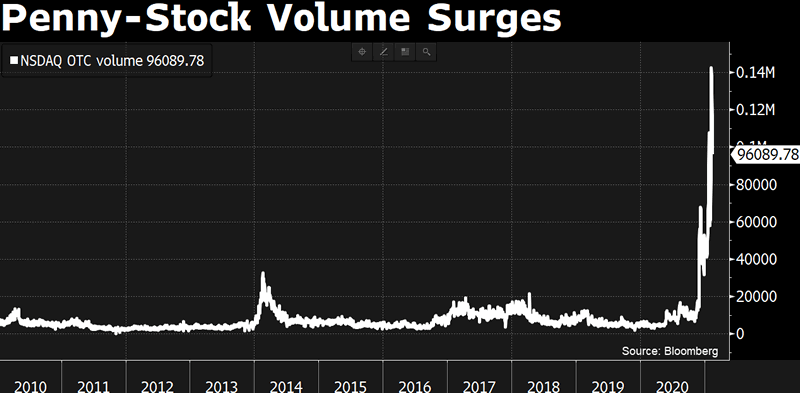
This volume is flowing into highly speculative names:
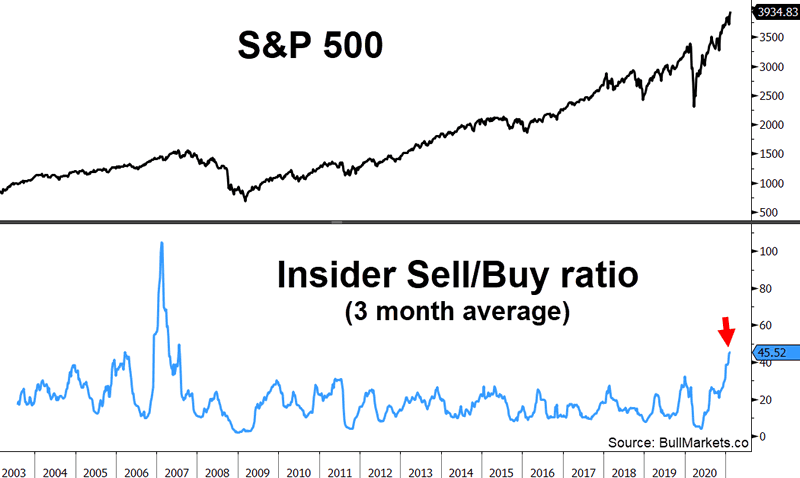
So while traders and small speculators bet on more gains, corporate insiders are using this once-in-a-decade opportunity to cash out:
Conclusion: market outlook
How do we reconcile the disparity between these two opposing forces? (extremely bullish momentum vs. extremely bearish excess)
There’s no black-and-white answer. Instead of relying on a definitive answer, my approach is diversify my portfolio into 3 strategies. Diversification reduces volatility in one’s aggregate portfolio.
- Long term portfolios should be highly defensive right now. This speculative bull market may last another 6 months or even 9 months, but stocks are a poor investment on a 3-5 year time frame. There are better opportunities in other markets (e.g. private markets).
- Medium term portfolios should go neither long nor short since risk:reward favors neither side. Extreme speculation can always become more extreme, but the risks are also staggering.
- Short term trend-focused portfolios should continue to ride the bull trend because no one knows exactly when it will end.
By Troy Bombardia
Copyright 2021 © Troy Bombardia - All Rights Reserved
Disclaimer: The above is a matter of opinion provided for general information purposes only and is not intended as investment advice. Information and analysis above are derived from sources and utilising methods believed to be reliable, but we cannot accept responsibility for any losses you may incur as a result of this analysis. Individuals should consult with their personal financial advisors.
© 2005-2022 http://www.MarketOracle.co.uk - The Market Oracle is a FREE Daily Financial Markets Analysis & Forecasting online publication.