


Gold: High Time to Move Out of the Penthouse
Commodities / Gold and Silver 2021 Jul 13, 2021 - 10:21 AM GMTBy: P_Radomski_CFA

Gold’s days in a glamorous apartment at the top of the PMs’ building are numbered. We’d better prepare for a rapid elevator ride to the first floor.
The Gold Miners
With the gold miners essentially running laps on the treadmill, the HUI Index, the GDX ETF, and the GDXJ ETF are working extremely hard but making little progress. And with the gambit resulting in ‘one step forward, two steps back,’ frustrating exhaustion has mining stocks questioning their every move. To that point, even though the trio transitioned from the conveyor belt to the stairs in recent weeks, history shows that slow climbs often culminate with elevator rides lower. Should we expect a different outcome this time around?
Gold ended the week in the green (up by $27.30), but the HUI Index was stuck in the red (down by 1.39). This is extremely noteworthy, as a similar divergence occurred at the end of May. For context, when the yellow metal rallied by $28.60 in a week back then, the HUI Index fell by 1.37 index points.
In the following weeks, the HUI Index declined by about 50 index points, while gold declined by about $150.
And with the ominous imbalance preceding the pair’s precipitous declines, again, should we expect a different outcome this time around?
Please see below:
To explain, with the HUI Index unable to muster any meaningful relief rallies, I warned that the recent plunge was weeks in the making:
I wrote the following about the week beginning on May 24:
What happened three weeks ago was that gold rallied by almost $30 ($28.60) and at the same time, the HUI – a flagship proxy for the gold stocks… Declined by 1.37. In other words, gold stocks completely ignored gold’s gains. That shows exceptional weakness on the weekly basis and is a very bearish sign for the following weeks.
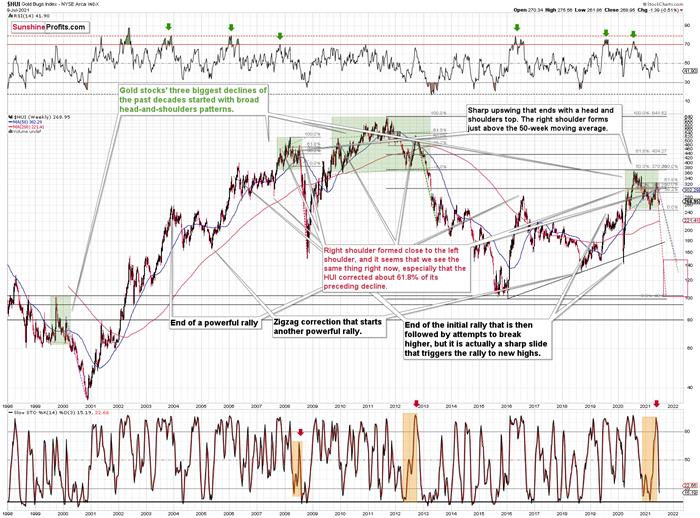
To that point, with the HUI Index’s ominous signals only increasing, if history rhymes (as it tends to), medium-term support will likely materialize in the 100-to-150 range. For context, high-end 2020 support implies a move back to 150, while low-end 2015 support implies a move back to 100. And yes, it could really happen, even though such predictions seem unthinkable.
Furthermore, with the junior miners often suffering the most during medium-term drawdowns, short positions in the GDXJ ETF will likely offer the best risk-reward ratio. For context, if you held firm in 2008 and 2013 and maintained your short positions, you almost certainly realized substantial profits. And while there are instances when it’s wise to exit one’s short positions, the prospect of missing out on the forthcoming slide makes it quite risky.
Even more bearish, a drastic underperformance by the HUI Index also preceded the bloodbath in 2008. To explain, right before the huge slide in late September and early October, gold was still moving to new intraday highs; the HUI Index was ignoring that, and then it declined despite gold’s rally. However, it was also the case that the general stock market suffered materially. If stocks didn’t decline back then so profoundly, gold stocks’ underperformance relative to gold would have likely been present but more moderate.
Nonetheless, the HUI Index’s bearish head-and-shoulders pattern is already sounding the alarm. When the HUI Index retraced a bit more than 61.8% of its downswing in 2008 and in between 50% and 61.8% of its downswing in 2012 before eventually rolling over, in both (2008 and 2012) cases, the final top – the right shoulder – formed close to the price where the left shoulder topped. And in early 2020, the left shoulder topped at 303.02. Thus, three of the biggest declines in the mining stocks (I’m using the HUI Index as a proxy here), all started with broad, multi-month head-and-shoulders patterns. And in all three cases, the size of the declines exceeded the size of the head of the pattern.
In addition, when the HUI Index peaked on Sep. 21, 2012, that was just the initial high in gold. At that time, the S&P 500 was moving back and forth with lower highs. And what was the eventual climax? Well, gold made a new high before peaking on Oct. 5. In conjunction, the S&P 500 almost (!) moved to new highs, and despite bullish tailwinds from both parties, the HUI Index didn’t reach new heights. The bottom line? The similarity to how the final counter-trend rally ended in 2012 (and to a smaller extent in 2008) remains uncanny.
As a result, we’re confronted with two bearish scenarios:
- If things develop as they did in 2000 and 2012-2013, gold stocks are likely to bottom close to their early-2020 low.
- If things develop like in 2008 (which might be the case, given the extremely high participation of the investment public in the stock market and other markets), gold stocks could re-test (or break slightly below) their 2016 low.
Keep in mind though: scenario #2 most likely requires equities to participate. In 2008 and 2020, sharp drawdowns in the HUI Index coincided with significant drawdowns of the S&P 500. However, with the Fed turning hawkish and investors extremely allergic to higher interest rates, the likelihood of a three-peat remains relatively high.
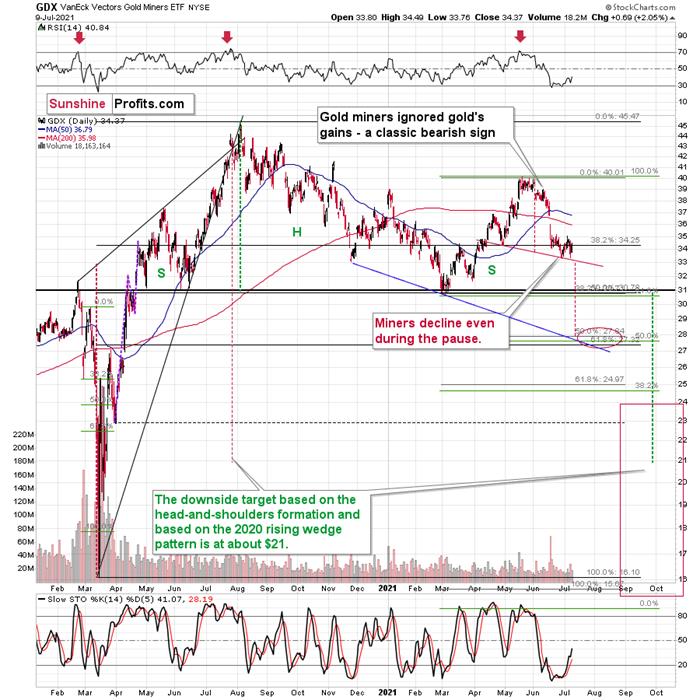
As further evidence, let’s analyze the behavior of the GDX ETF and the GDXJ ETF. Regarding the former, the senior miners celebrated gold’s strength by falling to their previous lows on Jul. 8. If this is not a shocking proof of extreme underperformance, then I don’t know what would be one.
Please see below:
Regarding the latter, on Jun. 29 (the June low), the GDXJ ETF closed at $45.83. And on Jul. 8, it closed at $45.53. Ladies and gentlemen, we had a breakdown.
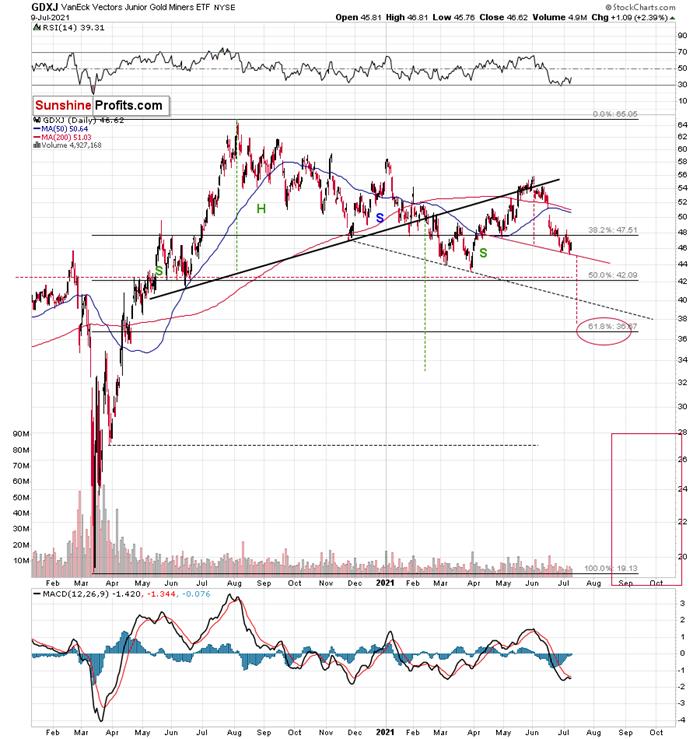
Of course, we see that the breakdown was invalidated, but the fact that it moved to new lows while gold rallied is extremely bearish. It seems like the junior miners simply can’t wait to break to new lows.
The bottom line?
If gold repeats its June slide, it will decline by about $150. Taking the entire decline into account (since August 2020), for every $1 that gold fell, on average, the GDX was down by about 4 cents (3.945 cents) and GDXJ was down by about 6.5 cents (6.504 cents).
This means that if gold was to fall by about $150 and miners declined just as they did so far in the past year (no special out- or underperformance), they would be likely to fall by $5.92 (GDX) and $9.76 (GDXJ). Given the Jul. 8 closing prices, this would imply price moves to $27.76 (GDX) and $35.78 (GDXJ). So, the profits on the current short position are likely to soar.
In conclusion, while the HUI Index, the GDX ETF and the GDXJ ETF are likely to have some small breathers along the way, their sprints lower are likely far from finished. When we combine their extreme underperformance relative to gold with the bearish 2008 and 2012 analogues, the gold miners might just huff and puff and blow their own houses down. As a result, while 2021 has already delivered two desperate pleas for more oxygen, the trio will likely require a third ventilator in the coming months. The outlook for the following weeks remains very bearish.
Today's article is a small sample of what our subscribers enjoy on a daily basis. They know about both the market changes and our trading position changes exactly when they happen. Apart from the above, we've also shared with them the detailed analysis of the miners and the USD Index outlook. Check more of our free articles on our website, including this one – just drop by and have a look. We encourage you to sign up for our daily newsletter, too - it's free and if you don't like it, you can unsubscribe with just 2 clicks. You'll also get 7 days of free access to our premium daily Gold & Silver Trading Alerts to get a taste of all our care. Sign up for the free newsletter today!
Thank you.
Przemyslaw Radomski, CFA
Founder, Editor-in-chief
Tools for Effective Gold & Silver Investments - SunshineProfits.com
Tools für Effektives Gold- und Silber-Investment - SunshineProfits.DE
* * * * *
About Sunshine Profits
Sunshine Profits enables anyone to forecast market changes with a level of accuracy that was once only available to closed-door institutions. It provides free trial access to its best investment tools (including lists of best gold stocks and best silver stocks), proprietary gold & silver indicators, buy & sell signals, weekly newsletter, and more. Seeing is believing.
Disclaimer
All essays, research and information found above represent analyses and opinions of Przemyslaw Radomski, CFA and Sunshine Profits' associates only. As such, it may prove wrong and be a subject to change without notice. Opinions and analyses were based on data available to authors of respective essays at the time of writing. Although the information provided above is based on careful research and sources that are believed to be accurate, Przemyslaw Radomski, CFA and his associates do not guarantee the accuracy or thoroughness of the data or information reported. The opinions published above are neither an offer nor a recommendation to purchase or sell any securities. Mr. Radomski is not a Registered Securities Advisor. By reading Przemyslaw Radomski's, CFA reports you fully agree that he will not be held responsible or liable for any decisions you make regarding any information provided in these reports. Investing, trading and speculation in any financial markets may involve high risk of loss. Przemyslaw Radomski, CFA, Sunshine Profits' employees and affiliates as well as members of their families may have a short or long position in any securities, including those mentioned in any of the reports or essays, and may make additional purchases and/or sales of those securities without notice.
Przemyslaw Radomski Archive |
© 2005-2022 http://www.MarketOracle.co.uk - The Market Oracle is a FREE Daily Financial Markets Analysis & Forecasting online publication.