


Global Stock Markets Topped 60 Days Before the US Stocks Peaked
Stock-Markets / Stock Market 2021 Sep 23, 2021 - 03:02 PM GMTBy: Chris_Vermeulen

In the first part of this research article, I highlighted a number of factors and technical charts that suggest the true peak in the US/Global markets happened in April/May 2021. Although the US markets continued to trend higher after that peak, the global markets, as well as a number of key indicators, suggested the bullish price trend had reached a peak and started to weaken after the April/May 2021 peak.
My assumption is this data shows the markets entered a highly speculative phase of trading after the November 2020 elections. History shows us that the 12+ months prior to a US Presidential election are usually filled with uncertainty and sideways market volatility. Then, just after the US Presidential election is completed, the markets usually enter into a trending phase related to the expectations and promises of the newly elected US President. 2020 was no different in this process. What was different was the fact that the US Federal Reserve was still pouring trillions into supporting the post-COVID global economic recovery. So this post US Presidential election rally may have become a super-charged speculative rally phase with the US Fed backing the trends.
Be sure to sign up for our free market trend analysis and signals now so you don’t miss our next special report!
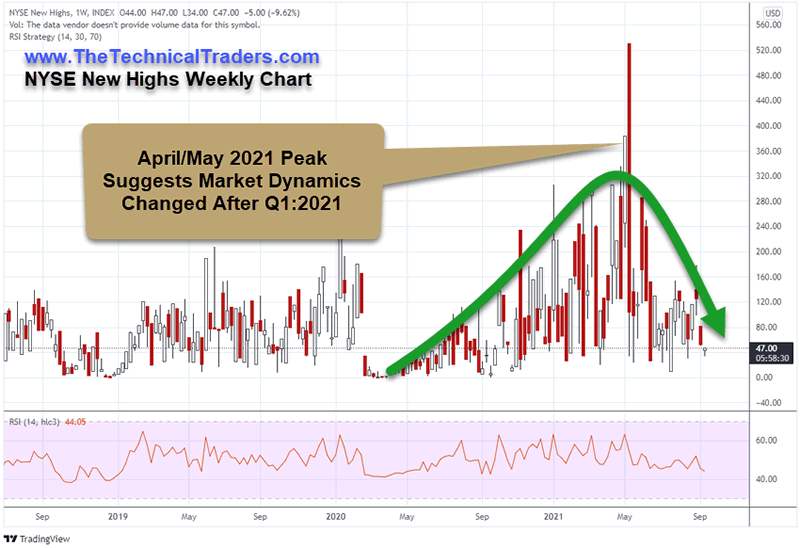
The one key chart this highlights the April/May 2021 peak is the Weekly NYSE New Highs. The data on this chart suggests the NYSE moved into a period of hyper-bullish trending near the end of 2020 and continued to push to extreme highs in April/May 2021. After the peak level on this chart, in early May 2021, the NYSE new highs collapsed by more than 80% in less than 15 days. This represents an incredible reversal of sentiment for traders/investors at a time when the US stock market had just completed Q1:2021 earnings updates. Almost as if traders/investors decided “that’s it, the party’s over.” and started pulling assets away from the markets to protect profits.
In the first part of this research article, we suggested reviewing a few of our earlier research posts to get a better understand of how this market trend set up. I’ll share them here:
- November 27, 2020: HOW TO SPOT THE END OF AN EXCESS PHASE – PART II
- May 20, 2021: BITCOIN COMPLETES PHASE #3 OF EXCESS PHASE TOP PATTERN – WHAT NEXT?
- May 23, 2021: US DOLLAR BREAKS BELOW 90 – CONTINUE TO CONFIRM DEPRECIATION CYCLE PHASE
Most importantly, this research article highlights the transition into the new Depreciation Price Cycle and the fact that it should last until 2029 to 2031.
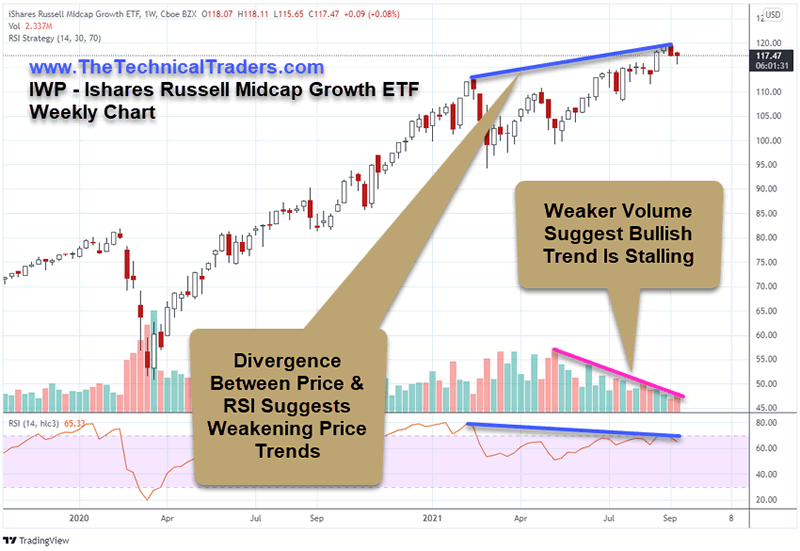
Moving onto current market charts and setups, we want to focus your attention on the IWP, Russell Midcap Growth ETF, Weekly chart, and the weakening market trend and price pattern that was set up recently. Not only are we seeing very weak volume in a bullish price trend pushing to new all-time highs, but we are also seeing a divergence between price and the RSI indicator suggesting this current peak is actually setting up as a potential FINAL peak in trend.
The Russell MidCap Growth ETF is uniquely positioned to reflect moderate price trending, potentially before the S&P or NASDAQ, because it reflects a broad swath of the market in terms of types of companies and a variety of industries/services. Watching the setups in the MidCaps and/or the Russell 2000 can often provide insight to major market trends and setups that are not evident in the NASDAQ or S&P 500. This is because many traders focus assets and perceptions into the US major indexes at a greater scale – often ignoring what is taking place in the Russell 2000 or the Russell Midcap Growth ETF. Therefore, we can often see a different perspective by watching these outlier symbols and price setups.
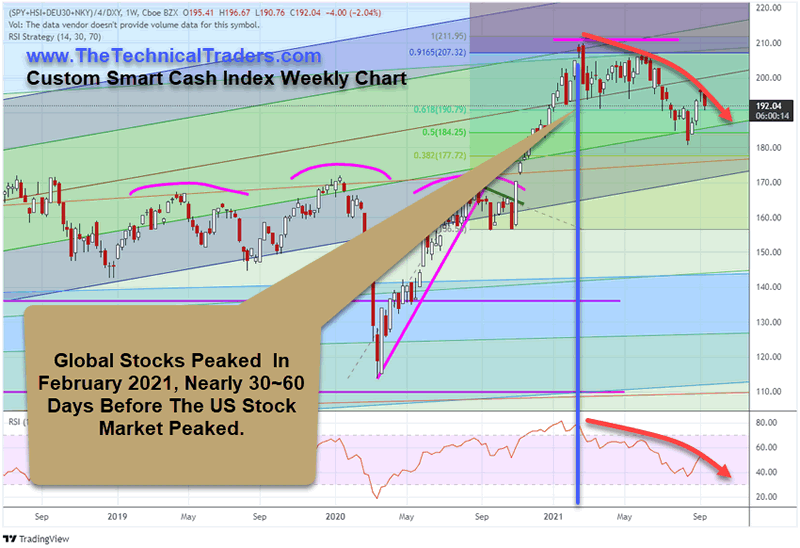
Our Custom Smart Cash Index Weekly chart presents a very clear image of the peak in April/Pay 2021 and also presents a very clear downside price rotation in the US/Global markets after that peak. We’ve drawn a BLUE LINE showing the April/May peak and a RED ARROW showing how this Custom Smart Cash Index has declined over the past 5+ months. The strength of the decline in price on this chart seems completely opposite to the rally on the IWP chart (above). How could the US/Global markets be representing moderate price weakness on the Custom Smart Cash Index chart, while still showing moderate bullish price trending on the IWP chart?
My interpretation of these two charts, in combination with the chart I shared in the first part of this research article, suggests the US and global markets were diverging in trend. While the US markets continued to push higher and higher, as traders continued to chase the bullish price expectations related to US economic strength and recovery, the global markets and the internal dynamics of this bullish price trend had completely diverged from the trends we were seeing in the US major indexes. Almost like the momentum of a slowing train – the US markets continued to trend higher while the true momentum of the markets showed a downward price trend was already taking place.
At some point in the near future, this diverging price trend is going to push the US markets lower or the global markets will find eventual support and attempt to climb higher. This divergence suggests the US markets were acting in a manner that is counter to the global market trends – which was likely the result of the US Federal Reserve continuing to support the markets with asset-buying programs and expectations the US government would step into ease COVID related economic concerns.
The reality of the current market environment is that these continued US Federal Reserve and US Government efforts to support the US economy can’t and won’t last forever. Eventually, the US and global markets need to function on real economic data and processes. The end of the extreme support efforts will likely cause the markets to revert towards more true valuation levels and potentially prompt a breakdown in this extended bullish price trend.
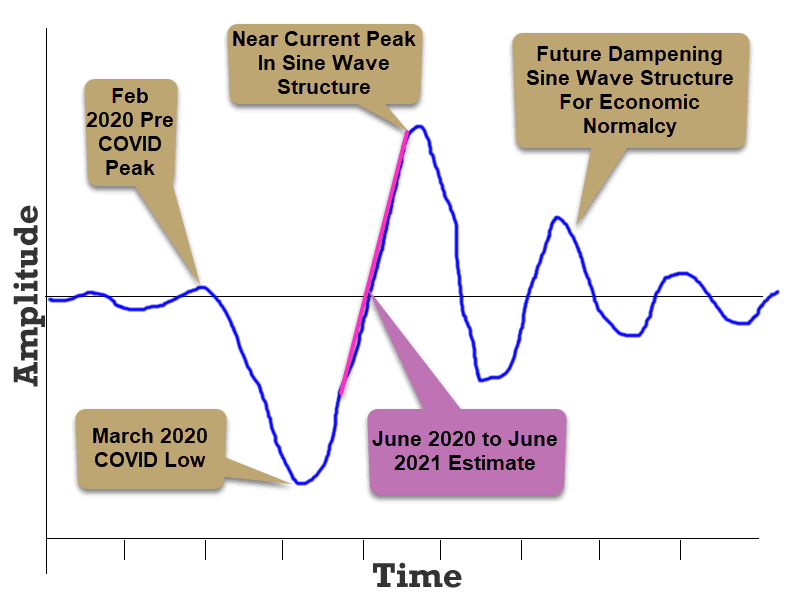
I’ve warned about this many times over the past few months with various research articles and my expectations that a post-COVID diminishing Sine Wave structure would present a rolling, sometimes volatile, series of future economic data points throughout the world. As the markets attempt to return to normal economic functions, excessive credit and debt within the global markets will become an issue.
Rolling economic data points will present some very interesting and concerning forward guidance for traders and investors. We’ve seen incredibly positive economic data points over the past 5+ months because of the COVID-19 collapse in the global economy. These extreme rally higher will certainly be followed by a reversion process over the next few months. Eventually, the global markets will be forced to transition to more normal market dynamic processes – which may represent a moderately large price reversion event in the near future.
As a technical trader, I love being able to share these unique and informative research articles with you. I see the markets continuing to have extended volatility over the next 24+ months with the potential for big rallies and pullbacks taking place. As much as that may scare some people, I see it as an incredible opportunity for big profits.
Big trends and increased volatility in a post-COVID normalization of the global economy are going to allow the markets to revalue and restore assets in a way that will provide an incredible growth phase for the markets (eventually). As I’ve explained in previous articles, the COVID-19 disruption was a major disruption to the global market economic process. It was big and disrupted nearly every economy on the planet. Now, in a post-COVID world, the markets will digest the extreme stimulus and support that has pushed most indexes higher over time and revert back to more normal economic functions. Eventually, all of this new capitalization and support will settle into proper economic purpose – driving a massive growth of global GDP (much like what happened after WWII). When we get to that point, we should see a massive growth phase in the global markets that may last 15+ years or more.
Please take a minute to learn about my BAN Trader Pro newsletter service and how it can help you identify and trade better sector setups. My team and I have built this strategy to help us identify the strongest and best trade setups in any market sector. Every day, we deliver these setups to our subscribers along with the BAN Trader Pro system trades. You owe it to yourself to see how simple it is to trade 30% to 40% of the time to generate incredible results.
As something entirely new, check out my initiative URLYstart to learn more about the youth entrepreneurship program I am developing. This is an online program of gamified entrepreneurship designed to introduce and inspire youth to start their own businesses. Click-by-click, each student will be guided from their initial idea, through the startup process all the way to their first sale and beyond. Along the way, our students will learn life lessons such as communication, perseverance, goal setting, teamwork, and more. My team and I are passionate about this project and want to reach as many people as possible!
Have a great day!
Chris Vermeulen
www.TheTechnicalTraders.com
Chris Vermeulen has been involved in the markets since 1997 and is the founder of Technical Traders Ltd. He is an internationally recognized technical analyst, trader, and is the author of the book: 7 Steps to Win With Logic
Through years of research, trading and helping individual traders around the world. He learned that many traders have great trading ideas, but they lack one thing, they struggle to execute trades in a systematic way for consistent results. Chris helps educate traders with a three-hour video course that can change your trading results for the better.
His mission is to help his clients boost their trading performance while reducing market exposure and portfolio volatility.
He is a regular speaker on HoweStreet.com, and the FinancialSurvivorNetwork radio shows. Chris was also featured on the cover of AmalgaTrader Magazine, and contributes articles to several leading financial hubs like MarketOracle.co.uk
Disclaimer: Nothing in this report should be construed as a solicitation to buy or sell any securities mentioned. Technical Traders Ltd., its owners and the author of this report are not registered broker-dealers or financial advisors. Before investing in any securities, you should consult with your financial advisor and a registered broker-dealer. Never make an investment based solely on what you read in an online or printed report, including this report, especially if the investment involves a small, thinly-traded company that isn’t well known. Technical Traders Ltd. and the author of this report has been paid by Cardiff Energy Corp. In addition, the author owns shares of Cardiff Energy Corp. and would also benefit from volume and price appreciation of its stock. The information provided here within should not be construed as a financial analysis but rather as an advertisement. The author’s views and opinions regarding the companies featured in reports are his own views and are based on information that he has researched independently and has received, which the author assumes to be reliable. Technical Traders Ltd. and the author of this report do not guarantee the accuracy, completeness, or usefulness of any content of this report, nor its fitness for any particular purpose. Lastly, the author does not guarantee that any of the companies mentioned in the reports will perform as expected, and any comparisons made to other companies may not be valid or come into effect.
Chris Vermeulen Archive |
© 2005-2022 http://www.MarketOracle.co.uk - The Market Oracle is a FREE Daily Financial Markets Analysis & Forecasting online publication.