


Financial Markets and Economy Outlook 2009, Inflation / Deflation
Economics / Recession 2008 - 2010 Apr 20, 2009 - 10:00 PM GMTBy: John_Mauldin

 There is a reason I call this column Outside the Box. I try to get material that forces us to think outside our normal comfort zones and challenges our common assumptions. And this week's letter does just that. I have made the comment more than once that is it unusual for two major bubbles to burst and for the conversation and our experience to be rising inflation and not a serious problem with deflation.
Van Hoisington and Dr. Lacy Hunt give us a seminar on why they think it is deflation that will ultimately be the problem and not inflation we are dealing with today. This week's letter requires you to think, but it will be worth the effort.
Now, if you put all of the various inputs together, Hoisington and Hunt show that theory suggests we will soon be dealing with deflation. It's counter- intuitive to what we hear today, which is why the Bank for International Settlements used the stagflation word in a recent report. The transition that is coming will not be comfortable.
Hoisington Investment Management Company (www.hoisingtonmgt.com) is a registered investment advisor specializing in fixed income portfolios for large institutional clients. Located in Austin, Texas, the firm has over $4-billion under management, composed of corporate and public funds, foundations, endowments, Taft-Hartley funds, and insurance companies. And their track record over the last 20 years suggests we should pay attention. And now let's jump right in to the essay.
John Mauldin, Editor
Outside the Box
Quarterly Review and Outlook - First Quarter 2009
by Van Hoisington and Dr. Lacy Hunt
Inflation/Deflation
Over the next decade, the critical element in any investment portfolio will be the correct call regarding inflation or its antipode, deflation. Despite near term deflation risks, the overwhelming consensus view is that "sooner or later" inflation will inevitably return, probably with great momentum. This inflationist view of the world seems to rely on two general propositions. First, the unprecedented increases in the Fed's balance sheet are, by definition, inflationary. The Fed has to print money to restore health to the economy, but ultimately this process will result in a substantially higher general price level. Second, an unparalleled surge in federal government spending and massive deficits will stimulate economic activity. This will serve to reinforce the reflationary efforts of the Fed and lead to inflation.
These propositions are intuitively attractive. However, they are beguiling and do not stand the test of history or economic theory. As a consequence, betting on inflation as a portfolio strategy will be as bad a bet in the next decade as it has been over the disinflationary period of the past twenty years when Treasury bonds produced a higher total return than common stocks. This is a reminder that both stock and Treasury bond returns are sensitive to inflation, albeit with inverse results.
Economic Theory
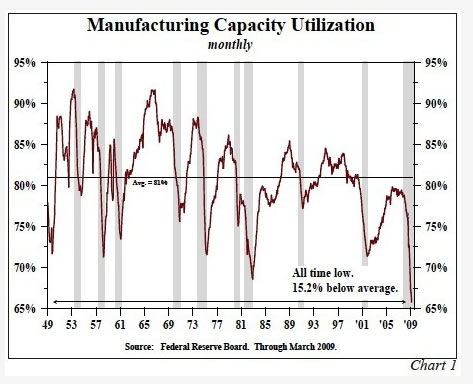
If inflation and interest rates were to rise in this recession, or in the early stages of a recovery, the expansion would be cut short and the economy would either remain in, or relapse into recession. In late stages of economic downturns, substantial amounts of unutilized labor and other resources exist. Thus, both factory utilization and unemployment rates lag other economic indicators. For instance, reflecting this severe recession, unused labor and other productive resources have increased sharply. The yearly percentage decline in household employment is the largest since current data series began in 1949. In March the unemployment rate stood at 8.5%, up from a cyclical low of 4.4%. This is the highest level since the early 1980s. The labor department's broader U6 unemployment rate includes those less active in the labor markets and working part time because full time work is not available. The U6 rate of 15.6% in March was the highest in the 15 year history of the series and up from its cyclical low of 7.9%. The operating rate for all industries and manufacturing both fell to their lowest levels on record in March. Manufacturing capacity was around 15% below the sixty year average (Chart 1). Given these conditions, let's assume for the moment that inflation rises immediately. With unemployment widespread, wages would seriously lag inflation. Thus, real household income would decline and truncate any potential gain in consumer spending.
A technically superior and more complete method of capturing the concept of excess labor and capacity is the Aggregate Supply and Demand Curve (Chart 2). Inflation will not commence until the Aggregate Demand (AD) Curve shifts outward sufficiently to reach the part of the Aggregate Supply (AS) curve that is upward sloping. The AS curve is perfectly elastic or horizontal when substantial excess capacity exists. Excess capacity causes firms to cut staff, wages and other costs. Since wage and benefit costs comprise about 70% of the cost of production, the AS curve will shift outward, meaning that prices will be lower at every level of AD. Therefore, multiple outward shifts in the Aggregate Demand curve will be required before the economy encounters an upward sloping Aggregate Supply Curve thus creating higher price levels. In our opinion such a process will take well over a decade.
Record Expansion of the Fed's Balance Sheet and M2
In the past year, the Fed's balance sheet, as measured by the monetary base, has nearly doubled from $826 billion last March to $1.64 trillion, and potentially larger increases are indicated for the future. The increases already posted are far above the range of historical experience. Many observers believe that this is the equivalent to printing money, and that it is only a matter of time until significant inflation erupts. They recall Milton Friedman's famous quote that "inflation is always and everywhere a monetary phenomenon."
These gigantic increases in the monetary base (or the Fed's balance sheet) and M2, however, have not led to the creation of fresh credit or economic growth. The reason is that M2 is not determined by the monetary base alone, and GDP is not solely determined by M2. M2 is also determined by factors the Fed does not control. These include the public's preference for checking accounts versus their preference for holding currency or time and saving deposits and the bank's needs for excess reserves. These factors, beyond the Fed's control, determine what is known as the money multiplier. M2 is equal to the base times the money multiplier. Over the past year total reserves, now 50% of the monetary base, increased by about $736 billion, but excess reserves went up by nearly as much, or about $722 billion, causing the money multiplier to fall (Chart 3). Thus, only $14 billion, or a paltry 1.9% of the massive increase of total reserves, was available to make loans and investments. Not surprisingly, from December to March, bank loans fell 5.4% annualized. Moreover, in the three months ended March, bank credit plus commercial paper posted a record decline.
If this all sounds complicated you are right, it is. The bottom line, however, is that it is totally incorrect to assume that the massive expansion in reserves created by the Fed is inflationary. Economic activity cannot move forward unless credit expansion follows reserves expansion. That is not happening. Too much and poorly financed debt has rendered monetary policy ineffective.
What about the M2 Surge?
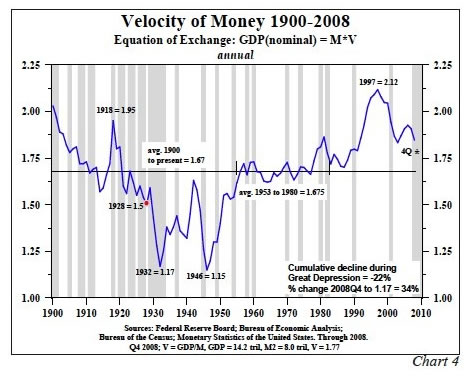
M2 has increased by over a 14% annual rate over the past six months, which is in the vicinity of past record growth rates. Liquidity creation or destruction, in the broadest sense, has two components. The first is influenced by the Fed and its allies in the banking system, and the second is outside the banking system in what is often referred to as the shadow banking system. The equation of exchange (GDP equals M2 multiplied by the velocity of money or V) captures this relationship. The statement that all the Fed has to do is print money in order to restore prosperity is not substantiated by history or theory. An increase in the stock of money will only lead to a higher GDP if V, or velocity, is stable. V should be thought of conceptually rather than mechanically. If the stock of money is $1 trillion and total spending is $2 trillion, then V is 2. If spending rises to $3 trillion and M2 is unchanged, velocity then jumps to 3. While V cannot be observed without utilizing GDP and M, this does not mean that the properties of V cannot be understood and analyzed.
The historical record indicates that V may be likened to a symbiotic relationship of two variables. One is financial innovation and the other is the degree of leverage in the economy. Financial innovation and greater leverage go hand in hand, and during those times velocity is generally above its long-term average of 1.67 (Chart 4). Velocity was generally below this average when there was a reversal of failed financial innovation and deleveraging occurred. When innovation and increased leveraging transpired early in the 20th century, velocity was generally above the long-term average. After 1928 velocity collapsed, and remained below the average until the early 1950s as the economy deleveraged. From the early 1950s through 1980 velocity was relatively stable and never far from 1.67 since leverage was generally stable in an environment of tight financial regulation.
Since 1980, velocity was well above 1.67, reflecting rapid financial innovation and substantially greater leverage. With those innovations having failed miserably, and with the burdensome side of leverage (i.e. falling asset prices and income streams, but debt remaining) so apparent, velocity is likely to fall well below 1.67 in the years to come, compared with a still high 1.77 in the fourth quarter of 2008. Thus, as the shadow banking system continues to collapse, velocity should move well below its mean, greatly impairing the efficacy of monetary policy. This means that M2 growth will not necessarily be transferred into higher GDP. For example, in Q4 of 2008 annualized GDP fell 5.8% while M2 expanded by 15.7%. The same pattern appears likely in Q1 of this year.
The highly ingenious monetary policy devices developed by the Bernanke Fed may prevent the calamitous events associated with the debt deflation of the Great Depression, but they do not restore the economy to health quickly or easily. The problem for the Fed is that it does not control velocity or the money created outside the banking system.
Washington policy makers are now moving to increase regulation of the banks and nonbank entities as well. This is seen as necessary as a result of the excessive and unwise innovations of the past ten or more years. Thus, the lesson of history offers a perverse twist to the conventional wisdom. Regulation should be the tightest when leverage is increasing rapidly, but lax in the face of deleveraging.
Are Massive Budget Deficits Inflationary?
Based on the calculations of the Congressional Budget Office, U.S. Government Debt will jump to almost 72% of GDP in just four fiscal years. As such, this debt ratio would advance to the highest level since 1950 (Chart 5). The conventional wisdom is that this will restore prosperity and higher inflation will return. Contrarily, the historical record indicates that massive increases in government debt will weaken the private economy, thereby hindering rather than speeding an economic recovery. This does not mean that a recovery will not occur, but time rather than government action will be the curative factor.
By weakening the private economy, government borrowing is not an inflationary threat. Much light on this matter can be shed by examining Japan from 1988 to the 2008 and the U.S. from 1929 to 1941. In the case of Japan government debt to GDP ratio surged from 50% to almost 170%. So, if large increases in government debt were the key to economic prosperity, Japan would be in the greatest boom of all time. Instead, their economy is in shambles. After two decades of repeated disappointments, Japan is in the midst of its worst recession since the end of World War II. In the fourth quarter, their GDP declined almost twice as fast as that of the U.S. or the EU. The huge increase in Japanese government debt was created when it provided funds to salvage failing banks, insurance and other companies, plus transitory tax relief and make-work projects.
In 2008, after two decades of massive debt increases, the Nikkei 225 average was 77% lower than in 1989, and the yield on long Japanese Government Bonds was less than 1.5% (Chart 6). As the Government Debt to GDP ratio surged, interest rates and stock prices fell, reflecting the negative consequences of the transfer of financial resources from the private to the public sector (Chart 7). Thus, the fiscal largesse did not restore Japan to prosperity. The deprivation of private sector funds suggested that these policy actions served to impede, rather than facilitate, economic activity.
This recent Japanese experience mirrors U.S. history from 1929 to 1941 when the ratio of U.S. government debt to GDP almost tripled from 16% to near 50%. As the U.S. debt ratio rose, long Treasury yields moved lower, indicating that the private sector was hurt, not helped, by the government's efforts. The yearly low in long Treasury yields occurred at 1.95% in 1941, the last year before full WWII mobilization. In 1941, the S&P 500, despite some massive rallies in the 1930s, was 62% lower than in 1929, and had been falling since 1936. Thus, two distinct periods separated by country and considerable time indicate that stock prices respond unfavorably to massive government deficit spending and bond yields decline.
The U.S. economy finally recovered during WWII. Some attribute this recovery to a further increase in Federal debt which peaked at almost 109% of GDP. However, the dynamics during the War were much different than from those of 1929 through 1941 and today. The U.S. ran huge trade surpluses as we supplied military and other goods to allies, which served to lift the U.S. economy through a massive multiplier effect. Additionally, 10% of our population, or 12 million persons, were moved into military services. This is equivalent to 30 million people today. Also, mandatory rationing of goods was instituted and people were essentially forced to use an unprecedented portion of their income to buy U.S. bonds or other saving instruments. This unparalleled saving permitted the U.S. economy to recover from the massive debt acquired prior to 1929.
Bonds Still an Exceptional Value
Since the 1870s, three extended deflations have occurred--two in the U.S. from 1874-94 and from 1928 to 1941, and one in Japan from 1988 to 2008. All these deflations occurred in the aftermath of an extended period of "extreme over indebtedness," a term originally used by Irving Fisher in his famous 1933 article, "The Debt-Deflation Theory of Great Depressions." Fisher argued that debt deflation controlled all, or nearly all, other economic variables. Although not mentioned by Fisher, the historical record indicates that the risk premium (the difference between the total return on stocks and Treasury bonds) is also apparently controlled by such circumstances. Since 1802, U.S. stocks returned 2.5% per annum more than Treasury bonds, but in deflations the risk premium was negative. In the U.S. from 1874-94 and 1928-41, Treasury bonds returned 0.9% and 7% per annum, respectively, more than common stocks. In Japan's recession from 1988-2008, Treasury bond returns exceeded those on common stocks by an even greater 8.4%. Thus, historically, risk taking has not been rewarded in deflation. The premier investment asset has been the long government bond (Table 1).
This table also speaks to the impact of massive government deficit spending on stock and bond returns. In the U.S. from 1874-94, no significant fiscal policy response occurred. The negative consequences of the extreme over indebtedness were allowed to simply burn out over time. Discretionary monetary policy did not exist then since the U.S. was on the Gold Standard. The risk premium was not nearly as negative in the late 19th century as it was in the U.S. from 1928-41 and in Japan from 1988-2008 when the government debt to GDP ratio more than tripled in both cases. In the U.S. 1874-94, at least stocks had a positive return of 4.4%. In the U.S. 1928-41 and in Japan in the past twenty years, stocks posted compound annual returns of negative 2.4% and 2.3%, respectively. Therefore on a historical basis, U.S. Treasury bonds should maintain its position as the premier asset class as the U.S. economy struggles with declining asset prices, overindebtedness, declining income flows and slow growth.
Van R. Hoisington
Lacy H. Hunt, Ph.D.
By John Mauldin
John Mauldin, Best-Selling author and recognized financial expert, is also editor of the free Thoughts From the Frontline that goes to over 1 million readers each week. For more information on John or his FREE weekly economic letter go to: http://www.frontlinethoughts.com/learnmore
To subscribe to John Mauldin's E-Letter please click here:http://www.frontlinethoughts.com/subscribe.asp
Copyright 2008 John Mauldin. All Rights Reserved
John Mauldin is president of Millennium Wave Advisors, LLC, a registered investment advisor. All material presented herein is believed to be reliable but we cannot attest to its accuracy. Investment recommendations may change and readers are urged to check with their investment counselors before making any investment decisions. Opinions expressed in these reports may change without prior notice. John Mauldin and/or the staff at Millennium Wave Advisors, LLC may or may not have investments in any funds cited above. Mauldin can be reached at 800-829-7273.
Disclaimer PAST RESULTS ARE NOT INDICATIVE OF FUTURE RESULTS. THERE IS RISK OF LOSS AS WELL AS THE OPPORTUNITY FOR GAIN WHEN INVESTING IN MANAGED FUNDS. WHEN CONSIDERING ALTERNATIVE INVESTMENTS, INCLUDING HEDGE FUNDS, YOU SHOULD CONSIDER VARIOUS RISKS INCLUDING THE FACT THAT SOME PRODUCTS: OFTEN ENGAGE IN LEVERAGING AND OTHER SPECULATIVE INVESTMENT PRACTICES THAT MAY INCREASE THE RISK OF INVESTMENT LOSS, CAN BE ILLIQUID, ARE NOT REQUIRED TO PROVIDE PERIODIC PRICING OR VALUATION INFORMATION TO INVESTORS, MAY INVOLVE COMPLEX TAX STRUCTURES AND DELAYS IN DISTRIBUTING IMPORTANT TAX INFORMATION, ARE NOT SUBJECT TO THE SAME REGULATORY REQUIREMENTS AS MUTUAL FUNDS, OFTEN CHARGE HIGH FEES, AND IN MANY CASES THE UNDERLYING INVESTMENTS ARE NOT TRANSPARENT AND ARE KNOWN ONLY TO THE INVESTMENT MANAGER.
John Mauldin Archive |
© 2005-2022 http://www.MarketOracle.co.uk - The Market Oracle is a FREE Daily Financial Markets Analysis & Forecasting online publication.