Improving Economic Indicators as Housing Market Shows Signs of Stabilising
Economics / Recession 2008 - 2010 Apr 26, 2009 - 08:31 PM GMT Asha Bangalore (Northern Trust): Leading Index - continues to send message of weak economic conditions
“The Conference Board’s Index of Leading Indicators (LEI) dropped -0.3% in March 2009, after a revised 0.2% decline during February. The LEI posted the last increase in June 2008. On a year-to-year basis, the quarterly average of the LEI fell 3.8% after a 4.0% decline in the fourth quarter. The LEI appears to have established a bottom in the fourth quarter of 2008.
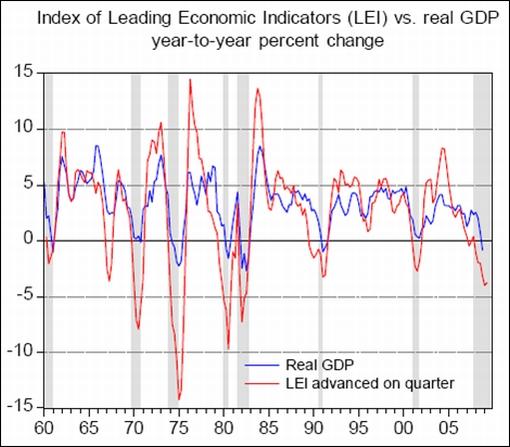
“The main message is that the LEI continue to point to weak economic conditions in the near term. More is required to declare that the economy is out of the woods.”
Source: Asha Bangalore, Northern Trust - Daily Global Commentary, April 20, 2009.
Asha Bangalore (Northern Trust): Chicago Fed National Activity Index shows a noteworthy improvement
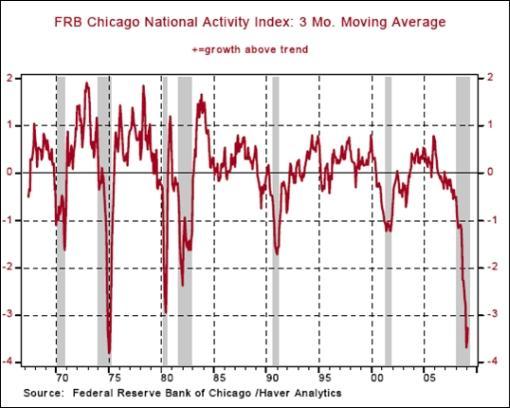
“The Chicago Fed National Activity Index (CFNAI) was -2.96 in March versus -2.82 in February. The 3-month moving average of the index provides a more consistent picture of national activity. In March, the 3-month moving average increased to -3.27 from -3.57 in February. A bottom of the 3-month moving average of the CFNAI is associated with the likely end of a recession, most of the time. We will be tracking this information to get a heads up about the economy.”
Source: Asha Bangalore, Northern Trust - Daily Global Commentary, April 20, 2009.
Asha Bangalore (Northern Trust): House Price Index points to moderation in pace of decline
“The Federal Housing Finance Authority’s (previously OFHEO) House Price Index (HPI) for February moved up 0.7% in February after a 1.1% increase in January. From a year ago the HPI dropped 6.43% compared with a 6.88% decline in January. The sharpest decline was recorded in November 2008 (-9.06%). The Case-Shiller Home Price Index for February will be published on April 28. In January the Case-Shiller Home Price Index fell 19% from a year ago following an 18.6% drop in December.
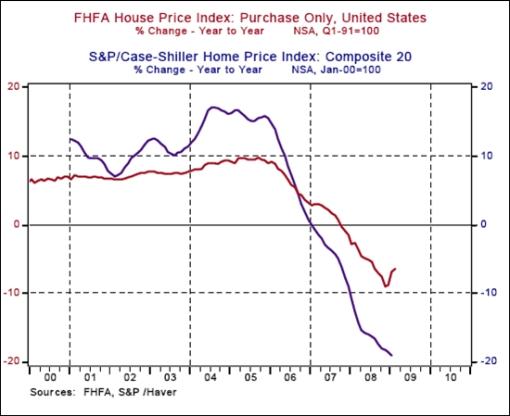
“Two out of three house price indexes appear to have established a tentative bottom. The New York Times (For Housing Crisis, the End Probably Isn’t Near) story suggests that additional price declines, probably of a large magnitude, are likely in the near term. The elevated level of inventories of unsold homes and the weakness in employment conditions support the conclusion of the article. However, we should bear in mind that other sectors of the economy are showing preliminary signs of stabilization that could translate into a recovery given the historical size of the monetary and fiscal policy stimulus put in place.”
Source: Asha Bangalore, Northern Trust - Daily Global Commentary, April 22, 2009.
Asha Bangalore (Northern Trust): Sales of existing homes appear to be stabilizing at a low level
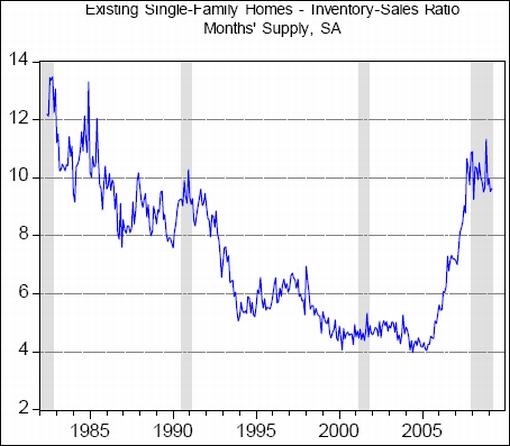
“Sales of all existing homes dropped 3.0% at an annual rate of 4.57 million units in March. Sales of existing single-family homes declined 2.8% to an annual rate of 4.10 million units in March. Sales of single-family existing homes have moved in a narrow range of 4.06 million - 4.25 million in last five months, suggesting that a bottom at a low level is being established. The Beige Book, prepared for the April 28-29 FOMC meeting, noted that there were ‘some signs that conditions may be stabilizing’.
“The seasonally adjusted inventory-sales ratio for existing single-family homes rose slightly to a 9.6-month supply mark in March from a 9.5-month supply in the earlier month. This ratio appears to have peaked in November 2008 (11.3 month supply) and has since moved in a narrow range between 9.96 months and 9.53 months.”
Source: Asha Bangalore, Northern Trust - Daily Global Commentary, April 23, 2009.
Asha Bangalore (Northern Trust): New home sales appear to be stabilizing
“Sales of new homes dropped 0.6% to an annual rate of 356,000 in March following an upwardly revised gain in sales during February (358,000 versus earlier estimate of 337) and January (331,000 versus earlier estimate of 322,000). The level of new home sales suggests that sales are stabilizing. … year-to-year decline in sales in new homes in March was smaller than in prior months.
Source: Asha Bangalore, Northern Trust - Daily Global Commentary, April 24, 2009.
Asha Bangalore (Northern Trust): Initial Jobless Claims erase part of the improvement seen in recent weeks
“Initial jobless claims moved up 27,000 to 640,000 in the week ended April 18 and erased a part of the decline seen in the prior two weeks.
“Continuing claims, which lag initial claims by one week, advanced 93,000 to 6.137 million, a new record. The insured unemployment rate rose to 4.6% from 4.5% in the previous week. The insured unemployment rate has risen one percentage point in a short span of 10 weeks which has occurred only on two other occasions. The jobless claims report presents a serious challenge to policymakers.”
Source: Asha Bangalore, Northern Trust - Daily Global Commentary, April 23, 2009.
Casey’s Charts: Pouring fuel on the fire
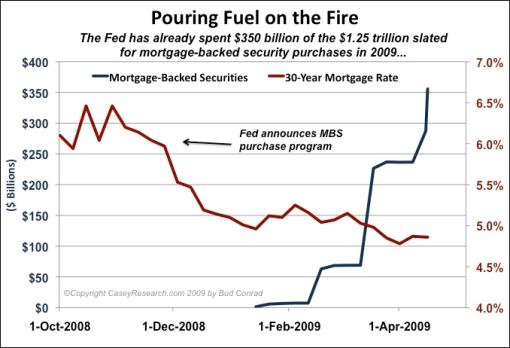
“In November, the Fed announced its intent to purchase agency mortgage-backed securities directly from the market ‘to reduce the cost and increase the availability of credit for the purchase of houses’.
“After pumping $350 billion worth of freshly printed dollars into the system, they’ve succeeded in forcing mortgage rates to near historic lows. Great news for homeowners able to refinance; yet new home sales remain stagnant.
“There’s no telling when the housing market will stabilize. But the Fed is certain to continue fueling the fire with cheap money until recovery signs appear.”
Source: Casey’s Charts, April 21, 2009.
Bloomberg: Zero percent on Treasury Bills as China, Fed converge
“The last time US Treasury bill rates headed toward zero percent investors were panicking. Now it’s an indication Federal Reserve Chairman Ben Bernanke’s efforts to revive credit markets are starting to work.
“Rates on three-month bills turned negative in December for the first time since the government began selling them in 1929 as investors sacrificed returns to preserve principal. After increasing at the start of the year, rates have dropped 0.20 percentage point since the beginning of February to 0.13%.
“Demand for bills is rising again because investors including foreign central banks are snapping up the shortest-term US securities as the Federal Reserve buys Treasuries to drive down borrowing costs in a policy of so-called quantitative easing. China, the largest US creditor, with $744 billion of debt, has questioned the practice and shifted purchases to bills from longer-maturity securities.
“‘There’s a group of investors out there who are looking at what the Fed is doing and the policy action they’ve taken and the asset purchases, and saying ultimately this is inflationary,’ said Stuart Spodek, co-head of US bonds in New York at BlackRock. ‘You’re going to invest in very short-term bills because you absolutely need not just the quality but also the absolute liquidity.’
“China bought $5.6 billion in bills and sold $964 million in US notes and bonds in February, according to Treasury data released April 15. It was first time since November that China purchased more bills than longer-maturity debt.”
“While Treasury depends on China to fund the deficit, exports account for about 40% of gross domestic product for the world’s most populous nation. China’s exports to the US jumped 40% in March after slumping for five consecutive months.
“‘China and the US have a symbiotic relationship,’ said Win Thin, a senior currency strategist in New York at Brown Brothers Harriman & Co. ‘We need each other.’”
Source: Daniel Kruger, Bloomberg, April 20, 2009.
SmartMoney: Could municipal bonds really default?
“When Warren Buffett speaks, it’s usually worth paying attention. This time, the Oracle of Omaha is voicing concerns about the ability of some battered local and state governments to pay off their debts. The idea of cities and states facing insolvency is alarming for sure, and Buffett isn’t alone. Moody’s recently assigned a ‘negative outlook’ to the creditworthiness of all the nation’s local governments. The agency has rarely made such a sweeping generalization but said the magnitude of this recession warranted the move. The comments are the latest to have shaken the once-staid world of municipal bond investing.
“Traditionally, muni bonds offered lower yields - usually about 20% less - than Treasury bonds, since their income isn’t taxed. But the group was crushed last year, sending prices down and yields up. Now bargain hunters have started to emerge, attracted by yields that are as much as 70 basis points, or 0.7%, more than similar 10-year Treasurys, for example. As a result, the S&P Muni Index has climbed 7% this year, compared with the nearly 6% decline in the broader stock market.
“These low prices reflect investor concerns about possible downgrades, says Daniel Solender, director of municipal bond management at Lord Abbett. The Federal Reserve’s buying spree in other areas of the bond market is also depressing yields of Treasury bonds and making municipal bonds all that more attractive. And then there is the $100 billion fiscal stimulus headed toward the states that should help offset the shortfall in tax revenue, says TD Ameritrade Chief Investment Strategist Stephanie Giroux, who adds that historically there has only been a 1% default rate for muni bonds.”
Source: Reshma Kapadia, SmartMoney, April 23, 2009.
Bespoke: Muni Bond ETF makes a comeback
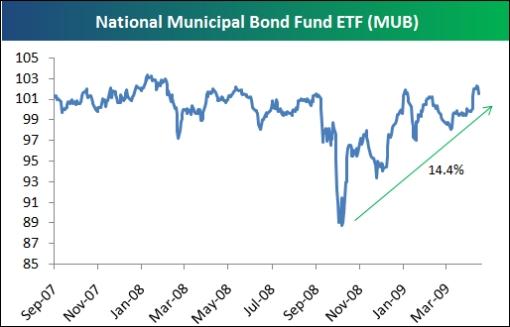
“Investing in municipal bonds is a paradox for investors right now. On one hand, they are attractive because of their tax-free status since taxes are expected to rise. On the other hand, with the economy as bad as it is, municipalities could come under duress and be at risk of default. Based on the performance of the National Muni Bond ETF (MUB) in recent months, it looks like investors are weighing the tax advantage more heavily against default risk. As shown below, MUB is up 14.4% from its lows last year, and it is trading near its all-time highs since the ETF was released in 2007.”
Source: Bespoke, April 24, 2009.
David Fuller (Fullermoney): Clues to stock market outlook
“Few of the Western stock market indices have rallied sufficiently to confirm that the bear market is over. Irrefutable confirmation, in our view, will not occur until share indices break above their 200-day moving averages, which then also turn upwards. Obviously markets will be well off their lows when this evidence of at least medium-term uptrends is apparent.
“However, there are many technical clues along the way. The first, specific to Western stock markets, is that tech-weighted indices such as Sweden’s OMX and the USA’s Nasdaq 100 did not break to new lows in February and March. Tech is often a lead indicator. The second clue is the number of downside failures which occurred with weaker indices. Third is the orderly and persistent six-week rally which tested the previous rally high in some although not all of these indices - Germany’s DAX, for instance and the S&P 500 got close to that 880 level which we have often mentioned in the past.
“There were enough downward dynamics yesterday [Monday] to suggest that reactions and consolidations were commencing in response to the short-term overbought conditions previously mentioned. If so, and if Western stock market indices hold at least half of their gains since the March lows during this pause, which could last for a number of weeks, and then move to new recovery highs, the bear market pattern of lower rally highs followed by new lows will have been broken. There is also a possibility that indices only hover near current levels for a short while before extending their rallies. If so, many would break their previous rally highs, providing a fourth clue by these indices that their bear market was over.
“I remain reasonably optimistic because we have already seen a bullish lead from many favoured Fullermoney themes, led by China and Brazil among the bigger capitalisation emerging markets, as mentioned so often in recent months.
“Meanwhile, all stock market indices show varying degrees of the ranging, base building reversion to the mean (the latter is represented by the 200-day MAs) which this service has been forecasting since the selling climax in late October and November. Consequently, downside risk, even for the weakest stock markets, currently looks to be no worse than base formation extension, consistent with the long convalescence also forecast.”
Source: David Fuller, Fullermoney, April 21, 2009.
Richard Russell (Dow Theory Letters): Are we in a bear market rally or a new bull market?
“(1) The market turned up in a V-shaped reversal off the March 9 low. However, almost all bull markets start with a period of accumulation. This entails a sideways move, sometimes taking weeks or even months. Or it may require a non-confirmation of the Averages as per December 1974. At the March low, we saw neither - no indication of accumulation. And that bothers me.
“(2) At the March lows, we did not see the ‘great values’ that usually accompany major bear market bottoms (i.e. P/E’s in the 5-8 area, average dividend yields of 5-6%).
“(3) The market was severely oversold at the March lows, a condition that often sets off a ‘relief’ (‘let off the pressure’) rally. The advance was probably triggered by the severely oversold condition of the market.
“(4) The one thing a money-manager cannot afford to do is be on the sidelines during ‘what could be’ a major rally. Once the market started up from the March 9 low, many money managers leaped in. The big short positions were immediately squeezed. The rise became a momentum advance. Retail buyers moved in, many trying to retrieve some of their brutal losses.
“(5) The rally moved up ‘too fast’ - action more typical of a bear market rally than the slow, plodding rise that is characteristic of the advance in a new bull market.
“(6) Two groups that led the rally were Financials and Consumer Cyclicals. Interestingly, these two groups contained respectively 5 billion and 2.7 billion shares sold short. This suggests strongly that a significant part of the rally was fired up by short-covering in these two groups (thanks Alan Abelson for this information).
“(7) Many investors and analysts turned optimistic after the market had rallied for only a few weeks. At true bear market bottoms, investors remain stubbornly sceptical or bearish for months after the bottom. Remembering 1974, people were actually angry when I turned bullish at the bottom. I was receiving hate letters and subscription cancellations.
“All of the above have kept me skeptical and cautious about this rally.”
Source: Richard Russell, The Dow Theory Letters, April 20, 2009.
Eoin Treacy (Fullermoney): Stock markets are vulnerable to a pullback
“In the short-term, all stock markets are vulnerable to a pullback for a number of reasons. The six week rally is beginning to look overextended. Some of the leading shares and commodities are beginning to lose their uptrend consistency. Taiwan’s key reversal on Friday is notable in this regard. Israel needs to rally from near current levels if it is to remain consistent. The same can be said for copper and platinum. However all of these markets have already posted impressive gains and have room to consolidate above their bases.
“Markets such as the Dow Jones Industrial or the FTSE 100 rallied well over the last six weeks but only managed to push partly back into their previous ranges. Taking the performance of leading global stock indices into account, we can probably deduce that they are in the bottoming process. However, the case that they have hit their absolute lows is much less clear than for the leading markets.
“‘Buy and hold’ is a suitable strategy for when relatively consistent uptrends have been established. These are not present in the lagging markets and it is too early to say with the leading markets. The conditions will be more suitable for such a strategy when the 200-day moving average has turned upwards and indices find support near it on downward reactions within their uptrends. However, let us not forget that the conditioning process of the bear market will influence or ability to stay with uptrends once they get going.
“… the Dow Jones World Stock Index has not reverted to its mean in the same way that some of the leading markets have. This supports the lengthy convalescence hypothesis for lagging markets. This index is capitalization weighted and heavily influenced by US shares, particularly in the oil and banking sectors. Neither of these is currently leading.
“As for the S&P 500, one could have argued that the rally from the November low was a failed break. However, the index was unable to sustain the initial rally and the progression of lower highs remained in place. It broke downwards again in February and made a new low. On this occasion, the rally has been larger and the Index is pressuring the progression of lower highs so an argument can again be made for a failed downside break. However, we have quoted 880 as an important level for the S&P for a number of months. It continues to need a sustained push above this level to reaffirm support from the lows.”
Source: Eoin Treacy, Fullermoney, April 20, 2009.
Bloomberg: S&P 500 will rise to 1,100 this year, Leuthold says
“Steve Leuthold, whose Grizzly Short Fund returned 74% last year betting against US stocks, said the Standard & Poor’s 500 Index will surge to 1,100 after valuations got to the cheapest levels of his career in March.
“Leuthold, 71, who helps manage $3.2 billion as founder of Minneapolis-based Leuthold Weeden Capital Management, said most investors should have 65% of their assets in stocks.
“‘This market was about as cheap as I’ve seen in my 45 years in this business,’ Leuthold said in a Bloomberg Television interview today. ‘We’re probably going to see the economy start turning upward, not now but toward the end of the year. The market is a lead economic indicator, so the time clock is about right for the market to turn up.’
“Leuthold also said that financial shares won’t be the stock market’s leaders. He favors technology and biotechnology companies and advised investors to avoid ‘defensive’ consumer shares and utilities.
“‘Investors should start buying gold over the next year or so because of the threat of inflation,’ Leuthold said. He started buying the precious metal three weeks ago.”
Source: Rita Nazareth and Erik Schatzker, Bloomberg, April 14, 2009.
Bespoke: Q1 earnings growth better than expected so far
“A fifth of the companies in the S&P 500 have reported earnings for the first quarter, and so far earnings are down 16.6% versus the first quarter of 2008. While down, this is much better than the -37.3% expected at the start of earnings season. When comparing actual earnings versus estimates, Consumer Discretionary, Financials, and Energy are leading the way. Consumer Discretionary was expected to see a year over year decline of 103.4% at the start of earnings season, but the companies that have reported in the sector have only seen earnings decline 22.2% so far. And Financials are actually showing earnings growth with 26.3% of the reports in.
“On the downside, the Industrial sector is the only one where actual earnings have come in weaker than expected. Earnings season still has a long way to go, but the fact that growth has come in better than expected thus far has been one factor driving the market higher.”

Source: Bespoke, April 22, 2009.
Bespoke: Earnings season beat and miss rates
“A total of 430 US companies and 156 S&P 500 names have reported their quarterly numbers since earnings season began with Alcoa’s report on April 7. We’re always monitoring how companies are reporting versus expectations, and below we highlight the percentage of companies beating and missing estimates as earnings season has progressed.
“At the start of earnings season, more companies were missing estimates than beating, however, this trend has changed significantly as the bulk of reports have come in this week. At the end of last week, 50% of US companies had beaten estimates, and this number has increased every day this week to its current level of 57%. Last quarter only 55% of companies beat estimates, so if we begin to see the ‘beat rate’ increase quarter over quarter instead of decrease, it will be a positive sign for the market.
“And stocks within the S&P 500 are reporting even better numbers. Again, after a slow start, the current ‘beat rate’ for the 156 S&P 500 companies stands at 67%. Earnings season still has a long way to go, but the current trend has investors optimistic.”

Source: Bespoke, April 23, 2009.
Bespoke: Retail stocks show relative strength
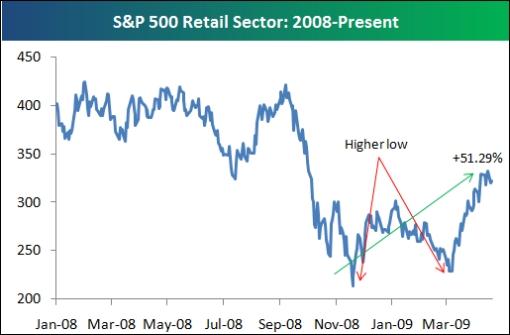
“At a time when the US consumer is supposed to be all but dead, retail stocks have been soaring. As shown below, the S&P 500 Retail group is up 51.29% since its low last November. Interestingly, when the overall market broke to new lows in early March, the Retail group failed to make a new low, which is indicative of its relative strength.
Source: Bespoke, April 21, 2009.
Casey’s Charts: SPDR Gold Shares growing rapidly
“SPDR Gold Shares (GLD), an exchange-traded fund, first hit the market in November 2004 with 260,000 ounces of gold. Today, GLD is the world’s 6th largest holder of physical gold with over 35 million troy ounces in the vault. In fact, since the general market meltdown last fall, the ETF has added over 16 million ounces and ended 2008 with a 5% gain - not many investments can make that claim.

Source: Casey’s Charts, April 23, 2009.
Vitaliy Katsenelson (Contrarian Edge): Who’s going to buy gold?
“After muting CNBC for years, I turned it on by accident yesterday and learned something very interesting. The gold ETF (GLD) is the sixth largest holder of gold in the world - the whole world, even ahead of China. When investors buy GLD they have to go out and buy gold driving up the prices. This raises a little question - who will be buying this gold from GLD when investors will decide to sell it?
“Gold is one of those weird assets where nobody knows what it is really worth. You cannot run discounted cash flow analysis to value it - it has no cash flows. It is an asset where perception and reality are deeply intertwined.
“Investors buying the gold ETF (GLD) are influencing the price of gold which is fair for the most part as otherwise they’d be buying the real thing. Though of course the ease of buying GLD creates a slightly higher artificial demand, but still it is fair game.
“The violent sell off in GLD will drive the prices of gold down dramatically unless a real buyer steps in (like another government sick of owning the US debt for instance) and the gold price could get cut in half overnight. Suddenly perception of not being a store of value will create a reality of gold not being a store of value. The gold game will be over.”
Source: Vitaliy Katsenelson, Contrarian Edge, April 18, 2009.
Guardian: Zimbabwe’s central bank raided private accounts to prop up ministries
“Zimbabwe’s central bank governor admitted today that he took hard currency from the bank accounts of private businesses and foreign aid groups without permission, saying he was trying to keep his country’s cash-strapped ministries running.
“In a statement that would be unthinkable coming from most central banks, the governor of the Reserve Bank, Gideon Gono, appeared to be issuing a plea to keep his job in the face of growing criticism.
“Gono said it was time ‘to let bygones be bygones’ now that Zimbabwe has a new coalition government dedicated to reversing its economic decline.
“The central banker said he gave the money he took from the hard currency accounts as loans to various ministries, and the private accounts would be reimbursed when the ministries repaid the loans. He said the bank’s efforts ‘sustained the country’ in its hour of need.
“Gono’s statement showed the practice was widespread. It was first hinted at last year, when the international aid agency Global Fund threatened to cut off funds to Zimbabwe for fighting Aids, tuberculosis and malaria unless money taken from its account was returned. The central bank returned $7.3 million to Global Fund.
“The raiding of foreign currency accounts is just one of the highly questionable actions for which Gono has been sharply criticised.
“In the last two years, Gono has slashed 25 zeros from the local currency, printed more local money without backup reserves or assets and distributed agricultural equipment to many in President Robert Mugabe’s party who were given farms seized from white people.”
Source: Guardian, April 20, 2009.
Barron’s: Jim Rogers isn’t buying a US stock recovery
“Legendary investor Jim Rogers is skeptical of the latest rally in equities - as well the health of the global economy. As such, he is scorning stocks and bonds while embracing commodities as his investment vehicle of choice. Barron’s John Kimelman got the chance to interview the CEO of Rogers Holdings, with the following excerpts appearing on the website yesterday:
Q: When you last did a lengthy interview with Barron’s magazine a year ago you were lightening up on emerging markets investments. Well, you called that one right. But now that many of those markets have fallen from their highs of recent years, are you more optimistic?
A: No. I’ve sold all emerging markets stock except the ones in China. I bought more Chinese shares in October and November during the panic, but I have not bought China or any other stock markets including the US since then. I’m not buying anything in China right now because the Chinese market ran up maybe 50% since last November. It’s been the strongest market in the world in the past six months and I don’t like jumping into something that has been that run up. Still, I’m not thinking of selling these stocks either. I think if it goes down I’ll buy more. I think you will find that it’s the single strongest market in the world since last fall.
Q: That being said, you currently think Chinese stocks are bid-up now, so you’re not buying at these levels. So what have you been buying lately?
A: I have been buying commodities through the Rogers commodity indexes I developed because my lawyer won’t let me buy individual commodities. I recently bought all four Rogers indexes - the Elements Rogers International Commodities Index (ticker:RJI) as well as the three specialty indexes, the International Metals (RJZ), the International Energy (RJN), and the International Agriculture (RJA.) That’s how I invest in commodities and that’s what I bought last week. I have been buying these shares since last fall and up to last week.
Q: Now despite the recent stock-market rally that started in March, many US stocks are trading well off their 2007 highs. How come you see no value to this market?
A: I am not buying US companies mainly because I think we may have seen a bottom but I don’t think we have seen the bottom. I am skeptical about the rally, the world economy for the next year or two or three. But if stocks go down, I can make money with commodities. In the 1970s, commodities went through the roof even though stocks were a disaster. In the 1930s, commodities rallied first and went up the most long before stocks pulled it together.
Q: Can you summarize the reasons for your bullishness about commodities?
A: It depends on the supply and demand. And we have had a dearth of supply. Nobody has invested in productive capacity for 25 or 30 years now. The inventories of food are the lowest they have been in 50 years and you have a shortage of farmers even right now because most farmers are old men because it has been such a horrible business for 30 years. And as for metals, nobody can get a loan to open a mine as you know. Who is going to give you money to open a zinc mine? It takes at least 10 years to open a mine so it’s going to be 15 or 20 years before we see new mines come on. Nobody has been opening mines for 30 years and they are not going to. And in the meantime reserves are declining. As for oil, the International Energy Agency came out recently with a study showing that oil reserves worldwide were declining at the rate of 6% or 7% a year.
That does not mean that if suddenly the US goes bankrupt that everything won’t collapse in price. But I would rather be in commodities because it’s the only thing I know where the fundamentals are improving. They are not improving for Citibank or General Motors but the supply situation in commodities is such that when demand comes back, then commodities are going to be the best place to be in my view.”
Click here for the full article.
Source: Barron’s, April 20, 2009.
Bespoke: Baltic Dry Index on 9-day winning streak
“The Baltic Dry Index is used to track the globalization trade, as it measures the supply and demand for the shipment of goods around the world based on transport costs. The Baltic Dry Index has had some big ups and downs this year, going on multiple winning and losing streaks. This year alone, the index has had a 17-day winning streak, a 21-day losing streak, and it’s currently on another 9-day winning streak. The trend in 2009 has been upward, however, as the index is up 145%. And it’s still important to remember that we’re working off a very low base after the globalization bubble burst last year. The index is still off 84% from its highs in May of 2008.”

Source: Bespoke, April 24, 2009.
Bespoke: Bespoke’s commodity snapshot
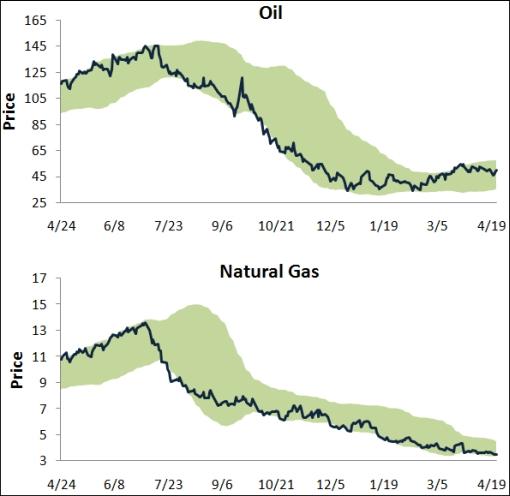
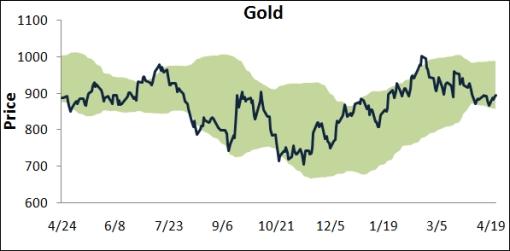
“Below are our trading range charts for some commodities. The green shading represents 2 standard deviations above and below the commodity’s 50-day moving average. When the price moves above or below this green shading, the commodity is in extreme overbought or oversold territory.
“As shown, after reaching overbought territory a few weeks ago, oil has pulled back to just above the middle of its trading range. After trending higher since last October, gold and silver have recently moved to the bottom of their trading ranges, but they bounced nicely off of oversold territory a couple days ago. Platinum has held up better than gold and silver and is closer to the top of its trading range than the bottom.
“Not shown, copper continues to trend higher, along with orange juice, while corn, wheat, and coffee are in a sideways trading pattern.”
Source: Bespoke, April 23, 2009.
Financial Times: China reveals big rise in gold reserves
“China has quietly almost doubled its gold reserves to become the world’s fifth-biggest holder of the precious metal, it emerged on Friday, in a move that signals the revival of bullion after years of fading importance.
“Gold rose to a three-week high of more than $910 an ounce after Hu Xiaolian, head of the secretive State Administration of Foreign Exchange, which manages the country’s $1,954 billion in foreign exchange reserves, revealed China had 1,054 tonnes of gold, up from 600 tonnes in 2003.
“The news could spark interest in gold among other central banks. ‘When the largest holder of foreign exchange reserves discloses an increase in gold holdings, other countries may decide to think more carefully about underweight gold positions,’ said John Reade, a precious metals strategist at UBS.
“The increase in China’s gold reserves has come primarily from domestic production and refining. However, the news raises questions about the future of Beijing’s foreign reserves policy.
“Ahead of the G20 summit in London this month, China suggested global reliance on the US dollar as a reserve currency should be reduced.
“China has been diversifying away from the dollar since 2005, when it broke the renminbi’s peg to the US currency and officially marked it to a basket of currencies, but it still holds more than two-thirds in US dollar-denominated assets by most estimates.
“As its trade surplus and forex reserves ballooned in recent years, Beijing continued to buy huge amounts of US Treasury bonds while raising the proportion of purchases it allotted to other currencies and to gold.
“‘China’s announcement signals a broader shift in central banks’ attitude towards gold,’ said Philip Klapwijk, chairman of GFMS, the precious metal consultancy.”
Source: Jamil Anderlini and Javier Blas, Financial Times, April 24, 2009.
Eugen Weinberg (Commerzbank): Copper rallies too soon
“The rally in the copper market, where prices have risen by about 50% in the past eight weeks, looks to be premature, says Eugen Weinberg, commodities analyst at Commerzbank.
“He notes three main points put forward by market bulls.
“First, signs of a stabilising economic environment justify a cyclical recovery in base metal prices; second, purchases by China’s State Reserve Bureau will prevent a strong decline in demand; third, London Metal Exchange copper inventories have declined sharply, and falling inventory levels normally point to a market tightening.
“But Mr Weinberg believes an improvement in the economic situation is still uncertain. ‘And even if sentiment indicators have sustainably turned round, previous economic cycles have not seen a recovery in base metal prices right after sentiment has bottomed.’
“He also believes that the purchases by the SRB in China can only support prices in the short term. ‘Given that its strategic stockpiling effort is at an advanced stage, the SRB will gradually withdraw from the market during the coming weeks. The shrinking LME inventories, especially in warehouses in Asia, reflect the strong Chinese import-driven pull.
“‘We therefore expect a significant correction in the copper price during coming weeks - although this might be delayed by rising interest from financial investors.’”
Source: Eugen Weinberg, Commerzbank (via Financial Times), April 23, 2009.
Reuters: Boone Pickens sees oil at $75/bbl at end-year
“Texas oil billionaire T. Boone Pickens on Monday reiterated his prediction that crude oil prices would hit $75 a barrel this year as producers scale back production.
“Pickens said about OPEC producers: ‘They told you they want $75 by the end of the year, I would count on that, I believe them.’
“OPEC has scaled back output to help support crude prices, which have dropped from record highs over $147 a barrel in July to around $47 a barrel on Monday.
“‘I think you are going to clean up the stocks because the people who have the oil are cutting supply,’ Pickens said at an alternative fuels and vehicles conference, referring to the nearly 19-year high on US inventories of crude oil reported last week by the federal government.
“The United States would likely burn through its supply overhang in three months, he told reporters.”
Source: Reuters, April 20, 2009.
CEP News: Euro zone PMIs hit six-month highs, suggesting economic stabilization may be in sight
“Euro zone output improved by a record margin in April, suggesting that the economy could begin to stabilize by the end of the year, Markit Economics reported on Thursday.
“According to advance estimates, the euro zone manufacturing purchasing managers index hit a six-month high of 36.7 in April, beating expectations of a 34.7 print.
“The services PMI also reached its highest level in six months, rising to 43.1 in April, up 1.7 points from the forecasted figure and up 2.2 points from March’s level.
“Taking both the manufacturing and services PMIs together, Markit noted that the composite PMI jumped by a record 2.2 points to a six-month high of 40.5 in April, up from both the 38.9 print expected and the previous month’s 38.3 reading.
“The improvements were widespread in the month, Markit said, noting that declines in new business and backlogs of work had eased sharply. Furthermore, the ratio of new orders to stocks rose to its highest level since August, hinting at good news to come regarding future output, Markit said.
“However, employment levels continued to contract, falling at record speeds as companies adjusted to weakening demand, the report said.
“Despite the strong gain in the PMI figures, Markit senior economist Chris Williamson warned against being overly optimistic.
“‘The ongoing severity of the situation should not be underestimated,’ he said ‘The latest numbers are still consistent with a double-digit annual rate of decline of manufacturing output and a quarterly rate of contraction of GDP of at least 0.5%.’”
Source: CEP News, April 23, 2009.
CEP News: ZEW headline figure rises to 2-year high on strong German investor optimism
“Stronger-than-expected German investor optimism for the six-month outlook pushed the Centre for European Economic Research’s economic sentiment indicator above zero for the first time since July 2007 and to its highest level since June of the same year.
“According to the ZEW, the German economic sentiment indicator rose to +13.0, overshadowing both the +2.0 reading expected and March’s -3.5 level. However, the research firm was quick to add that the headline figure still remains significantly below its long-term average of 26.1 points.
“In a report issued on Tuesday, the ZEW noted that sentiment likely benefited from recent government stimulus packages, as well as easing inflationary pressures and the improving economic outlook in both the US and China
“‘Along with other indicators, the ZEW sentiment indicator reveals that there are well-founded expectations that the downward dynamics of the business cycle are bottoming out,’ ZEW President Dr. Wolfgang Franz said. ‘It is even becoming more likely that the economy will slowly recover in the second half of this year.’”
Source: CEP News, April 21, 2009.
Ifo: Rise in the Ifo Business Climate Index
“The Ifo Business Climate for industry and trade in Germany has improved somewhat in April. The firms are no longer quite so dissatisfied with their current business situation than in the previous month. With regard to the business outlook for the coming half year, the sceptical assessments have again been reduced somewhat. It is thus likely that the decline in economic output will slow clearly.”

Click here for the full report.
Source: Ifo, April 24, 2009.
Financial Times: Darling “flying on a wing and a prayer”
“Martin Wolf, FT chief economics commentator, analyses the UK Budget 2009. He says nothing in today’s Budget will ensure chancellor Alistair Darling’s optimistic growth forecasts will be achieved and that he is at the mercy of a global recession. He says the government appears to want to spend as if nothing has happened at least until next year and the election.”
Source: Financial Times, April 23, 2009.
CEP News: UK plans to borrow £703 billion over five years to fight recession
“The UK government plans to borrow a record £703 billion over the next five years - £269 billion more than in the previous budget - to continue supporting a suffering economy and counteract large job losses.
“Presenting the fiscal 2009 budget on Wednesday, UK Chancellor of the Exchequer Alistair Darling said the UK economy is expected to contract 3.5% in 2009 and grow 1.25% in 2010.
“To counteract large declines in employment, the UK is proposing to spend an additional £1.7 billion to create jobs and provide guarantees for the unemployed over a period of 12 months. The initiative applies to persons under the age of 25 and is expected to support 250,000 jobs.
“On housing, the UK plans to guarantee asset-backed securities and extend mortgage support to people who lost their jobs, and extend the stamp tax duty holiday on homes worth up to £175,000 until the end of the year. The budget also allots £500 million in aid to homebuilders.
“Also included is an automobile scrapping agreement that will offer a £2,000 discount to those trading in used cars for new ones. The initiative will be in place until March 2010.
“The budget also allots £750 million to set up a strategic investment fund.
“The UK’s Debt Management Office will issue £220 billion in gilts over the 2009-2010 fiscal year to finance £175 billion in public borrowing. Total borrowing is projected to decline to £97 billion by 2013-2014.
“Public borrowing will total 11.9% of GDP in 2010, said Darling, who wants to cut the current budget deficit in half over the next four years.”
Source: Erik Kevin Franco, CEP News, April 22, 2009.
CEP News: UK house prices post three-month winning streak
“UK house prices continued moving higher in April, marking three-months of gains, according to a report from Rightmove.
“House prices climbed 1.8% in April to an average price of £222,077. A month earlier, house prices had increased 0.9% to an average price of £218,081.
“On an annual basis, house prices are down 7.3% in April, better than March’s 9.0% decline.
“Although the news bodes well for the Island Nation who’s housing sector was hard-hit by the financial crisis, house prices in London plunged 3.2% month-over-month in April, reversing a 3.1% gain the month prior. This resulted in an annual decline of 4.1% versus the 1.8% contraction seen in March.”
Source: CEP News, April 19, 2009.
Financial Times: Japan to issue $110 billion bonds for stimulus
“Japan is to issue an extra Y10,800 billion ($110 billion) of government bonds this fiscal year to help it tackle its worst recession since the second world war.
“The bonds will fund the bulk of the government’s $154 billion stimulus plan and will bring its expected total new issuance for the fiscal year starting this month to a record Y44,100 billion, a 33% rise on last year.
“This comes as governments around the globe are taking on record debt levels to bail out loss-making banks and bolster economies as they attempt to spend their way out of the downturn.
“The US is expected to issue about $2,000 billion in the fiscal year starting last October, more than double last year. The eurozone governments are set to raise €800 billion ($1,050 billion) this calendar year, 23% up on 2008.
“The UK government in Wednesday’s annual Budget statement is expected to announce plans to issue £180 billion ($270 billion) in the 2009/10 financial year, a 25% rise on last year’s record levels.
Source: Lindsay Whipp, David Oakley and Michael Mackenzie, Financial Times, April 21, 2009.
By Dr Prieur du Plessis
Dr Prieur du Plessis is an investment professional with 25 years' experience in investment research and portfolio management.
More than 1200 of his articles on investment-related topics have been published in various regular newspaper, journal and Internet columns (including his blog, Investment Postcards from Cape Town : www.investmentpostcards.com ). He has also published a book, Financial Basics: Investment.
Prieur is chairman and principal shareholder of South African-based Plexus Asset Management , which he founded in 1995. The group conducts investment management, investment consulting, private equity and real estate activities in South Africa and other African countries.
Plexus is the South African partner of John Mauldin , Dallas-based author of the popular Thoughts from the Frontline newsletter, and also has an exclusive licensing agreement with California-based Research Affiliates for managing and distributing its enhanced Fundamental Index™ methodology in the Pan-African area.
Prieur is 53 years old and live with his wife, television producer and presenter Isabel Verwey, and two children in Cape Town , South Africa . His leisure activities include long-distance running, traveling, reading and motor-cycling.
Copyright © 2009 by Prieur du Plessis - All rights reserved.
Disclaimer: The above is a matter of opinion and is not intended as investment advice. Information and analysis above are derived from sources and utilizing methods believed reliable, but we cannot accept responsibility for any trading losses you may incur as a result of this analysis. Do your own due diligence.
Prieur du Plessis Archive |
© 2005-2022 http://www.MarketOracle.co.uk - The Market Oracle is a FREE Daily Financial Markets Analysis & Forecasting online publication.


