


Thoughts from the Frontline - The US Mortgage Market - Overexposed and Overrated
Stock-Markets / Financial Markets May 26, 2007 - 11:13 AM GMTBy: John_Mauldin

In this issue:
The Chinese Hedge Fund Dragon
Turning Nuclear Waste into Gold
Overexposed and Overrated
Housing Is Weaker than the Data Suggests
Planes, Trains, Automobiles, and We're #30
This week we look at the US mortgage market to see what fallout there is from the subprime mortgage woes. It is both less of a problem and/or more of a problem, depending on your perspective, as I predicted it would be last year. Score one for your analyst, which said score is needed as the stock market continues to rise in spite of my concerns in the face of a slowing economy.
This will be part of a speech I give next Thursday in Edinburgh, Scotland at the Credit Development Academy. While it will print out long, there are a large number of charts and graphs, so it is not as long as it appears. We also look at the recent move by China to enter the private equity world, and show that this is just the tip of the iceberg, while pondering how to interpret the recent housing data. There should be something of interest for everyone.
The Chinese Hedge Fund Dragon
We will start my thoughts on the announcement this week that China has purchased 9.9% of Blackstone, a large private equity fund, for 3 billion dollars. I wrote a few months ago, in an e-letter called "China and the Hedge Fund Dragon" that China was planning to use as much as 30% of its growing reserves to invest in areas outside of normal liquid reserves, and that such a move would create even more liquidity in the world. ( http://www.2000wave.com/article.asp?id=mwo030907 )
First, $3 billion is only about 1% of the money China said they intended to employ, so expect a lot more such announcements. But as the first such public deal, it is interesting, and a smart move by both parties. China gets to look over the shoulder of Stephen Schwarzman and team to learn how one of the most successful private equity firms in the world goes about its business. For all intents and purposes, China is basically saying they are going to create a $300 billion private equity fund from scratch. Learning from the best makes sense.
(To put $300 billion into perspective, you could combine the capital controlled by 3 or 4 of the largest private equity funds and, together with the leverage they use, the amount of capital deployed would be as large. Think about that late at night.)
Blackstone will almost assuredly get better access to Chinese deals, which is a win for the firm. But there are two more interesting themes that intrigue me. First, think about what it will mean to Blackstone when they sit down at the table to negotiate a deal. The fact that they have a partner with a monster piggy bank to bankroll a deal certainly has to increase the size of the deals they can think about. This is going to mean ever more and larger deals coming into play. Second, China now has a way to get into these deals without a lot of public scrutiny. Private funds and the inner workings of their deals are, well, private. Want to buy Unocal? These guys are learning.
Such funds as China is creating are called Sovereign Wealth Funds or SWFs. China is starting just one of scores of such funds. The total wealth in these funds is estimated by Morgan Stanley to be as high as $2.5 trillion (with a T), far larger than the total managed by hedge funds. And these funds are growing rapidly.
The SWFs are growing fast as countries reap the benefits of high oil prices or large trade surpluses. "If we are right that these funds will grow by roughly $500bn a year, at the expense of official reserve growth, the total size of the SWFs should be as big as the official reserves in only five to six years' time," Morgan Stanley estimates.
Norway has a $300 billion fund. Russia is planning on a $50 billion fund. Abu Dhabi has an estimated $875 billion (!), and is admired around the world for its astute management. With growing reserves in so many countries, it makes sense from their perspective to invest for the longer term and in something besides short-term US bonds. But this is going to change the nature of the investment landscape and will almost certainly lead to more and more companies going into privately controlled hands, which means less opportunity for smaller investors.
And for you conspiracy theorists the China deal is a bonanza. Stephen Schwarzman, co-founder of Blackstone and President George W. Bush were "dorm roomies" at Yale and members of the highly secretive Skull and Bones Society. Now there is a story in there somewhere, but I will leave it for others to speculate.
Turning Nuclear Waste into Gold
It is no secret that the mortgage business in the US is in turmoil. I came across a website last February that tracks the demise of mortgage lenders in the US. Back then it was 28 firms that were no longer in business, in bankruptcy, or had been bought at distressed prices. Today it is 74.
What caused such distress? We live in a world where there is an increased appetite for yield by investors at all levels; and armed with growing liquidity, they chase those yields down to a point where traditional risk-reward measures would suggest the potential for problems.
Let's review a current scandal just to illustrate the chase for yields. For all our supposed sophistication, humans are still driven by emotions that were evolved chasing antelope and dodging lions on the African savannahs. There is an emotional thrill in the hunt for big game, or in modern circumstances, higher yields and bigger commissions and bonuses.
In the US, about 25% of the mortgages on new homes in 2006 were what is known as subprime mortgages. These are mortgages that are slightly less creditworthy and therefore carry higher interest rates. In the beginning this was a good thing, as first-time owners and those just starting out in life were given an opportunity to own their own homes.
But then came a world of liquidity looking for yield. Investors demonstrated a large appetite for these mortgages. Investment banks would buy those high-yielding subprime loans and package them into something called Residential Mortgage Backed Securities. Now, a subprime loan is not considered an investment-grade security. But when you put a group of them together into a pool and break them up into various sub-groups, or tranches, through the alchemy of high finance, you turn lead into gold. You create high-grade bonds from subprime debt. In fact, 80% of those grouped together get a AAA rating, because that tranche gets the first monies paid back to the debt pool. And it probably is pretty safe money. No problems yet. See the chart below, courtesy of Gary Shilling.
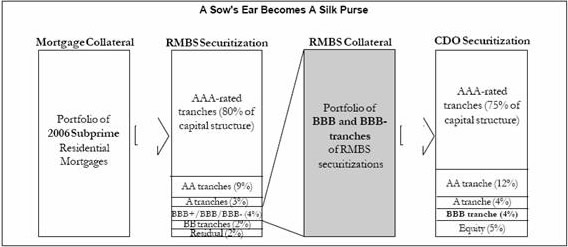
Then the investment bank starts slicing smaller parts of the pool and eventually ends up with the final 4% getting a below-investment-grade BBB rating. Again, this is all a good thing as it allows investors to buy the risk they want and makes for a more liquid real estate market. But then we start to get cute with alchemy. Not content with turning lead into gold, we start trying to do the magic on sewage.
Because investment banks then combine all these BBB tranches into yet another pool called a Collateralized Debt Obligation or CDO. The rating agencies have sophisticated models which tell them that with the increased diversification, 87% of these former BBB bonds can now be sold as AAA or AA investment-grade bonds. Only 4% is considered actual BBB debt, and 5% is the "equity" portion. So we have taken an original security that is not investment-grade and turned all but less than 9% into an investment-grade bond. Not just lead into gold, but nuclear waste into gold. Only on Wall Street.
Again, if all those mortgages pay off like they have in the past, then there is not too much of a problem. And past performance is what the rating agencies built their models on. But recent research suggests that as many as 20% of these mortgages sold in 2005 and 2006 are going to default and go into foreclosure. But the CDOs assume that less than 1% will default. If the number of defaults is even half of that predicted, then someone is not going to get their full capital back, let alone the interest. And we are seeing home foreclosures at record levels in every part of the United States due to the large number of subprime mortgages.
Why such a growing default rate? Because investors kept throwing money at mortgage bankers, who found out they could sell mortgages with little documentation. For instance, you could get a loan without actually having to prove your income. So the bankers said, "Let's take the fees and run. Bonuses all around for selling more mortgages." Now there is anecdotal evidence that a small but significant portion of these low-documentation loans had some items that were misrepresented. You know, little things like whether you were actually going to occupy the home.
Now, I do not blame the mortgage brokers. They were only writing loans that management allowed and that investors funded. There was no adult supervision in the sandbox. But the industry has taken it on the chin for the excesses. According to Barry Habib, there were 485,000 loan originations in 2004. By the end of 2006 there were 232,000, and by the end of this year there will be an estimated 200,000, or roughly where we were back in 2001.
Who bought these CDOs? Again, my sources say it was primarily Asian and European institutions, which simply looked at the rating on the bond and bought them. At the end of 2002 foreign investors owned $235 billion in mortgage-related securities. By the middle of 2006, they owned $850 billion, or 15.6% of all mortgage-related securities ( www.agaryshilling.com ). There will be lots of finger pointing over this one. Look for massive lawsuits to start up by the end of this year.
You can track the performance of these RMBS by going to www.markit.com (click on indices and then on ABX). They create a series of indexes based on the actual performance of the various tranches of the RMBS. For instance, the AAA tranche of these securities has indeed performed almost as expected, and is selling at only 99.5% of par value, which can somewhat be accounted for by interest-rate fluctuations.
But the BBB index? That is not as pretty. Look at the graph below of a series of BBB bonds, based on the underlying value of 20 such BBB bond tranches. Those securities lost 37% of their value in only a few months, though they have recovered somewhat to be down a mere 25%. For a rated investment-grade bond, this is not pretty.
As an aside, Markit.com has a wide variety of indexes on various debt groupings. It is quite a useful website.
Overexposed and Overrated
The above chart showing very real losses on the BBB bond tranches needs a few comments. First, as bad as it was, I am not aware of any major institution which ran into serious problems. Several major investment banks lost a cumulative billion or so, and probably will have to take even more write-downs in the future. But these banks are so profitable, the losses got swallowed up. Other than the mortgage banks themselves, there has not been much damage.
I am not aware of any hedge funds blowing up or even taking a serious hit as a result of these disruptions, and know that a few made significant money shorting the subprime debt space. Frankly, I was expecting a few to bite the dust.
Part of the reason is the distributed nature of the risk. Apart from the relatively small direct CDO market, most of this debt was bought by institutions as part of a much larger portfolio, so while the losses are real, they are small on an overall portfolio basis. Many institutions (especially foreign) simply buy the debt based on the ratings given them by the credit rating agencies, without much deep due diligence into the underlying loans.
Secondly, most hedge funds of which I am anecdotally aware and which use this debt on a leveraged basis actually look at the nature of the collateral in the bonds and avoided them, as they could see the problems. Some were shorting them way too early last year, as the problems were evident if you looked deep enough.
Third, much of the bad debt was in CDOs which were highly diversified. For instance, Fitch (a rating agency) recently did a release about how badly closed-end second lien (CES) Residential Mortgage Backed Securities have been doing of late. Those with exposure to the 2006-vintage loans are doing particularly poorly. They rate 116 of these CDOs and 35 which have exposure to the 2006 vintage of loans.
"The poor performance of recent vintage ABS [Asset Backed Securities] backed by pools of CES mortgages results from the interaction of a number of factors. The most significant factor is that the overwhelming majority of the loans in these pools were originated with a combined loan-to-value (CLTV) ratio of 100%. That is, the borrower mortgaged the full value of the home, typically through taking a first lien of 80% LTV, combined with a second lien on the remaining 20%. This means that in an environment with little home price growth, or outright home price declines, there is no equity cushion.
"When a borrower cannot make their mortgage payments, the lack of home equity eliminates refinancing as an option and therefore increases the likelihood the borrower will default. Home prices are flat to falling in areas where these mortgages are concentrated, such as California, driving higher levels of default. Given that the borrowers have subprime credit, the probability that the borrower will have difficulty with the payments is relatively high, and adding on additional layered risk factors such as stated income programs, further increased default risk." (Fitch)
Interestingly, these second lien notes behave much differently in the timing of the collateral loss. Defaulted first lien notes go through a foreclosure process that can often take over one year. Second lien notes are written off in 180 days after default, due to the poor recovery prospects for a junior lien.
Sounds grim, right? But Fitch notes that only 8 of the European CDOs they rate have exposure to the CES market, and the largest exposure is 2.2%. Most CDOs are composed of a wide variety of bonds and mortgages.
"At this time the cumulative exposure to subprime CES RMBS transactions in these CDOs is not sufficient to cause Fitch to place any tranche on Rating Watch Negative. However, as Derivative Fitch expects this negative performance trend to continue, the potential for negative actions on both high-grade and mezzanine SF CDOs increases dramatically where there are significant exposures to 2006 subprime CES RMBS and limited asset manager flexibility to sell assets."
What this means is that these CDOs are likely to perform below expectations but not enough to impact investors' principle over the long term. Those investors who bought the actual security backed solely by these 2006-vintage second lien loans are likely to lose a lot of their principal. But again, these losses are distributed.
I come away impressed with the fact that we are in the midst of what is a major meltdown in a significant market and there appears to be no real systemic distress. The distributed nature of risk among many market participants is actually working as advertised.
Housing Is Weaker than the Data Suggests
But if the subprime debacle poses no systemic risk (i.e., it will not bring about a collapse or serious contraction of the economic system and credit markets), it does pose a serious economic risk to the growth of the US economy.
Housing accounts for about 23% of the US economy, when taking into account all housing-related purchases of furniture, appliances, and items for new homes, according to the Joint Center for Housing Studies at Harvard University in Cambridge, Massachusetts. So if the housing market is in recession, which it is, it is no small potatoes. Let's look at a few recent points of data.
The NAR (National Association of Realtors) says that home sales are off 9%. Real estate analyst John Burns ( http://www.realestateconsulting.com/ ) says that "the housing market has softened much more than is being reported" by the Fed and the NAR. Let's look at some of his research. He gets it from purchasing the actual closing data for 55% of the country. Using this data, home sales are down 22% for the year through April 2007. The largest nationwide real estate brokerage firm reports sales down 18%.
Mortgage applications for home purchase have fallen 18%, even though many buyers now have to fill out several applications in order to get a mortgage. Taking the states with the worst housing sales/foreclosures crises, Burns found Florida home sales down 34%, not 28% as NAR reported; Arizona sales down 38%, not 28%; and California's down 37%, not 24% as NAR reports. This strong underreporting of the collapse by NAR, the firm says, only dates from the middle of 2006; it doesn't claim any intentional misrepresentation by NAR.
As for new-home sales, JBREC reports the Census Bureau is continuing not to subtract cancellations from reported sales, giving sales figures which are much rosier than the grim reality, and these are reported publicly by the Federal Reserve. And cancellations are a big factor, running 40-50% in some markets.
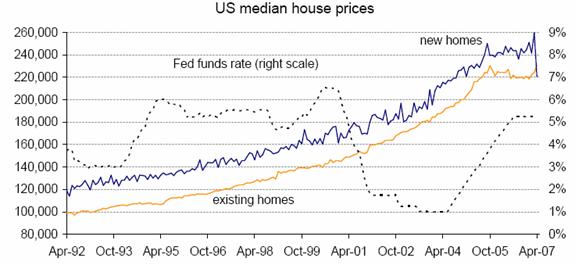
The market was happy when new home sales rose by 16% yesterday. But looking at the data, one should not be quite so impressed. First, prices fell by 11%, the largest monthly drop on record. Homebuilders, taking a page from auto dealers, are "marking them down in order to move them out." Gabriel Stein at Lombard Street Research in London ( www.lombardstreetresearch.com - an increasingly useful source of information to me) comes up with some very useful points on home prices:
"Yesterday, Commerce Department data showed that sales of new homes jumped in the US, although prices fell. Today's data from the National Association of Realtors shows that sales of existing homes fell, although prices rose. Is there a relationship? Almost certainly, yes. The significant development there was that the median price of a new home fell below that of an existing home. Monthly price data for both new and existing homes goes back to 1975. In that period, there is only one brief period - from September 1981 to February 1982 (and only in three of those six months) - when prices of new homes were lower than those of existing homes." As she notes, that period also had a very high stock of unsold homes.
Notice in the chart below that even as the backlog of new homes for sale dropped, the backlog of existing homes for sale is now over 8 months and rising. Ms. Stein tellingly writes:
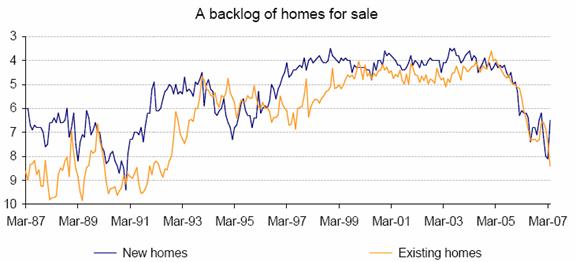
"It is one thing for builders to slash house prices in order to deplete their overhang of unsold homes. They may lose money or at the very least make smaller profits on those houses; but they can then begin to build and sell again. So ultimately, the effect on the contribution of housing investment to output growth will pick up once the shakeout is complete. But it is a different thing when we talk about existing homes. If the owners do not get the price they hope for, their capacity to buy another (bigger?) home will be impaired and, above all, their enthusiasm to go out and spend will be diminished. For now, the median price of an existing home has just barely returned to the level of October 2005; in other words, there are 18 months of no doubt expected house price inflation that did not materialize. Yet the surge in existing homes for sale shows that there is a pent-up need to sell homes - possibly to pay off those now unaffordable subprime mortgages. But homeowners who need to sell cannot really afford to hang in there month after month without a deal. So the implication is that April's price rise was most likely a flash-in-the-pan. If homeowners want to sell, they will have to accept lower prices."
Second in the list of reasons not to be impressed with the new homes sales is that completed home sales were basically unchanged month over month at 31,000 from 30,000. Almost the entire surge was due to "homes not yet started." 40-50% cancellations in the current market are normative.
The good news in the data is that new-home inventory levels are dropping. Well, maybe. The supply of new homes is based on the level of sales per month. The number of months' supply of homes depends on what level of sales you use. And good friend Barry Ritholtz suggests that April may be a one-hit wonder.
"Have a look at this analysis we did a few years ago: It turns out that whenever New Home Sales jump double digits, it usually reflects a mean reversion from the prior (or subsequent) month's reportage. Indeed, over the past 15 years of data, we found that a mean regression followed nearly every double digit monthly gains. Typically, the subsequent month's data was significantly lowered - flat to negative in nearly every case:
"February 1994 was the one exception - it was followed by strong March and April data - but came after January 1994, which has the honor of being the very worst month ever in the history of the Census Construction data : Down -23.77% . In other words, stick with the two or three month average."
And Bill King points out a recent trend in April housing statistics:
"But wait, there's another reason that New Home Sales for April is a dubious number. Our friend Ralph alerted us that in April 2006 New Home Sales were initially reported as +4.9%, but were later revised to a DECLINE of 2.6%. April 2005 was initially reported as +0.2% but was later revised to a DECLINE of 5.1%. Ergo April New Home Sales are suspect because they tend to be overstated initially."
A Wall Street firm reported in May that the foreclosure "shock cone" is widening: while total foreclosures, at all stages, are up 60-70% over last year so far, foreclosure notices - the front end of the process, when a mortgage is typically 90 days delinquent - are 127% higher so far than in 2006. It said that foreclosed homes being resold by banks or lenders are hitting the housing market with an average price drop of 30% nationally. (EIR)
Homes Prices and Consumer Spending Likely to Deflate
With an even larger backlog of homes, it is likely that existing home prices are going to have to drop at least in line with new homes. A 10% drop in existing home prices will be a shock to many recent home buyers, and mean even more foreclosures as ARM (Adjustable Rate Mortgage) re-set to much higher prices. This will mean that an ever-increasing number of homeowners will not be able to keep their homes. This large overhang of homes coming onto the market from foreclosure is going to last for at least a year, as the foreclosures coming onto the market today are from defaults of last year. As noted above, it takes almost a year from default to actual foreclosure, and defaults are rising.
Fitch data suggests that loans made in 2006 are defaulting in the first 12 months at a rate that is 50% higher than in 2003, and that the actual loan to value of the defaulting subprime market was 89%. A 10% drop means than most of these owners will be "under water" in terms of the value of their homes to their loans.
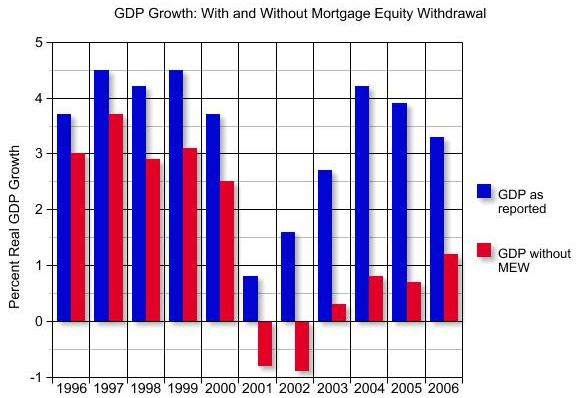
It certainly means that Mortgage Equity Withdrawals (MEWs) are going to be much harder to obtain. And this will be even more pronounced with much tighter credit standards. And, in a chart readers are familiar with, MEWs are responsible for a good deal of the growth we have seen in the past few years; and the declining MEWs, along with a softer housing market, are now a drag on the economy.
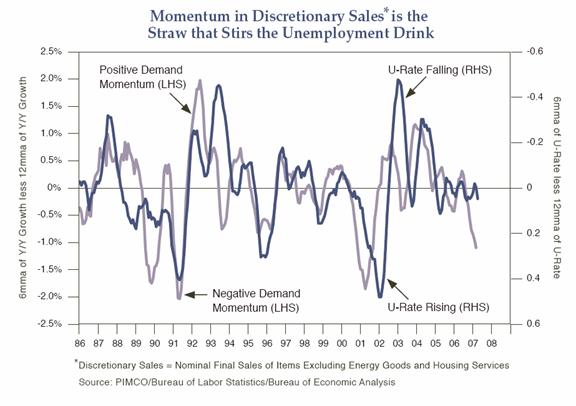
Finally, between a decrease in MEWs, increases in home costs due to rising taxes and interest rates on adjustable-rate mortgages, along with increases in the cost of food and energy, there is less available discretionary income to spend. Good friend Paul McCulley sent me a copy of his latest piece, which will appear next week at www.pimco.com . It shows that falling discretionary sales (which is nominal sales of items excluding Energy Goods and Housing Services) is tightly correlated with the unemployment rate. The chart below suggests that unemployment may be getting ready to rise. All in all, not an environment that will be good for housing and the mortgage market.
Planes, Trains, Automobiles, and We're #30
This weekend sees my youngest and #3 son Trey turn 13. He officially becomes a teenager. The whole clan will gather for the celebration, with the twins driving in from Tulsa. Another era says goodbye, as I will have no more "young" kids (for the record, the kids are 30, 27, 26, 22 and 22 (almost), 18, and 13). Where does the time go?
Monday I leave for Edinburgh, getting ready for a speech on Thursday, meetings on Friday, a long day flying to get to Barcelona, then Madrid, Malta, Zurich, and Geneva, coming back the following Sunday. I am flying Delta over the pond for the first time in a long time, as normally I fly American. Be interesting to see the difference. But I will be on 13 flight and train segments on this trip, so it will be a little tiring. I do get a day in Edinburgh and another in Barcelona to look around, and am looking forward to it. And a new friend is taking me to lunch next to the 18th green at St. Andrews, so I get to have a little "spiritual" experience as well. I still have some spots open in my schedule, but Tiffani (#1 daughter and the person who really runs the business) is filling them up fast. You can write to her by hitting reply to this letter.
The Texas Rangers are playing the Boston Red Sox, in a rain-delayed game as I finish this letter. My office is physically in the Ballpark in Arlington, and my office balcony is closer than some center field seats. Normally, I can work through games when I am on deadline. However, Dice-K (Daisuke) Matsuzaka from Japan, all $51 million of him, is pitching for the Red Sox, and I must admit I have had to get up and walk out on the balcony and watch every now and then. And even though the Rangers are the worst team in baseball (we're # 30! we're #30!), we just tagged this new phenom for five runs in the bottom of the 5th. We'll see if we can hold on. (Maybe then we can say "We're #29!" Sigh.) Nope, the Bosox just scored two to re-take the lead. (double sigh), and now it is 10-5. (More sighs.)
I see a weekend of parties with the family, Pirates of the Caribbean 3 , and a special exhibit called BodyWorlds, an exhibition of the human body at the Museum of Science and History. With packing, lots of home chores, and more it will be a busy weekend. Time to hit the send button and get it started.
Have a great Memorial Day weekend. And let's remember our soldiers who are the reason for the weekend.
Your looking forward to Europe (but not the airports) analyst,
By John Mauldin
Frontlinethoughts.com
To subscribe to John Mauldin's E-Letter please click here: http://www.frontlinethoughts.com/subscribe.asp
Copyright 2007 John Mauldin. All Rights Reserved
John Mauldin is president of Millennium Wave Advisors, LLC, a registered investment advisor. All material presented herein is believed to be reliable but we cannot attest to its accuracy. Investment recommendations may change and readers are urged to check with their investment counselors before making any investment decisions. Opinions expressed in these reports may change without prior notice. John Mauldin and/or the staff at Millennium Wave Advisors, LLC may or may not have investments in any funds cited above. Mauldin can be reached at 800-829-7273.
Disclaimer PAST RESULTS ARE NOT INDICATIVE OF FUTURE RESULTS. THERE IS RISK OF LOSS AS WELL AS THE OPPORTUNITY FOR GAIN WHEN INVESTING IN MANAGED FUNDS. WHEN CONSIDERING ALTERNATIVE INVESTMENTS, INCLUDING HEDGE FUNDS, YOU SHOULD CONSIDER VARIOUS RISKS INCLUDING THE FACT THAT SOME PRODUCTS: OFTEN ENGAGE IN LEVERAGING AND OTHER SPECULATIVE INVESTMENT PRACTICES THAT MAY INCREASE THE RISK OF INVESTMENT LOSS, CAN BE ILLIQUID, ARE NOT REQUIRED TO PROVIDE PERIODIC PRICING OR VALUATION INFORMATION TO INVESTORS, MAY INVOLVE COMPLEX TAX STRUCTURES AND DELAYS IN DISTRIBUTING IMPORTANT TAX INFORMATION, ARE NOT SUBJECT TO THE SAME REGULATORY REQUIREMENTS AS MUTUAL FUNDS, OFTEN CHARGE HIGH FEES, AND IN MANY CASES THE UNDERLYING INVESTMENTS ARE NOT TRANSPARENT AND ARE KNOWN ONLY TO THE INVESTMENT MANAGER.
© 2005-2022 http://www.MarketOracle.co.uk - The Market Oracle is a FREE Daily Financial Markets Analysis & Forecasting online publication.