


Stock & Commodity Markets Bullish Trends and Significant Corrections
Stock-Markets / Stock Index Trading Jun 22, 2009 - 11:29 AM GMTBy: Chris_Ciovacco

 We were recently asked by a client, "If you see signs of a possible new bull market, why are we still sitting on so much cash?" It can be answered by using a fence analogy. We have been taking some smaller positions while maintaining a relatively high cash position in order to play both sides of the fence:
 The Far Side Of The Fence: If stocks move lower,
- Our smaller positions reduce risk during a correction, and we have cash on hand to invest during/after a correction. If the bear market resumes (anything is possible), we have less exposure to losses with some cash on hand.
- Numerous asset classes have had significant moves off the March 2009 lows.
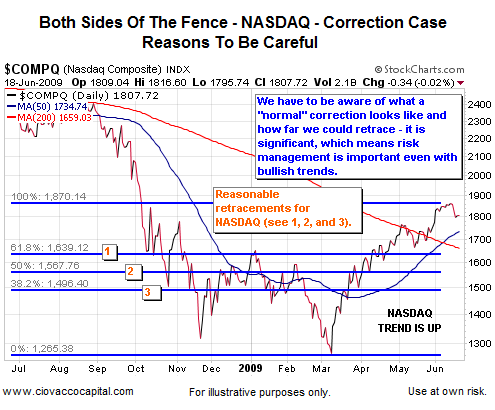
- Even markets which have a positive trend, correct from time to time.
- Corrections, within the context of an uptrend, can be significant.
- If a correction is orderly, we can use cash to enter markets at lower levels.
- If the correction is not orderly and a resumption of the bear looks more likely, cash and smaller positions enable us to better manage risk. If your investments lose 12%, but you have 50% of your account in cash, the loss to your account is 6%.
- As our strategy dictates, we gradually make the transition from a bear market portfolio to a bull market portfolio, and remain aware we could be wrong about bullish outcomes. If we are wrong, we stop the transition and reverse course gradually.
- The NASDAQ can help illustrate the correction side of the fence (see chart below).
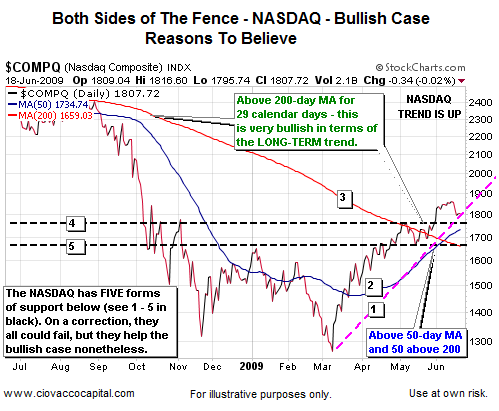
The Near Side Of The Fence: If stocks continue to move higher,
- We have an opportunity to participate.
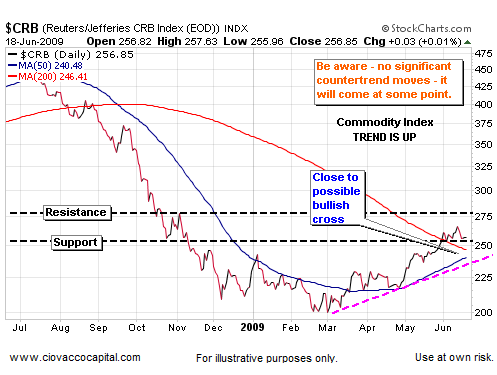
- In the 2007-2009 bear market, markets came down rapidly with little in the way of countertrend moves, which means it is possible a similar situation may occur on the way back up – a rapid climb with little in the way of significant countertrend moves (which is what has happened so far during this rally). It is possible those who wait for a significant correction, will only get that opportunity from much higher levels. A significant correction is coming - the question is from what levels (now or later).
- In early June, numerous asset classes “broke out” above resistance levels which can offer a lower risk entry point since what was resistance becomes support.
Our approach takes into account that markets have historically demonstrated they can do anything at anytime, especially in the short-run. Markets do not always follow a pattern or take the path associated with the higher probability outcome (breakouts can fail). We should always be thinking in dual probabilities – what happens if we are right?.....what happens if we are wrong? In recent weeks, the questions we asked ourselves were, "What happens if the breakouts are successful and the markets move rapidly higher to fill gaps in the charts?" and, "What happens if the breakouts fail and we see a significant correction?" We still do not know the answers to these questions – we will have a better idea based on how we finish up this week. If we close below breakout levels on weekly charts, it would add weight to the correction argument..
Fair and Balanced
Before we display charts that clearly demonstrate the current shift which is taking place from risk aversion to acceptance of risk, we would be remiss in not mentioning some concerns:
(1) Capacity utilization is at extremely low levels which is disinflationary (poor pricing power for companies), and
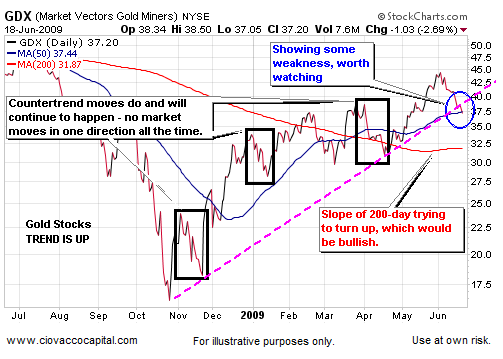
(2) while numerous markets remain above their 50 and 200-day moving averages (MA), most 200-day MAs still have a negative slope. What does the negative slope tell us? It could mean that more basing (sideways action) is needed before we can move higher. However, as stated above, we came down at a faster rate than history would have suggested, which means we could move up at a faster rate than history would suggest. As mentioned in the past, having a market trade above its 200-day MA means little if it cannot hold above the 200-day. The S&P 500 is testing its 200-day MA this week. Failure would not mean a resumption of the bear, but it would put a dent in the bullish case for the short-to-intermediate term (20 to 100 calendar days).
Failure does not mean closing below the 200-day MA – it means closing below the 200-day and remaining below it for more than a few days. A break of 826, and more importantly 779, on the S&P 500 would be big wins for the bears. Any correction which holds above those levels, would look like a typical correction, and thus, keep the bulls in control. Unless the economic news starts to deteriorate again (which is possible), recent strength in numerous asset classes points to buyers stepping in at lower levels to take advantage of an opportunity to 'get back in'.
However, if the buyers are spooked with worse than expected news and a violent and disorderly market decline, they may sit on their hands and let the bears regain control of the market. Our job is to pay attention with an open mind. For now the bulls remain in control and we should assume they will remain in control until we see evidence to the contrary. While the markets have shown signs of hesitation on low volume, the bears have not been able to do any meaningful damage yet. As we enter Friday’s trading day the 200-day MA on the S&P 500 sits at 904 and the 50-day MA at 895. On a shorter-term basis, the bears have taken the 20-day MA which sits at 924. A close above 924 would be a small win for the bulls.
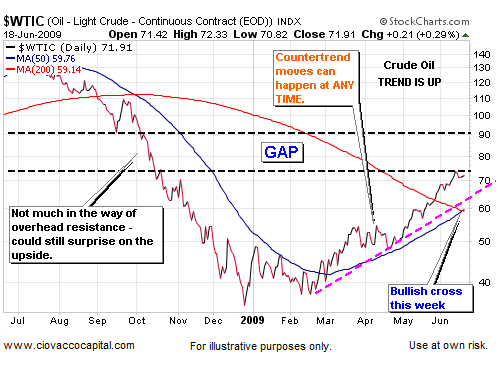
Below is an updated version of the chart we presented last week. The only change is a bullish one - crude oil's 50-day MA crossed its 200-day MA this week.
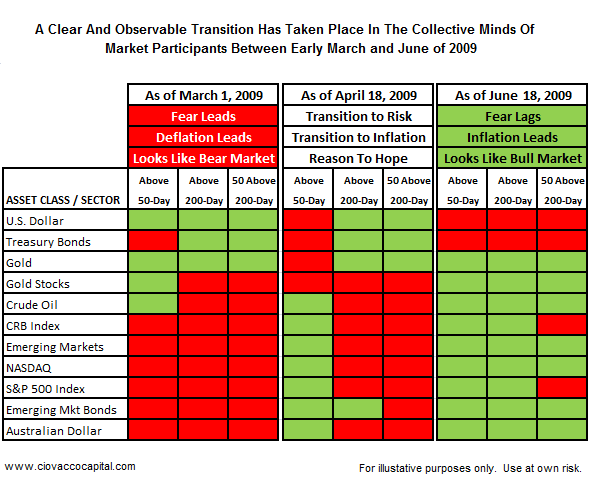
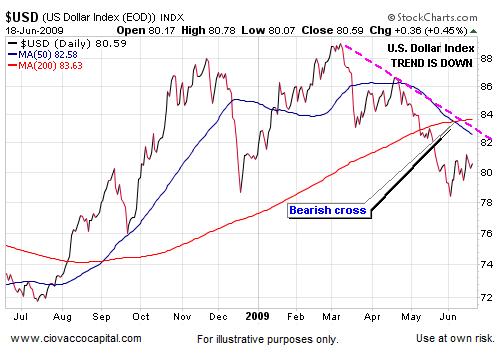
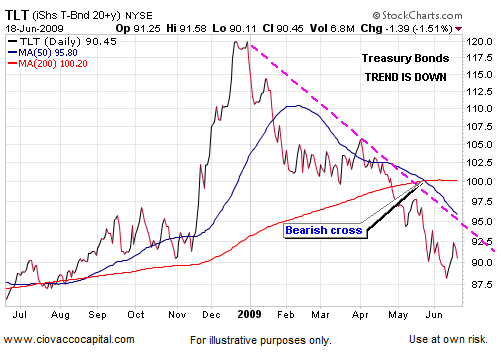
Bearish Charts - Defensive Assets
Since the U.S. Dollar and U.S. Treasury bonds represent defensive assets, a bearish trend is bullish for risk assets. A clear shift has taken place in both these charts.
Bullish Charts - Risk Assets
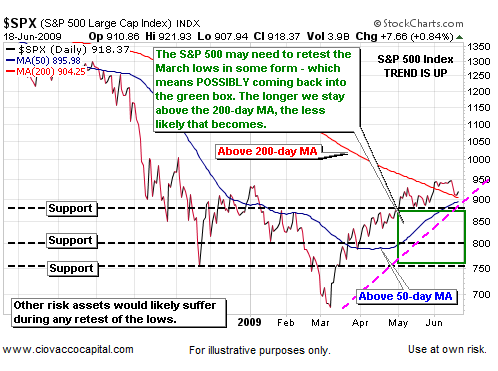
Risk asset classes have also undergone a bullish transition. Remember, a bullish chart and a bullish trend do not mean that we can ignore (a) the real possibility of significant countertrend rallies, and (b) that trends cannot change. We assume we will see more of the same until we see hard evidence to the contrary. In the case of the charts below, we assume bullish outcomes, until visible bearish indications emerge. Below, we will start with a bullish chart of the S&P 500 that points out the possibility of a retest of the March 2009 lows.
Reminder...No Forecasting
In case you missed it last week, we discussed the problems associated with forecasting and the need to keep an open mind. You can see those comments near the bottom of If It Looks Like A Bull... (scroll down and see text below heading Check Your Forecast At The Door).
These comments, taken from a portion of an update for CCM clients, may not pertain to or be appropriate for many investors based on their risk tolerance and situation. They are presented for educational purposes only.
By Chris Ciovacco
Ciovacco Capital Management
Copyright (C) 2009 Ciovacco Capital Management, LLC All Rights Reserved.
Chris Ciovacco is the Chief Investment Officer for Ciovacco Capital Management, LLC. More on the web at www.ciovaccocapital.com
Ciovacco Capital Management, LLC is an independent money management firm based in Atlanta, Georgia. As a registered investment advisor, CCM helps individual investors, large & small; achieve improved investment results via independent research and globally diversified investment portfolios. Since we are a fee-based firm, our only objective is to help you protect and grow your assets. Our long-term, theme-oriented, buy-and-hold approach allows for portfolio rebalancing from time to time to adjust to new opportunities or changing market conditions. When looking at money managers in Atlanta, take a hard look at CCM.
All material presented herein is believed to be reliable but we cannot attest to its accuracy. Investment recommendations may change and readers are urged to check with their investment counselors and tax advisors before making any investment decisions. Opinions expressed in these reports may change without prior notice. This memorandum is based on information available to the public. No representation is made that it is accurate or complete. This memorandum is not an offer to buy or sell or a solicitation of an offer to buy or sell the securities mentioned. The investments discussed or recommended in this report may be unsuitable for investors depending on their specific investment objectives and financial position. Past performance is not necessarily a guide to future performance. The price or value of the investments to which this report relates, either directly or indirectly, may fall or rise against the interest of investors. All prices and yields contained in this report are subject to change without notice. This information is based on hypothetical assumptions and is intended for illustrative purposes only. THERE ARE NO WARRANTIES, EXPRESSED OR IMPLIED, AS TO ACCURACY, COMPLETENESS, OR RESULTS OBTAINED FROM ANY INFORMATION CONTAINED IN THIS ARTICLE. PAST PERFORMANCE DOES NOT GUARANTEE FUTURE RESULTS.
Chris Ciovacco Archive |
© 2005-2022 http://www.MarketOracle.co.uk - The Market Oracle is a FREE Daily Financial Markets Analysis & Forecasting online publication.