Dangerous Divergences in the Global Bond and Stock markets
Stock-Markets / Global Financial System Jun 05, 2007 - 01:49 PM GMTBy: Gary_Dorsch
 Once upon a time, many years ago, the US stock market lived in fear of a violent band of traders known as the “bond market vigilantes”. Whenever the Federal Reserve's money supply measures grew too rapidly, or the US economy grew too strongly threatening to stoke higher inflation, the “bond vigilantes” would take matters into their own hands, by jacking-up 30-year Treasury bond yields as much as 25 basis points or short-term T-bill rates by 50 basis points in a single day.
Former US Treasury secretary Robert Rubin convinced his boss, President Bill Clinton that taming the “bond vigilantes” by reducing the budget deficit was the best way to reach long-term economic prosperity. As Clinton political guru James Carville famously put it, “I used to think if there was reincarnation, I wanted to come back as the president or the Pope or a .400 baseball hitter, but now I want to come back as the bond market. You can intimidate everybody,” he once quipped.
But during the first Bush administration, when the Treasury's budget was spinning out of control with a $445 billion deficit in fiscal 2004, the infamous “bond vigilantes” slipped into hibernation. Instead, a new band of traders with much deeper pockets, the Bank of Japan, the People's Bank of China, and the Arab Oil kingdoms were cornering the US Treasury market, and keeping yields pinned near historic lows.
Tokyo and Beijing acquired a combined $2.1 trillion of foreign exchange reserves, mostly held in US dollar bonds, thru massive intervention to keep the yen and yuan weak, and plowed their newly acquired dollars into US bonds. Today, Japan owns $612 billion of US Treasuries, after purchasing $334 billion US dollars in 2003-04. Beijing owns $420 billion of US Treasuries, and more than $500 billion of US agency and corporate bonds, with little regard for the outlook for inflation.
As crude oil prices more than doubled to over $65 per barrel, OPEC's oil revenue reached $968 billion in 2006 from around $300 billion in 2002, Arab Oil kingdoms invested about $314 billion into the US Treasury market thru their London brokers, representing one-fourth of the $1.3 trillion of petrodollars invested globally over the 3-years. Last week, the US Treasury said holdings of US securities by foreign central banks and governments rose to $2.3 trillion by the end of June 2006.
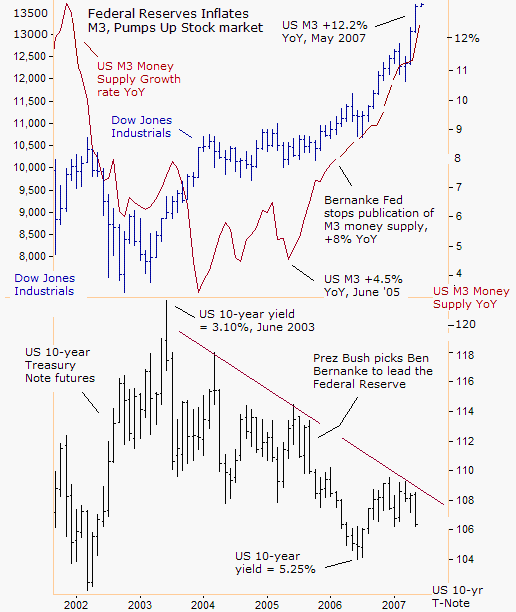
Perhaps, the most important single factor allowing the global economy to grow at 5% or more for each of the past four years has been historically low bond yields, courtesy of Asian central banks and Arabian petrodollars. Indirectly, abnormally low bond yields spawned $1.5 trillion of US mergers and takeovers in 2006, and $1 trillion so far this year, up 70% from the same period a year earlier. Globally, M&A mushroomed to $3.6 trillion in 2006 and $1.9 trillion so far this year.
Also behind the boom in global stock markets, hedge-fund assets tripled in the past decade to $1.57 trillion, and private- equity companies are bidding $447 billion for companies so far this year, versus $228 billion in the year-ago period. Corporate treasurers are exploiting the gap between the low yield on bonds and the earnings yield on stocks through record share buybacks, driving equity prices sharply higher.
The Bernanke Fed is also operating behind the curtain, inflating the broad M3 money supply at an annualized 12.2% rate, its fastest clip in 5-years. Each morning, before the opening of the NYSE, the Bernanke Fed buys Treasuries to accommodate strong loan demand from private equity groups and leveraged takeover artists, and prevent short-term borrowing rates from rising.
The global stock buying frenzy might not have been possible, if the “bond vigilantes” weren't sedated by Arab Oil kingdoms, China, Japan, and other central bankers.
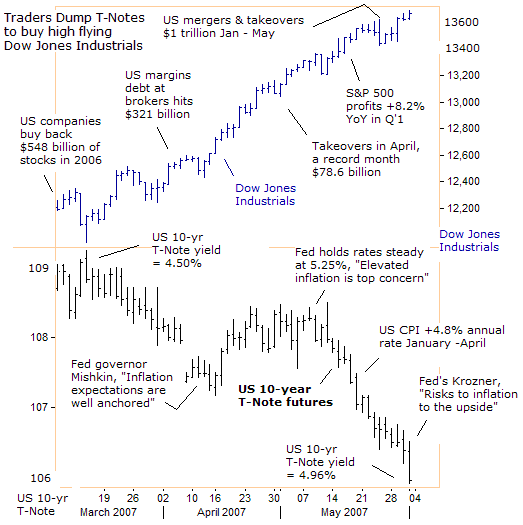
But interestingly enough, when the Dow Jones Industrials climbed above the psychological 13,000 barrier for the first time, the “bond vigilantes” began to crawl out of their cave. On June 1st, the Treasury's 10-year yield rose to 4.96%, its highest level in nine-months. Treasury yields were rising despite news that the US economy slowed to a scant 0.6% growth rate in Q'1, its weakest in 4-½ years, largely due to a sharp downturn in the housing sector.
Fed officials believe the correction in the housing market is likely to “weigh heavily” on economic growth for the remainder of the year, but “the risk that inflation would fail to moderate as desired remained the committee's predominant concern,” the Fed said on May 30th. So as hopes fade for Fed rate cuts this year, traders are dumping long-term T-Notes in favor of high flying US and foreign stocks.
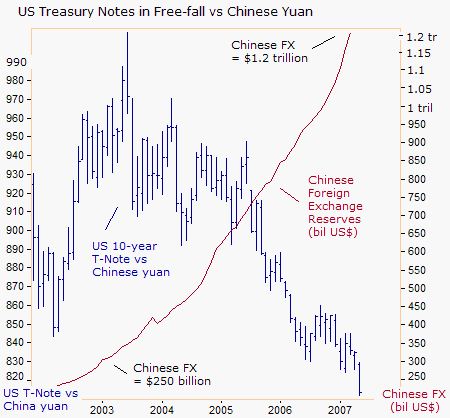
The “bond vigilantes” might have greater room to maneuver in the months ahead, as Beijing observes its massive US bond portfolio, estimated at over $900 billion, slide into a free-fall, when depreciating US dollars are converted back into Chinese yuan. China's massive $233 billion trade surplus with the US last year is going up in smoke, even before the “bond vigilantes” have a good crack at the bat.
China controls $1.2 trillion in foreign exchange reserves and steady purchases of longer-dated Treasuries could evaporate, after the PBoC widened the trading band for the yuan on May 18th, allowing for a swifter devaluation of the US dollar. Beijing could decide to recycle its massive trade surplus into riskier assets.
But Fed chief Ben Bernanke is not worried about Beijing dumping US bonds in the future. “I think the cost to them of doing this would be greater than the cost to us. A substantial move on their part would be disruptive in the market in the short term, but in the longer term, the dollar and Treasury yields would largely recover,” he told the Senate Banking Committee on Feb 14th.
“I do not believe China's substantial accumulation of reserves (recycled into US bonds) in itself represents a problem for the United States or for US monetary policy,” Bernanke wrote on March 26th. “Because foreign holdings of US Treasury securities represent only a small part of total US credit market debt outstanding, US credit markets should be able to absorb without great difficulty any shift of foreign allocations," he said in a letter to Sen. Richard Shelby, an Alabama Republican.
“And even if such a shift were to put undesired upward pressure on US interest rates, the Federal Reserve has the capacity to operate in domestic money markets to maintain interest rates at a level consistent with our economic goals,” Bernanke added. Would Bernanke speed up the printing presses to buy bonds from Beijing?
Bond Vigilantes Unleashed in Europe
While American bond vigilantes are just stepping into the batter's box, the German bund vigilantes are already on first base, jacking up European benchmark yields to multi-year highs. Germany's 10-year bund yield rose to 4.48% this week, its highest since Dec' 2003, while 2-year yields climbed to 4.42%, a five-year high.
“Euro zone inflation risks are rising and the European Central Bank is keeping its options open on how much further to raise interest rates,” said Greek central banker Nicholas Garganas on May 30th. “All the options for a further increase in interest rates and the pace and size of further adjustment are open. Inflation risks are on the upside and increasing,” he warned.
“A number of factors are pointing to an inflation rate which is higher than expected so far this year,” Garangas said, pointing to strong money and credit growth, higher oil prices, and lower unemployment. “The ECB needs to exercise strong vigilance to keep price pressures in check,” warned Bundesbank chief Axel Weber on May 16th.
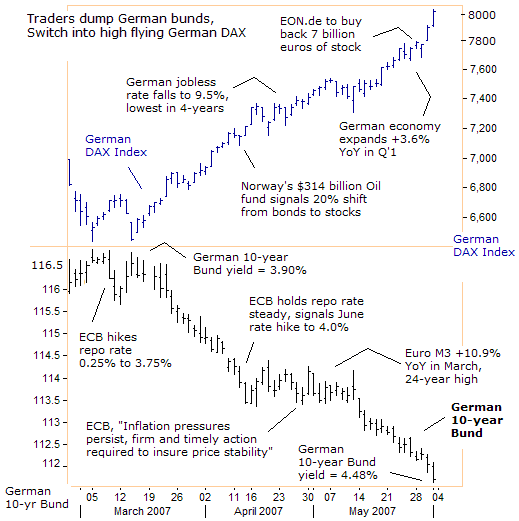
Since March 13th, Euro zone traders have been dumping German bunds and switching into high-flying European blue chips stocks. The ECB has spoken a million words about the risks of higher inflation, but has only lifted its repo rate a quarter-point this year. The ECB has tolerated explosive growth of the Euro M3 money supply, which hit a 24-year high of 10.9% in March, far above the central bank's target of 4.5%, which it believes is consistent with low inflation.
“It would be unwise to discard monetary analysis, especially now that asset prices are at a high and liquidity at an unprecedented scale worldwide,” warned the BBK's Weber on June 3rd. “Interest rates are low in the Euro area,” said Dutch central bank chief Nout Wellink on June 4th. “These low interest rates show up in asset prices, not only in the stock market, but also the housing market and other financial markets.
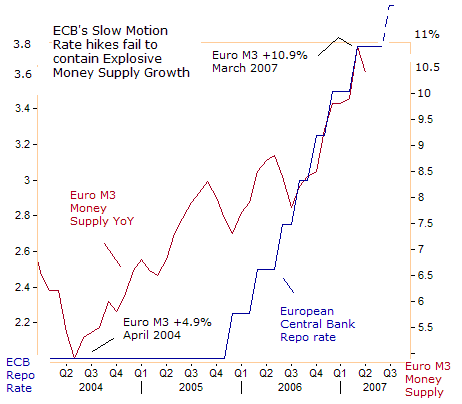
The ECB's slow-motion tightening strategy hasn't restrained the growth of the European money supply. In fact, Euro M3 money supply is growing at a much faster rate today, than when the ECB began raising its repo rate in December 2005. While the mainstream media points to ECB rate hikes as proof of a tighter monetary policy, double-digit Euro M3 growth points to a super-easy ECB money policy.
The ECB pursues a clandestine policy of pumping up European real estate and stock markets, to boost consumer confidence and spending at home by inflating M3. The ECB's sleight of hand is part of its game of “Smoke and Mirrors” designed to lull German “bund vigilantes” to sleep, while it quietly pumps up asset markets.
But the Norwegian government recognized the shell game on April 13th, and said it planned to raise the equity component of its $314 billion oil fund to as much as 60% of total assets from 40%, while reducing the portion held in bonds. According to the Norwegian Pension Fund's 2006 report, it owned 154 billion crowns ($25.7 billion) of German Bunds, and 44 billion crowns in European Investment Bank bonds.
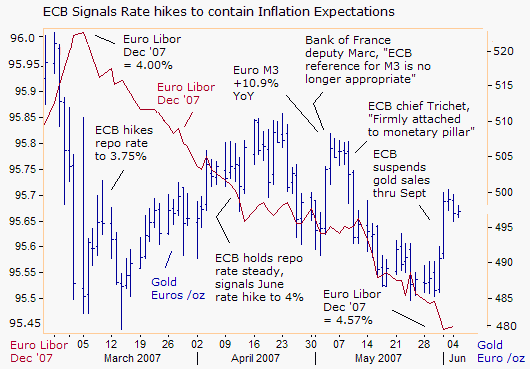
To restore its badly tarnished image of an inflation fighter, the ECB has telegraphed a quarter-point rate hike to 4.00% in June, and to 4.25% by September. The ECB was forced into the tightening mode, since gold is flirting with the psychological 500 euros /ounce. In Frankfurt, Euro Libor traders are pricing in the possibility of a third ECB rate hike to 4.50% by year's end.
So it was surprising that on June 1st, the ECB decided to suspend its remaining share of gold sales thru Sept 26th. That gave a small shot of adrenalin to the gold market, jumping back to 500 euros per ounce, and lifted the yield on the Euro Libor rate for December by 7 basis points to 4.57 percent. Stubbornly high gold prices in Europe provide more fodder for the German “bund vigilantes” in Frankfurt, whose set the benchmark yields for the rest of the Euro zone.
The Bank of England faces a Backlash
For the past three years, the ECB has operated under the same modus operandi as the Bank of England, inflating the money supply to buoy home and equity markets. But last week, the British gilt vigilantes, who have been locked in a tight box for the past eight years, came very close to breaking out. Two-year British gilt yields climbed to 5.78% on June 1st, a level not seen since in seven years. Ten-year gilt yields climbed to 5.28%, the highest since mid-2002.
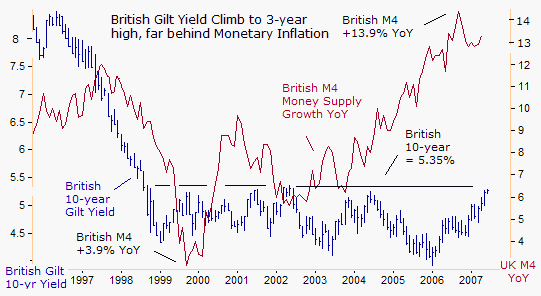
For the past eight years, the UK's 10-year Gilt yield has been locked in a tight range between 4.00% and 5.35%, benefiting from foreign capital inflows seeking to profit from an appreciating British pound. But how much longer can the long-term Gilt market ignore the monetary abuse of the BoE? On April 24th, a group of leading UK economists including former BoE member Charles Goodhart criticized the BoE for ignoring double-digit growth of the money supply since 2005.
A week later, BoE chief King admitted that, “the growth of money and credit may signal in advance of other indicators that the Bank rate is set at a level inconsistent with bringing inflation back to the target in the medium term,” he said. On May 10th, the BoE lifted its base lending rate by a quarter-point to a 6-year high of 5.50%, with consumer inflation raging at 3.1% it's highest in more than a decade.
But UK house prices jumped 0.9% in April and 0.5% in May, even after three BoE rate hikes, and stand 10.3% higher from a year ago. The price of a typical UK house is 181,584 pounds, or about 17,000 pounds higher than at the same time last year. Not surprising, with the UK's M4 money supply standing 13.3% higher from a year ago.
Asian Bond Vigilantes Lift Yields a half-percent
The Korean Kospi Index has been on a record-breaking rally over the past two months, and is up 20.6% so far this year, surpassing the 1,700-point mark for the first time, after extending gains for a 13th straight week. A quarter of listed Kospi stocks rose 50% or more this year, and 8% of Kospi stocks are up more than 100%.
South Korea's economy, Asia's third-largest after Japan and China, has expanded for 16-quarters in a row, marking the longest winning streak since the 1990's. Behind the scenes, the Bank of Korea (BoK) is inflating its M3 money supply, buoying stock prices but rattling the bond market. ( A 5-year graph of the Korean M3 money supply and Koribor rates is presented in the June 8th edition of Global Money Trends ).
The Korean central bank lifted its overnight loan rate by 125 basis points to 4.50% last year, and raised bank reserve ratios by 2% to 7%, but in defiance of its baby-step tightening maneuvers, Korea's M3 money supply exploded from a 7% growth rate to an annualized 12.3% in April 2007, its fastest rate in 4 ½-years.
Korean housing prices are growing four times as fast as consumer prices. Housing prices across South Korea were 9.7% higher in May than a year before, compared with a 2.3% annual rise in consumer prices. Despite the explosive growth of the money supply, coupled with a strong economy, the BoK is holding its overnight loan rate steady at 4.50% for a tenth consecutive month.
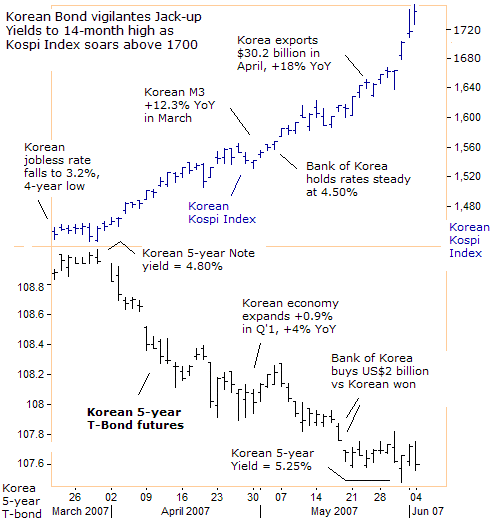
Korean “bond vigilantes” are alarmed by the BoK's super-easy money policy, and have jacked up the government's borrowing costs by 50 basis points over the past three months. Seoul plans to sell 3.74 trillion won ($4 billion) of Treasury bonds in June, compared with 4.45 trillion won worth offered in May, adding to bearish sentiment. But the half-percent increase in 5-year yields hasn't been sufficient to knock the Kospi Index off its upward trajectory.
“Abundant global liquidity is one of the risky factors that all countries need to monitor,” South Korea's finance minister Kwon O-kyu told reporters on May 17th. “We have to monitor how much the US economy slows down and how much growth in China and India can compensate. Global liquidity may be maintained for some period but the China effect cannot continue for ever,” he warned.
The Bank of Korea is disturbed by the double-digit growth of the M3 money supply. So what's preventing the BoK from raising its interest rates, and what other powerful force in the global marketplace helps Korean Kospi Index to defy the law of gravity? The answers are inter-related and were provided in the June 1st edition of Global Money Trends ).
Aussie Bond Vigilantes dig deeper “Down Under”
Australian bonds have lost considerable ground in recent weeks as Aussie traders dumped safe-haven government debt, in favor of riskier stocks. Australian bond futures fell to their lowest in three years on June 5th, with Aussie “bond vigilantes” taking their cue from bears in Asia, Europe, and North America. The Aussie 10-year bond yield broke thru the psychological 6% barrier last week, and a break-out above 6.20% would send yields to their highest since 2002.
The latest slide in Aussie bonds has caught many traders off guard, since the Reserve Bank of Australia (RBA) is expected to leave its cash lending rate unchanged at 6.25% for the remainder of the year. On April 23rd, the Australian statistics bureau said the local consumer price index climbed 0.1% in the first quarter, lowering the annual rate of inflation to 2.4% from 3.3% in the previous quarter.
That left the CPI in the middle of the RBA's 2% to 3% inflation target. But not all Aussie bond traders are duped by inflation statistics conjured up by government apparatchniks. Instead, Australia's jobless rate fell to 4.4% in April, to a 32-year trough and stoking concerns that a super-tight labor market would eventually threaten higher inflation and interest rates
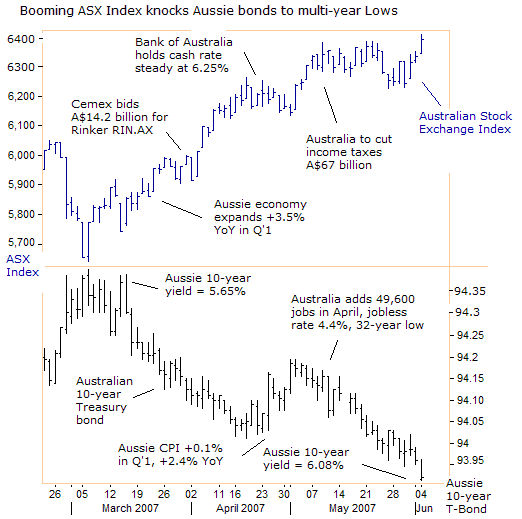
While the mainstream media puts its faith in doctored-up government statistics on inflation as gospel, Aussie “bond vigilantes” are following the money. The Australian bank's cash rate of 6.25% might sound high compared to other countries, but in reality, the RBA is pursuing a super-easy money policy, allowing its M3 money supply to expand at an explosive 13.7% annualized rate. ( A fascinating graph of the Aussie M3 money supply and Libor rates is included in the June 8th edition of Global Money Trends ).
What's most interesting about the Australian bond market is that the government barely issues enough new paper to cover maturities. Flush with cash after a string of budget surpluses, Aussie bonds outstanding are around A$60 billion, down from around A$94 billion when Prime Minister John Howard came to power in 1996. That is in sharp contrast to the United States where total public debt has ballooned by 50% since the turn of the century to reach $8.8 trillion.
Foreigners have become big buyers of Australian government bonds and hold around 75% of all marketable debt, up from just 30% in the early 1990's. So the task of the Aussie “bond vigilantes” in jacking-up Treasury bond yields is daunting, given the small supply of T-bonds outstanding, and the insatiable appetite of Asian central bankers. But a super tight jobs market, a booming economy, explosive growth of the M3 money supply, and a new round of $A67 billion in income tax cuts, gives the Aussie “bond vigilantes, plenty of ammunition to work with.
Canadian Bond Vigilantes Flex some Muscle
Canadian “bond vigilantes” have chipped away at government bond prices for the past three months, following a slew of economic data that paints a picture of a red-hot economy and higher inflation. The Canadian economy grew 3.7% in the first quarter of 2007, compared with 1.5% in the previous quarter, setting the stage for a new round of Bank of Canada rate hikes.
Canada's commodity exports are booming and the core rate of inflation is above target at 2.5% in April. “On balance, the bank judges that there is an increased risk that future inflation will persist above the 2% inflation target. And some increase in the target for the overnight rate may be required in the near term to bring inflation back to target,” the Bank of Canada warned on May 29th.
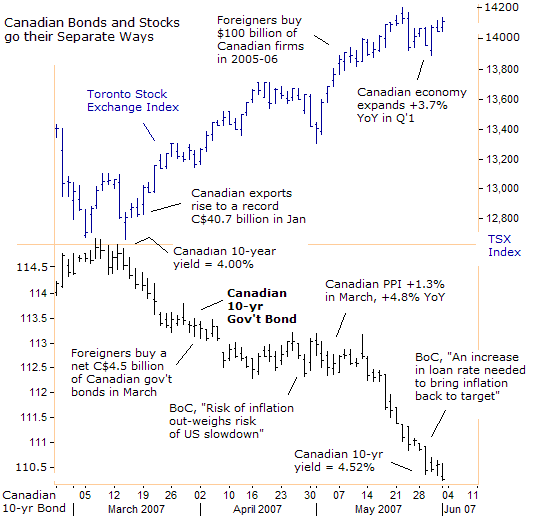
Canadian bond vigilantes are grinding government paper lower, even as Ottawa pays off some of its national debt. After paying down C$13.2 billion on Canada's national debt in September 2006, the budget for 2007 further reduces the debt by C$9.2 billion, which would bring the balance down to C$472.3 billion, or 35% of GDP, a 25-year low. Canada's federal debt has fallen by C$81.4bn over the past decade.
The inflation alarm bells went off in the Canadian bond market, because the central bank miscalculated the underlying strength of the economy and permitted its M3 money supply to expand at double-digit rates in April. Canada's M3 money supply surged from 6.3% in June 2006 to a 10% growth rate in April, after the central bank made a pre-mature decision to pause its rate hike campaign at 4.25%.
( A cool graph of the Canadian M3 money supply and the Bank of Canada's overnight loan rate is presented in the June 8th edition of Global Money Trends ). In order to rein-in the M3 growth rate, the BoC must narrow the interest rate gap with the US fed funds rate of 5.25%. That's lifted the Canadian dollar to 30-year highs against the US dollar, which can help shield Canada from higher import prices.
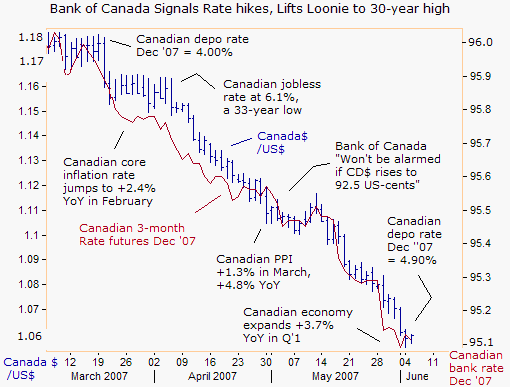
Prime Minister Stephen Harper gave a thumbs-up to a stronger Canuck buck on May 31st. “The rising Canadian dollar is a reflection of the underlying strength of the Canadian economy. Interfering with the currency's appreciation to save manufacturing jobs would be a huge mistake,” Harper said. The energy and mineral based economy in western Canada, has been the driver of economic growth.
Natural resources have outperformed the weakening manufacturing sector in Ontario and Quebec, which has been hard hit by a high Canadian dollar and troubles in the lumber and paper industry. Overall, Canada's unemployment rate has not budged from 6.1%, a 33-year low, for three straight months, so with the BoC set to rekindle its tightening campaign in the weeks ahead, the Canadian “bond vigilantes” have plenty of ammunition to work with in the months ahead.
Dangerous Divergences and the Chinese “Bond Vigilantes”
It's easy to say that what goes up, must come down. But stock markets don't necessarily follow the laws of Newtonian Physics. The Russian Trading System Index stays perched in the stratosphere, with the Russian central bank inflating its money supply at a 57% annualized rate. Central banks have to make a determined effort to deflate stock market bubbles, even at the cost of a slower economy.
Explosive money supply growth, stock buybacks, and mergers and takeovers, are all linked to the super easy money policies, within the context of a larger game of competitive currency devaluations. However, the most powerful force moving global stock markets today, wasn't even mentioned in this article, but is highlighted in each weekly edition of the Global Money Trends newsletter. So far, this powerful force moving stock markets shows no signs of abating, but what are the early warning signals of a possible reversal of the market's good fortune?
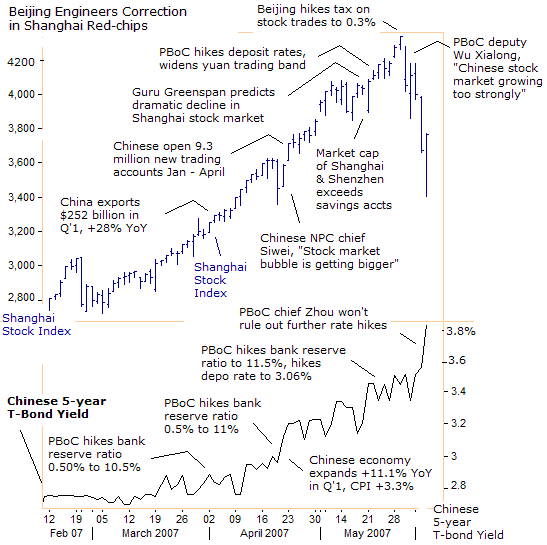
In Shanghai, the Chinese “bond vigilantes” have jacked-up yields on the benchmark 5-year Treasury bond by 105 basis points over the past two months, to 3.82% today, the highest in 3-years, and including a 50 basis point surge over the past 2-days. While the mainstream media points to Beijing's tiny 0.2% tax increase on stock transactions to explain the wicked 21% correction in Shanghai red-chips, quietly, little is spoken of the Chinese “bond vigilantes,” emerging from hibernation.
On May 23rd, Guru Al Greenspan said the recent boom in Chinese stocks could not last. “It is clearly unsustainable. There's going to be a dramatic contraction at some point,” he correctly predicted, but did not say why. On May 31st, PBoC deputy Wu Xiaoling told a seminar on global imbalances, “In my view, every market develops in twists and turns. The Chinese stock market is growing too rapidly. We hope it can grow in a steady manner,” Wu said.
At its peak, the combined market value of the two bourses in Shanghai and Shenzhen hit a record $2.5 trillion, exceeding the country's savings deposits for the first time in history. The value of shares in China surged more than six-fold in the past two years, to become the world's fifth-biggest equity market
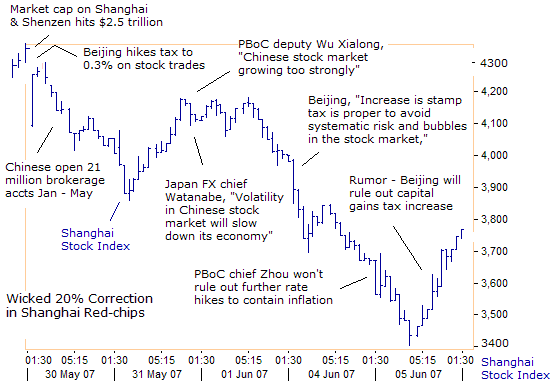
Policy makers were not sympathetic to the plight of over zealous red-chip bulls on June 4th. “The speed that stock prices have soared by is extremely unusual, which underscores the structural bubbles in the stock market. China's increase in stamp duty is a proper forward-looking adjustment to avoid greater systemic risks in the market and to ensure its healthy development,” the state-owned China Securities Journal wrote. “The huge price fluctuations within each trading day reflect the fact that this trading is unsustainable,” the Xinhua News Agency- said.
The Shanghai Stock Index tumbled 7.25% in the morning of June 5th, to as low as 3,402, after PBoC chief Zhou Xiaochuan left open the possibility of further monetary tightening. “There are many reasons for price changes, including money supply, international market movements, domestic supply and demand and so forth. The central bank will use monetary policy to cope with it,” he warned.
Yet Shanghai red-chips finished the day with a furious 10% rally off the intra-day low to close 2.6% higher at 3,767-points. Bargain hunters swooped into the marketplace, after Shanghai red-chips had tumbled as much as 21% in four trading days, wiping out $450 billion of market value. Buyers spread rumors that Beijing would not introduce a capital gains tax for 3-years to stabilize the market.
There is an unshakeable belief that Beijing can move the red-chip market to its desires by remote control, thru jawboning and adjustments in the money supply. The rise in China's 5-year bond yield to 3.82% is not as threatening as it appears, when one considers that China's official inflation rate is expected to accelerate to 3.5% to 4% in the months ahead, reflecting sharply higher food prices.
However, there is a much bigger storm looming on the horizon that could overwhelm Beijing, and wreak further havoc on Chinese red-chips, its economy, and the Asian region. This gathering storm was under the spotlight in the May 25th and June 1st editions of Global Money Trends, with further updates for the June 8th edition .
This article is just the tip of the Iceberg, of what's available in the Global Money Trends newsletter, published on Friday mornings, for 44 issues per year!
By Gary Dorsch,
Editor, Global Money Trends newsletter
http://www.sirchartsalot.com
Here's what you will receive with a subscription, Insightful analysis and predictions for the (1) top dozen stock markets around the world, Exchange Traded Funds, and US home-builder indexes (2) Commodities such as crude oil, copper, gold, silver, the DJ Commodity Index, and gold mining and oil company indexes (3) Foreign currencies such as, the Australian dollar, British pound, Euro, Japanese yen, and Canadian dollar (4) Libor interest rates, global bond markets and central bank monetary policies, (5) Central banker "Jawboning" and Intervention techniques that move markets.
GMT filters important news and information into (1) bullet-point, easy to understand analysis, (2) featuring "Inter-Market Technical Analysis" that visually displays the dynamic inter-relationships between foreign currencies, commodities, interest rates and the stock markets from a dozen key countries around the world. Also included are (3) charts of key economic statistics of foreign countries that move markets.
A subscription to Global Money Trends is offered at only $140 US dollars per year for “44 weekly issues”, including access to all back issues. Click on the following hyperlink, to order now, http://www.sirchartsalot.com/newsletters.php Call toll free from USA to order, Sunday thru Thursday, 2 am to 4 pm EST, at 866-576-7872.
Mr Dorsch worked on the trading floor of the Chicago Mercantile Exchange for nine years as the chief Financial Futures Analyst for three clearing firms, Oppenheimer Rouse Futures Inc, GH Miller and Company, and a commodity fund at the LNS Financial Group.
As a transactional broker for Charles Schwab's Global Investment Services department, Mr Dorsch handled thousands of customer trades in 45 stock exchanges around the world, including Australia, Canada, Japan, Hong Kong, the Euro zone, London, Toronto, South Africa, Mexico, and New Zealand, and Canadian oil trusts, ADR's and Exchange Traded Funds.
He wrote a weekly newsletter from 2000 thru September 2005 called, "Foreign Currency Trends" for Charles Schwab's Global Investment department, featuring inter-market technical analysis, to understand the dynamic inter-relationships between the foreign exchange, global bond and stock markets, and key industrial commodities.
Copyright © 2005-2007 SirChartsAlot, Inc. All rights reserved.
Disclaimer: SirChartsAlot.com's analysis and insights are based upon data gathered by it from various sources believed to be reliable, complete and accurate. However, no guarantee is made by SirChartsAlot.com as to the reliability, completeness and accuracy of the data so analyzed. SirChartsAlot.com is in the business of gathering information, analyzing it and disseminating the analysis for informational and educational purposes only. SirChartsAlot.com attempts to analyze trends, not make recommendations. All statements and expressions are the opinion of SirChartsAlot.com and are not meant to be investment advice or solicitation or recommendation to establish market positions. Our opinions are subject to change without notice. SirChartsAlot.com strongly advises readers to conduct thorough research relevant to decisions and verify facts from various independent sources.
© 2005-2022 http://www.MarketOracle.co.uk - The Market Oracle is a FREE Daily Financial Markets Analysis & Forecasting online publication.


